| Param | Original file | Final file |
|---|---|---|
| Filename | modeM0/AS1C07_001T10_9000005844_43082cztM0_level2.fits | modeM0/AS1C07_001T10_9000005844_43082cztM0_level2_quad_clean.evt |
| Size (bytes) | 302,385,600 | 90,547,200 |
| Size | 288.4 MB | 86.4 MB |
| Events in quadrant A | 3,038,357 | 624,467 |
| Events in quadrant B | 2,664,299 | 635,168 |
| Events in quadrant C | 2,387,373 | 580,694 |
| Events in quadrant D | 2,715,360 | 552,453 |
| Mode SS | |||
|---|---|---|---|
| Quadrant | BADHDUFLAG | Total packets | Discarded packets |
| A | 0 | 102 | 0 |
| B | 0 | 102 | 0 |
| C | 0 | 102 | 0 |
| D | 0 | 102 | 0 |
| Mode M9 | |||
|---|---|---|---|
| Quadrant | BADHDUFLAG | Total packets | Discarded packets |
| A | 0 | 20 | 0 |
| B | 0 | 20 | 0 |
| C | 0 | 20 | 0 |
| D | 0 | 20 | 0 |
| Mode M0 | |||
|---|---|---|---|
| Quadrant | BADHDUFLAG | Total packets | Discarded packets |
| A | 0 | 11974 | 1 |
| B | 0 | 11011 | 1 |
| C | 0 | 10050 | 1 |
| D | 0 | 11305 | 1 |
| Quadrant | Total seconds | Saturated seconds | Saturation percentage |
|---|---|---|---|
| A | 4977 | 56 | 1.125176% |
| B | 4978 | 15 | 0.301326% |
| C | 4978 | 2 | 0.040177% |
| D | 4978 | 34 | 0.683005% |
Noise dominated data is calculated using 1-second bins in cleaned event files. If a bin has >2000 counts, and if more than 50% of those come from <1% of pixels, then it is considered to be noise-dominated and hence unusable.
| Quadrant | # 1 sec bins | Bins with >0 counts | Bins with >2000 counts | High rate bins dominated by noise | Noise dominated (total time) | Noise dominated (detector-on time) | Marked lightcurve |
|---|---|---|---|---|---|---|---|
| A | 7010 | 4978 | 33 | 33 | 0.47% | 0.66% | 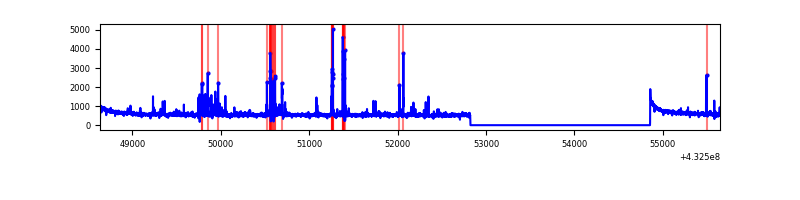 |
| B | 7011 | 4979 | 7 | 7 | 0.10% | 0.14% | 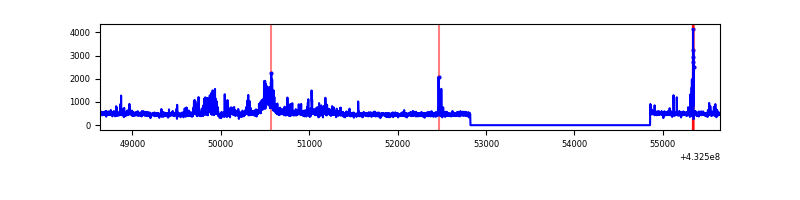 |
| C | 7011 | 4979 | 1 | 1 | 0.01% | 0.02% | 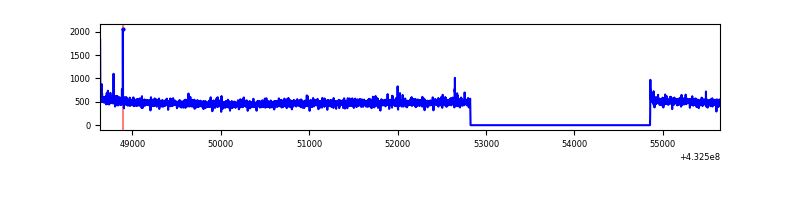 |
| D | 7011 | 4979 | 30 | 30 | 0.43% | 0.60% | 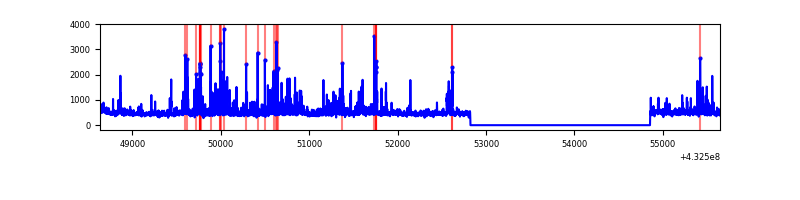 |
Top three noisy pixels from each quadrant. If the there are fewer than three noisy pixels in the level2.evt file, extra rows are filled as -1
| Pixel properties | Quadrant properties | ||||||
|---|---|---|---|---|---|---|---|
| Quadrant | DetID | PixID | Counts | Sigma | Mean | Median | Sigma |
| A | 10 | 83 | 542697 | 4667.54 | 575 | 565 | 116.1 |
| A | 15 | 237 | 204825 | 1758.6 | 575 | 565 | 116.1 |
| A | 12 | 189 | 31382 | 265.32 | 575 | 565 | 116.1 |
| B | 0 | 229 | 177060 | 1642.3 | 567 | 553 | 107.5 |
| B | 0 | 186 | 93651 | 866.23 | 567 | 553 | 107.5 |
| B | 4 | 36 | 72879 | 672.95 | 567 | 553 | 107.5 |
| C | 15 | 214 | 225781 | 1774.98 | 547 | 550 | 126.9 |
| C | 12 | 2 | 12252 | 92.22 | 547 | 550 | 126.9 |
| C | 1 | 128 | 7577 | 55.38 | 547 | 550 | 126.9 |
| D | 1 | 52 | 201519 | 1486.58 | 559 | 543 | 135.2 |
| D | 13 | 249 | 90951 | 668.73 | 559 | 543 | 135.2 |
| D | 12 | 233 | 73120 | 536.84 | 559 | 543 | 135.2 |
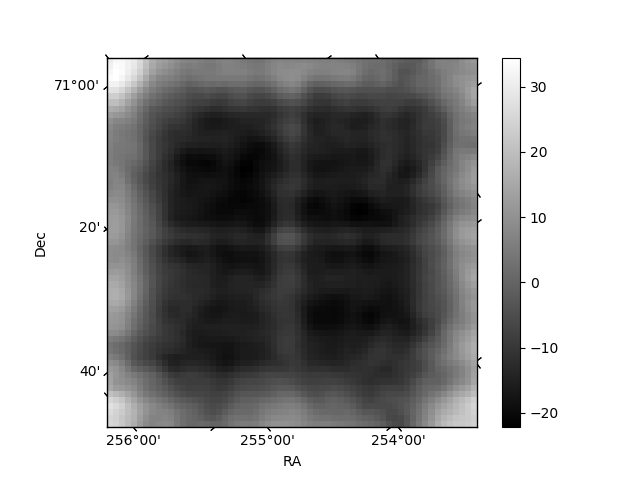
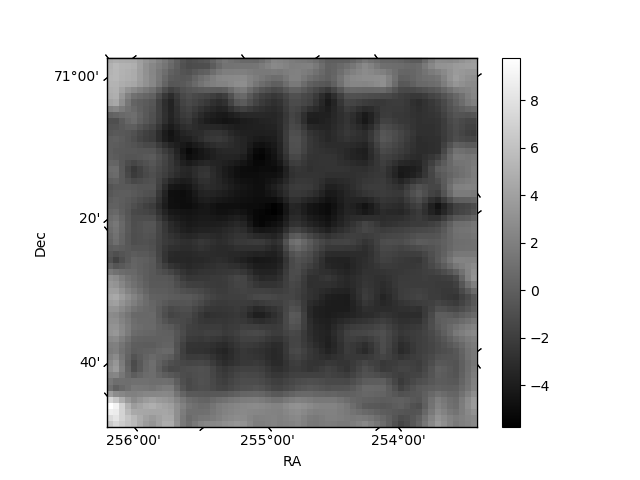
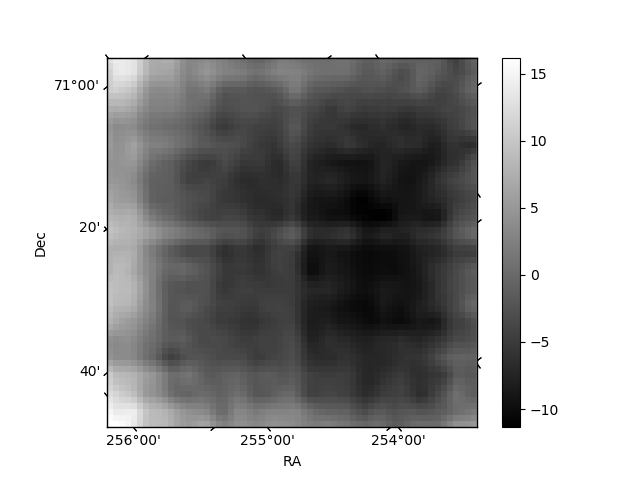
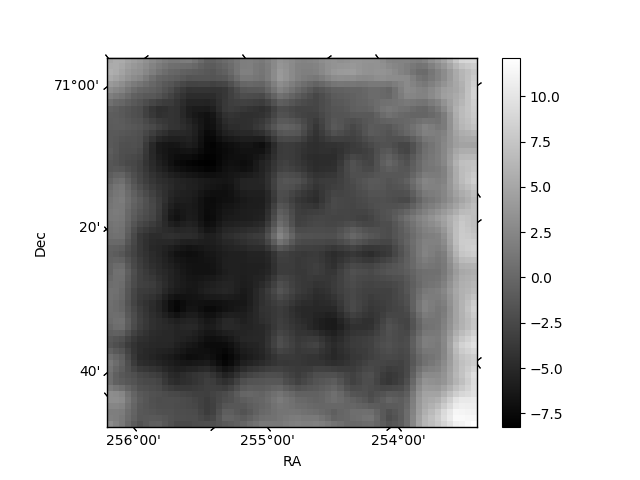
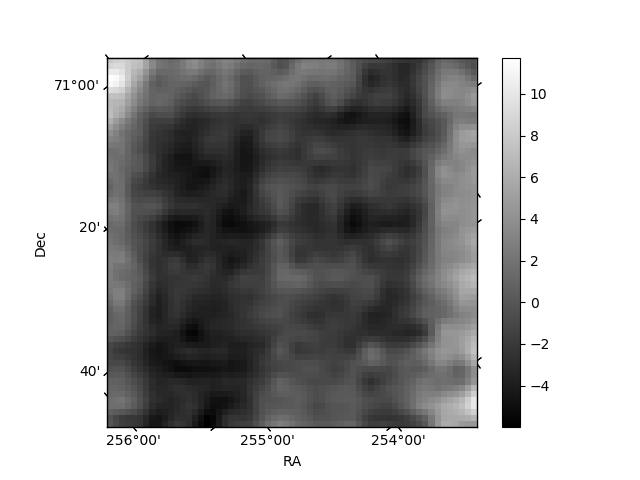
Histogram calculated using DETX and DETY for each event in the final _common_clean file
| Quadrant A | 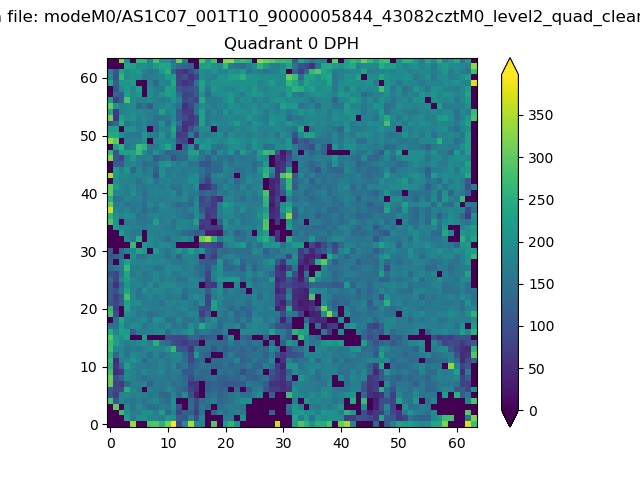 |
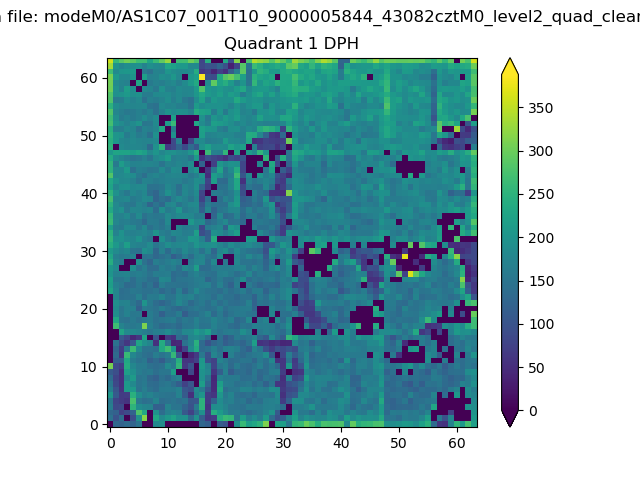 |
Quadrant B |
|---|---|---|---|
| Quadrant D | 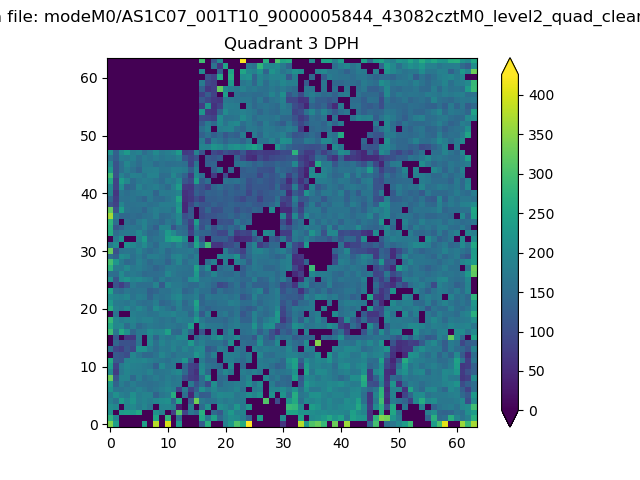 |
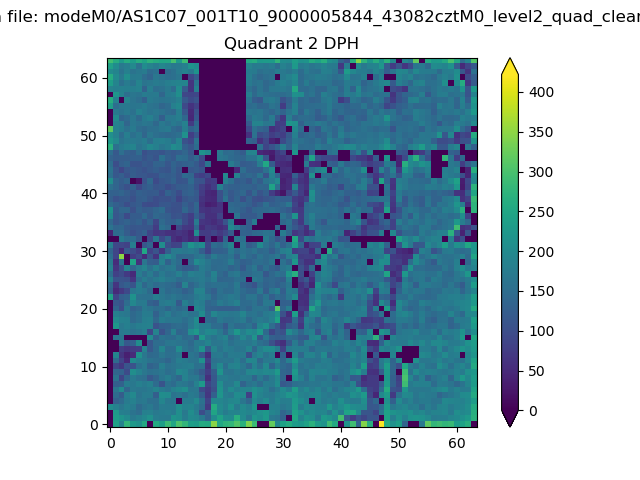 |
Quadrant C |
| Plot type | Count rate plots | Images |
|---|---|---|
| Comparison with Poisson distribution Blue bars denote a histogram of data divided into 1 sec bins. Red curve is a Poisson curve with rate = median count rate of data. |
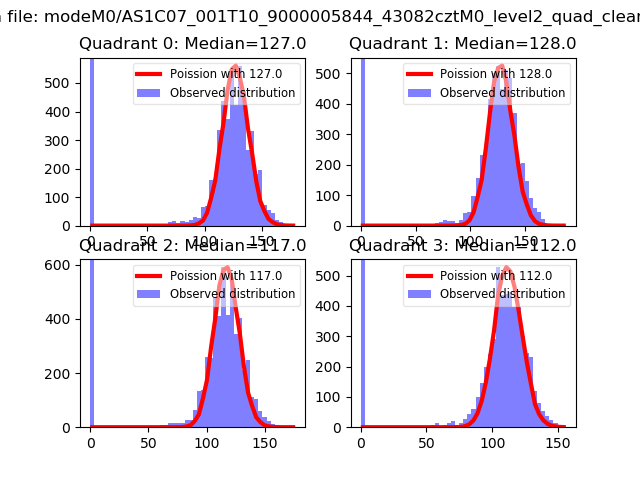 |
 |
| Quadrant-wise count rates Data is divided into 100 sec bins |
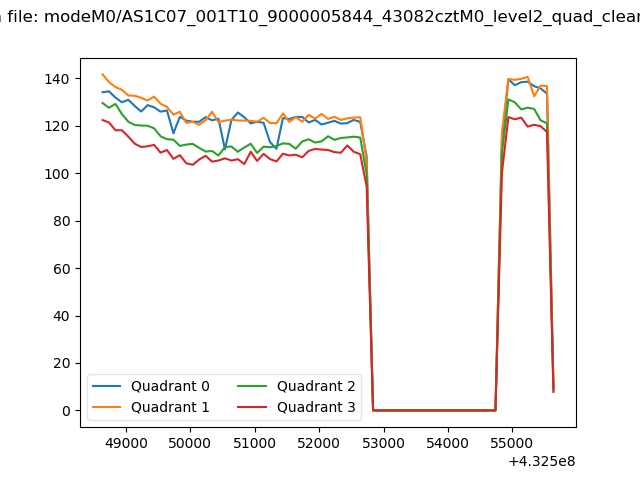 |
|
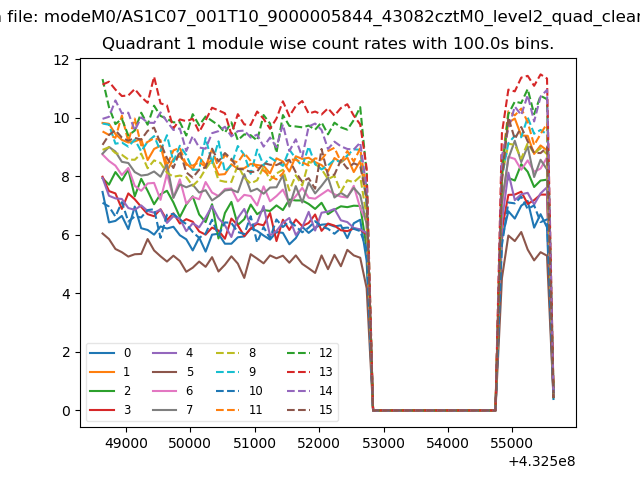
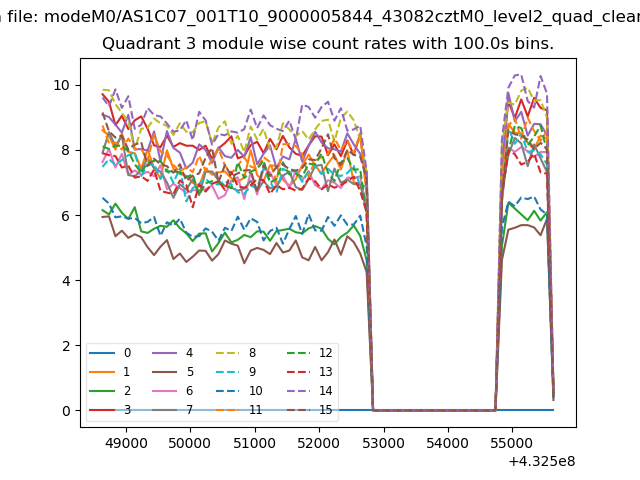
| Module-wise count rates for Quadrant A Data is divided into 100 sec bins |
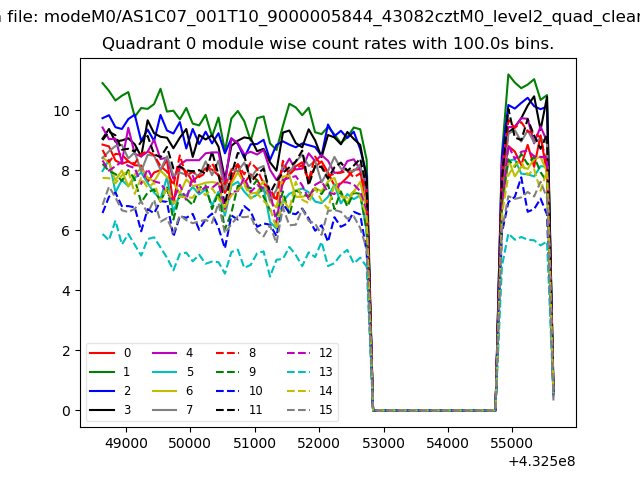 |
 |
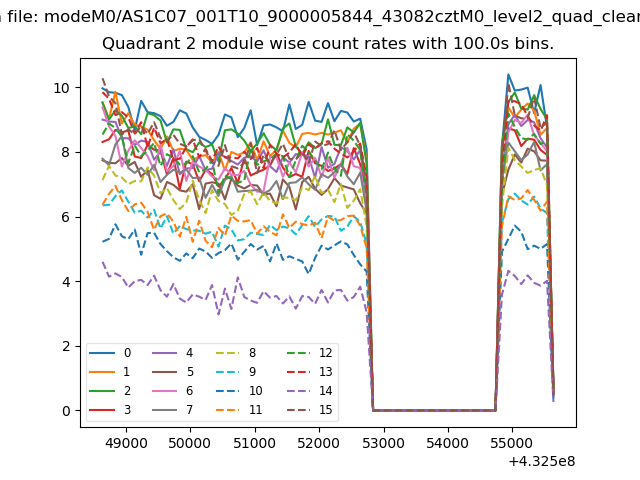
| Module-wise count rates for Quadrant B Data is divided into 100 sec bins |
 |
 |
| Module-wise count rates for Quadrant C Data is divided into 100 sec bins |
 |
 |
| Module-wise count rates for Quadrant D Data is divided into 100 sec bins |
 |
 |
| Parameter | Plot |
|---|---|
| CZT HV Monitor | 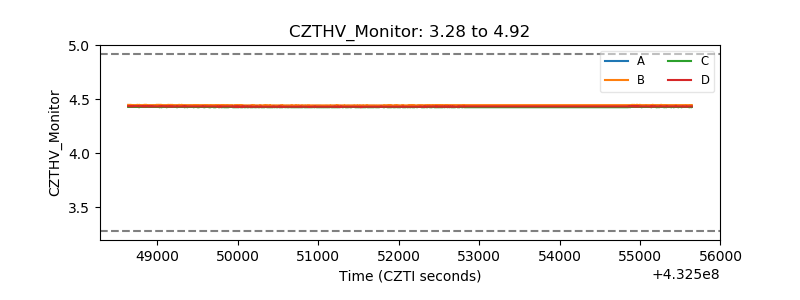 |
| D_VDD | 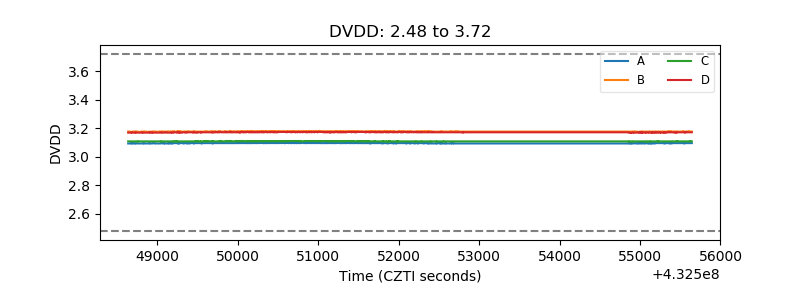 |
| Temperature 1 | 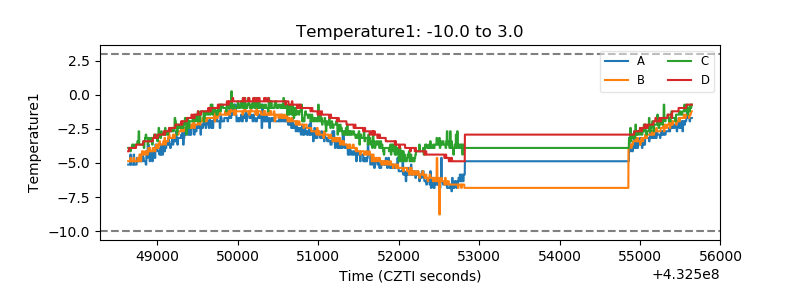 |
| Veto HV Monitor |  |
| Veto LLD | 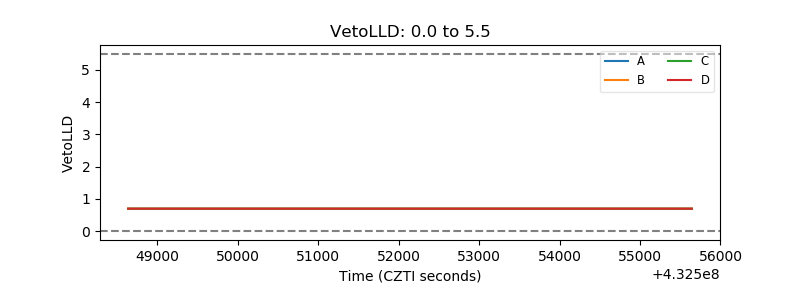 |
| Alpha Counter | 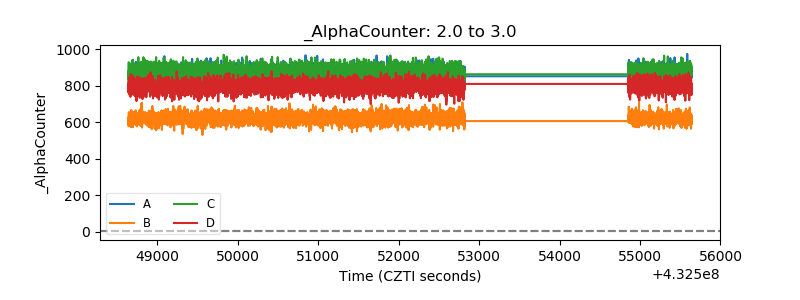 |
| _CPM_Rate | 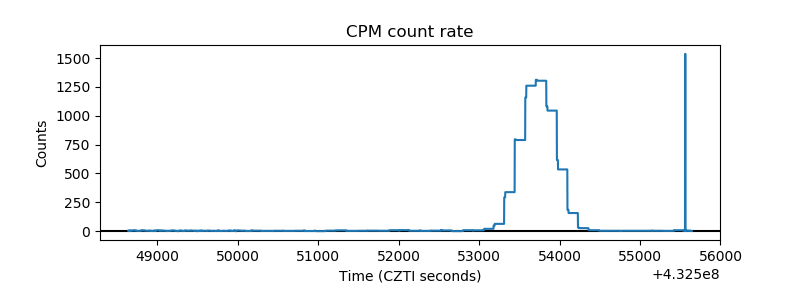 |
| CZT Counter | 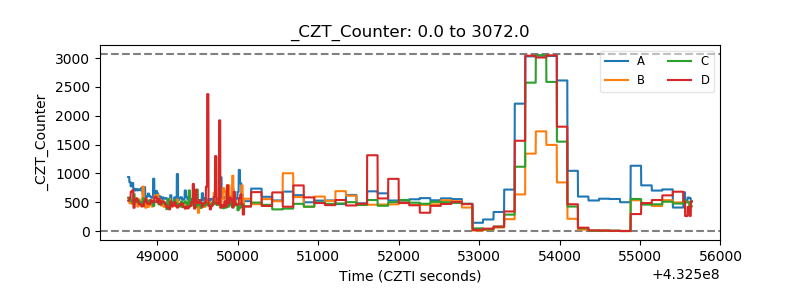 |
| +2.5 Volts monitor | 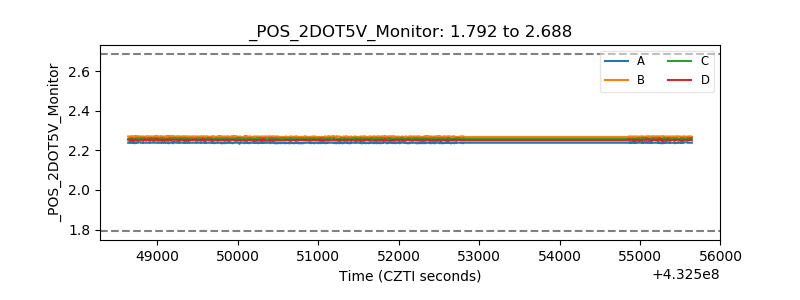 |
| +5 Volts monitor | 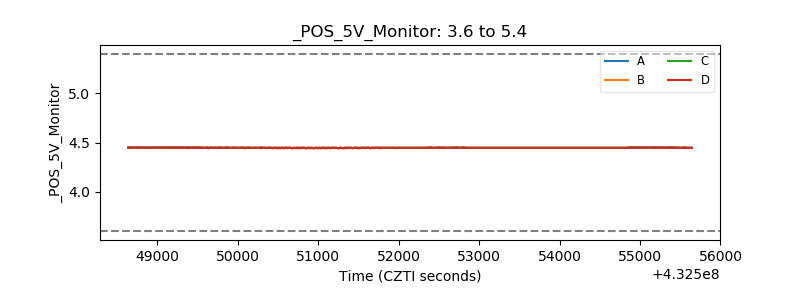 |
| _ROLL_ROT | 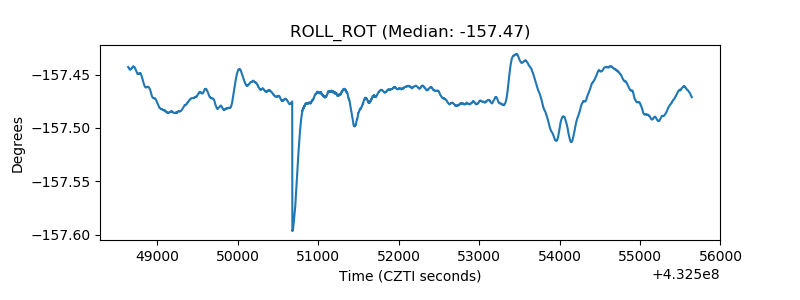 |
| _Roll_DEC | 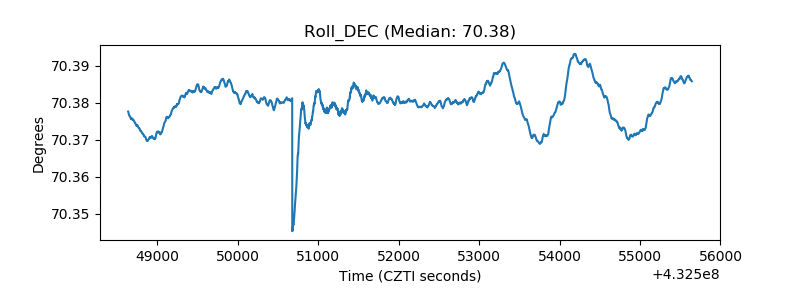 |
| _Roll_RA | 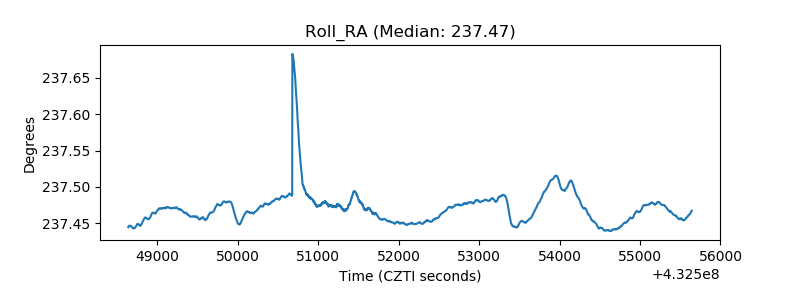 |
| Veto Counter | 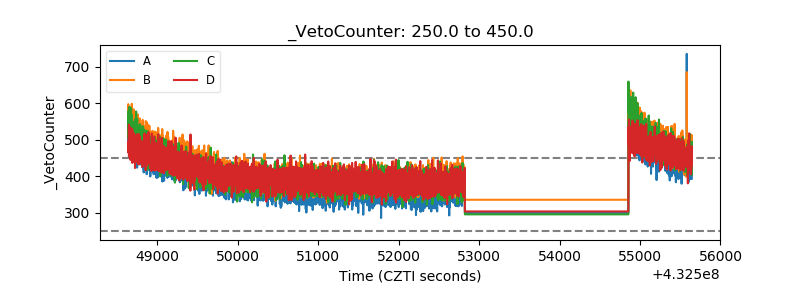 |