| Param | Original file | Final file |
|---|---|---|
| Filename | modeM0/AS1C07_001T10_9000005844_43083cztM0_level2.fits | modeM0/AS1C07_001T10_9000005844_43083cztM0_level2_quad_clean.evt |
| Size (bytes) | 149,722,560 | 36,921,600 |
| Size | 142.8 MB | 35.2 MB |
| Events in quadrant A | 1,377,416 | 264,775 |
| Events in quadrant B | 1,029,529 | 266,577 |
| Events in quadrant C | 1,413,293 | 224,641 |
| Events in quadrant D | 1,561,733 | 215,197 |
| Mode SS | |||
|---|---|---|---|
| Quadrant | BADHDUFLAG | Total packets | Discarded packets |
| A | 0 | 40 | 0 |
| B | 0 | 40 | 0 |
| C | 0 | 40 | 0 |
| D | 0 | 40 | 0 |
| Mode M9 | |||
|---|---|---|---|
| Quadrant | BADHDUFLAG | Total packets | Discarded packets |
| A | 1 | 140715398490152 | 140711718551598 |
| B | 1 | -1 | -1 |
| C | 1 | -1 | -1 |
| D | 1 | -1 | -1 |
| Mode M0 | |||
|---|---|---|---|
| Quadrant | BADHDUFLAG | Total packets | Discarded packets |
| A | 0 | 5444 | 1 |
| B | 0 | 4311 | 1 |
| C | 0 | 5398 | 1 |
| D | 0 | 5950 | 1 |
| Quadrant | Total seconds | Saturated seconds | Saturation percentage |
|---|---|---|---|
| A | 2027 | 25 | 1.233350% |
| B | 2027 | 10 | 0.493340% |
| C | 2027 | 180 | 8.880118% |
| D | 2027 | 185 | 9.126788% |
Noise dominated data is calculated using 1-second bins in cleaned event files. If a bin has >2000 counts, and if more than 50% of those come from <1% of pixels, then it is considered to be noise-dominated and hence unusable.
| Quadrant | # 1 sec bins | Bins with >0 counts | Bins with >2000 counts | High rate bins dominated by noise | Noise dominated (total time) | Noise dominated (detector-on time) | Marked lightcurve |
|---|---|---|---|---|---|---|---|
| A | 2027 | 2027 | 14 | 14 | 0.69% | 0.69% | 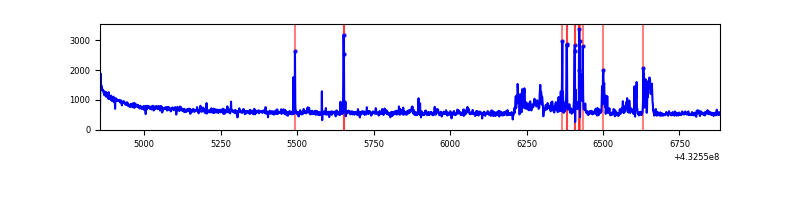 |
| B | 2027 | 2027 | 7 | 7 | 0.35% | 0.35% | 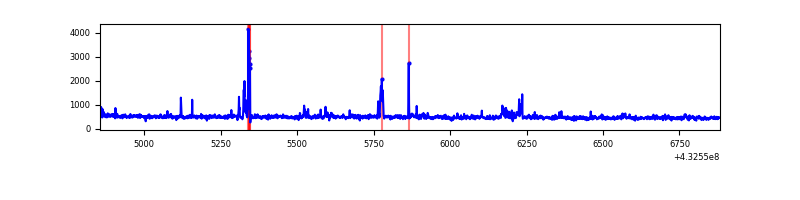 |
| C | 2027 | 2027 | 159 | 159 | 7.84% | 7.84% | 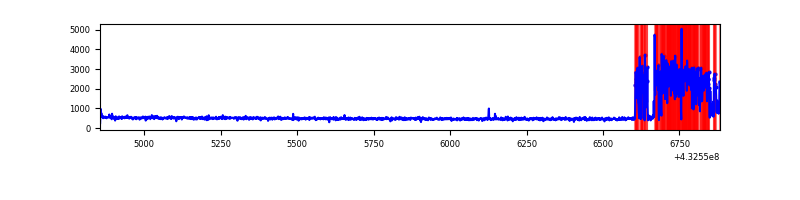 |
| D | 2027 | 2027 | 164 | 164 | 8.09% | 8.09% | 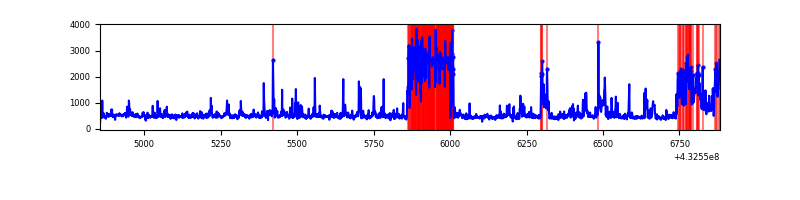 |
Top three noisy pixels from each quadrant. If the there are fewer than three noisy pixels in the level2.evt file, extra rows are filled as -1
| Pixel properties | Quadrant properties | ||||||
|---|---|---|---|---|---|---|---|
| Quadrant | DetID | PixID | Counts | Sigma | Mean | Median | Sigma |
| A | 10 | 83 | 259294 | 5225.48 | 239 | 235 | 49.6 |
| A | 15 | 237 | 99333 | 1998.91 | 239 | 235 | 49.6 |
| A | 12 | 189 | 88971 | 1789.89 | 239 | 235 | 49.6 |
| B | 5 | 255 | 47416 | 1049.12 | 232 | 226 | 45.0 |
| B | 0 | 229 | 31607 | 697.66 | 232 | 226 | 45.0 |
| B | 0 | 155 | 14115 | 308.78 | 232 | 226 | 45.0 |
| C | 2 | 16 | 469048 | 9226.19 | 216 | 217 | 50.8 |
| C | 15 | 214 | 90417 | 1775.06 | 216 | 217 | 50.8 |
| C | 1 | 128 | 2931 | 53.41 | 216 | 217 | 50.8 |
| D | 12 | 233 | 386488 | 7142.23 | 221 | 215 | 54.1 |
| D | 10 | 118 | 127704 | 2357.28 | 221 | 215 | 54.1 |
| D | 1 | 52 | 88959 | 1640.89 | 221 | 215 | 54.1 |
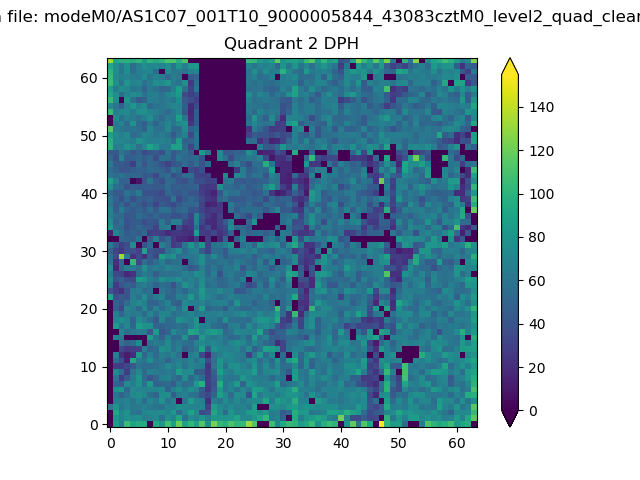
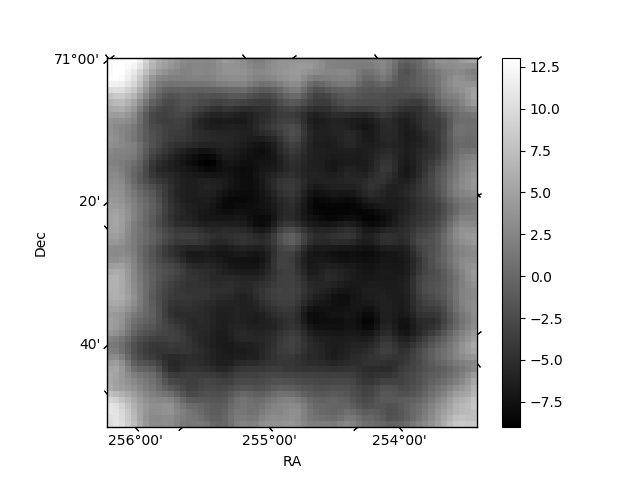
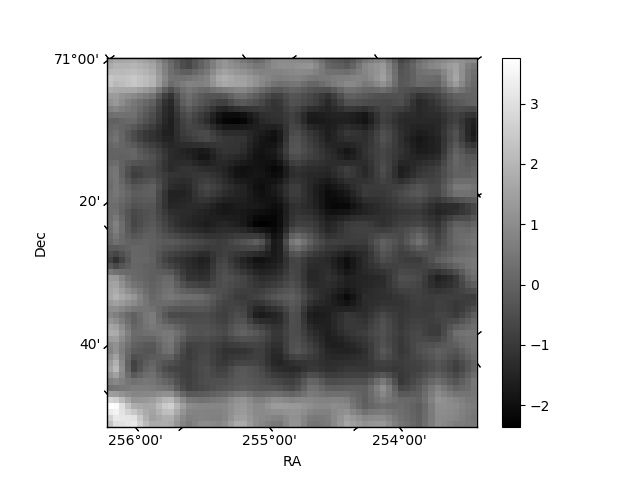
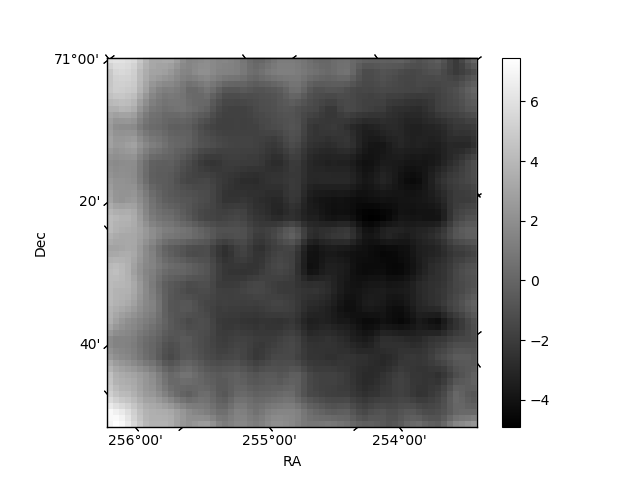
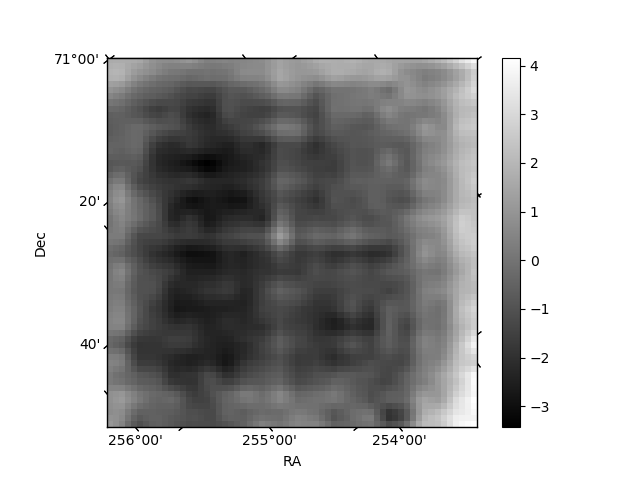
Histogram calculated using DETX and DETY for each event in the final _common_clean file
| Quadrant A | 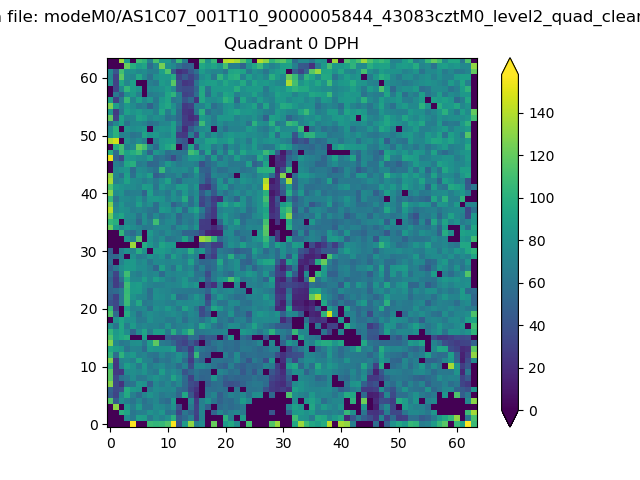 |
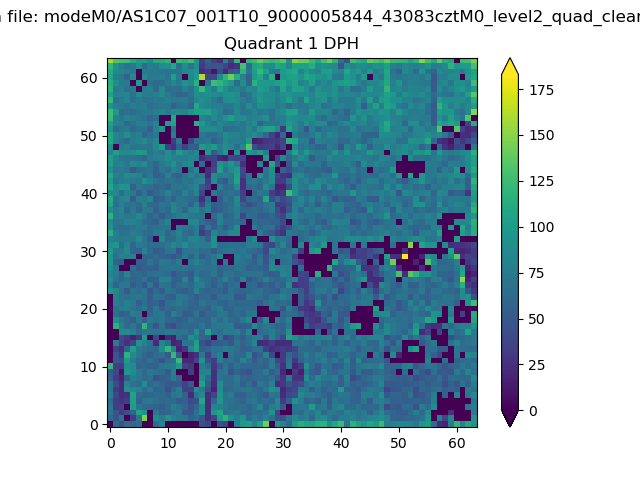 |
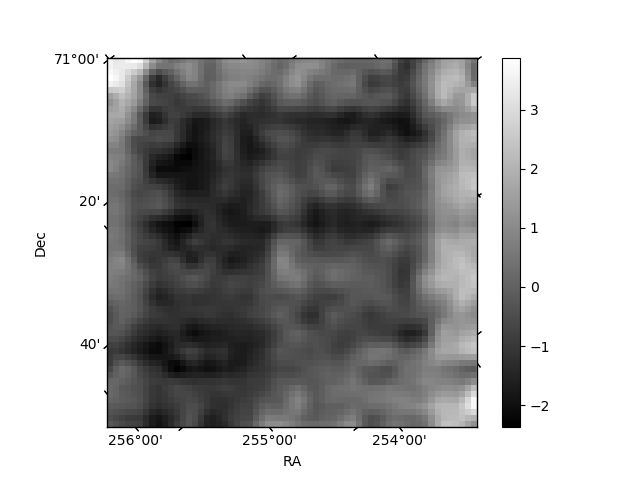
Quadrant B |
|---|---|---|---|
| Quadrant D | 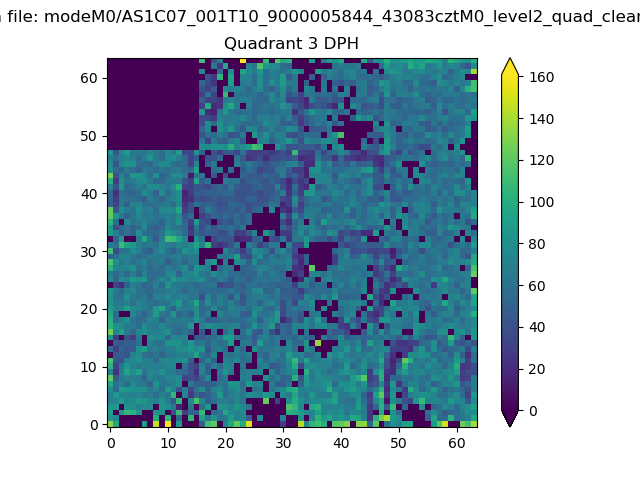 |
 |
Quadrant C |
| Plot type | Count rate plots | Images |
|---|---|---|
| Comparison with Poisson distribution Blue bars denote a histogram of data divided into 1 sec bins. Red curve is a Poisson curve with rate = median count rate of data. |
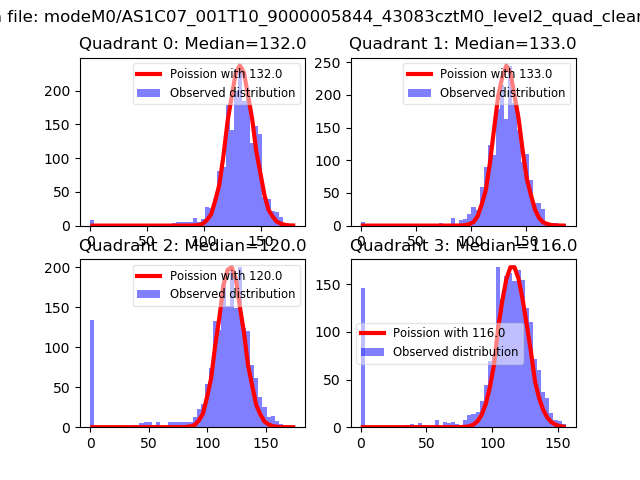 |
 |
| Quadrant-wise count rates Data is divided into 100 sec bins |
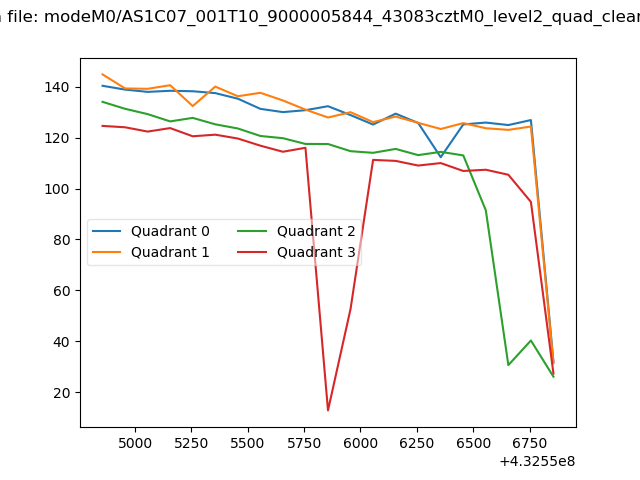 |
|
| Module-wise count rates for Quadrant A Data is divided into 100 sec bins |
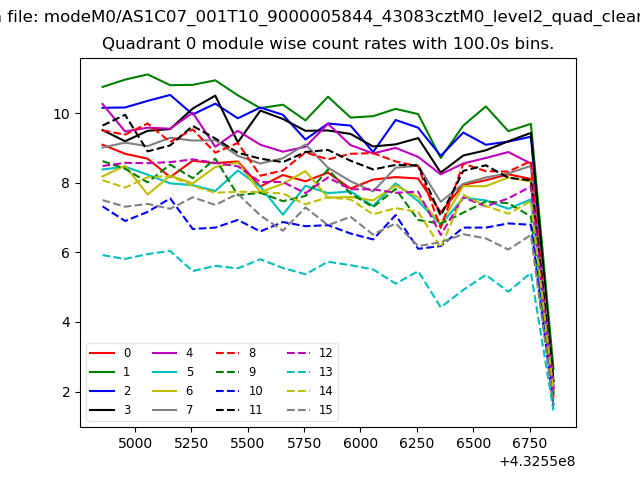 |
 |
| Module-wise count rates for Quadrant B Data is divided into 100 sec bins |
 |
 |
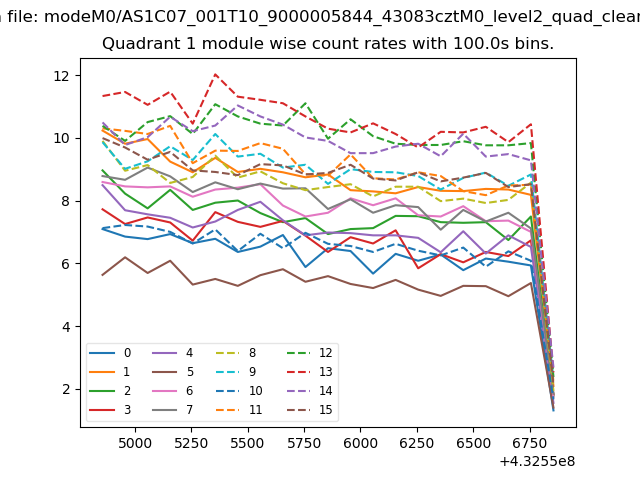
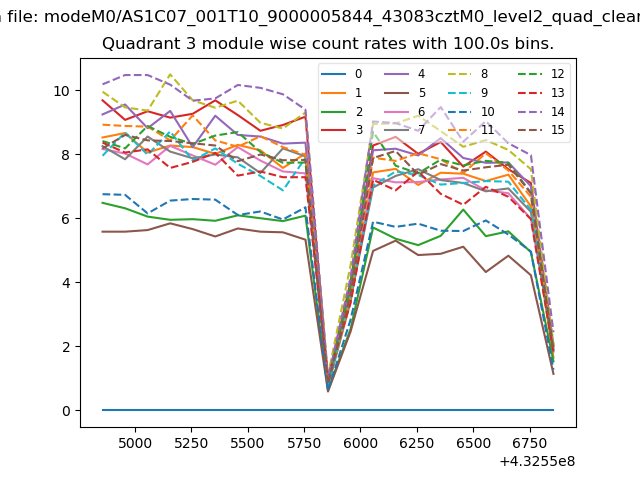
| Module-wise count rates for Quadrant C Data is divided into 100 sec bins |
 |
 |
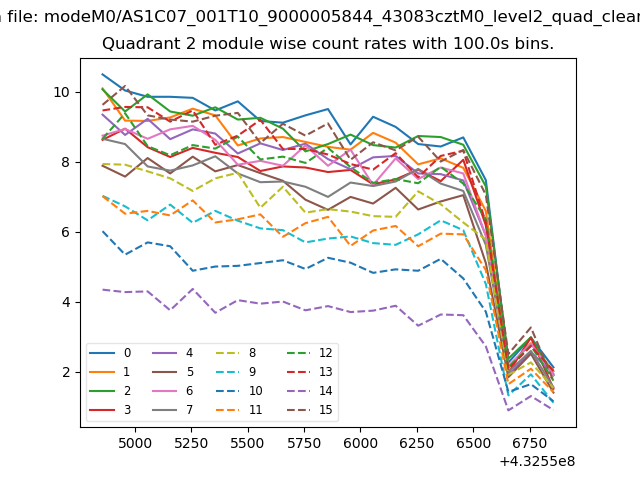
| Module-wise count rates for Quadrant D Data is divided into 100 sec bins |
 |
 |
| Parameter | Plot |
|---|---|
| CZT HV Monitor | 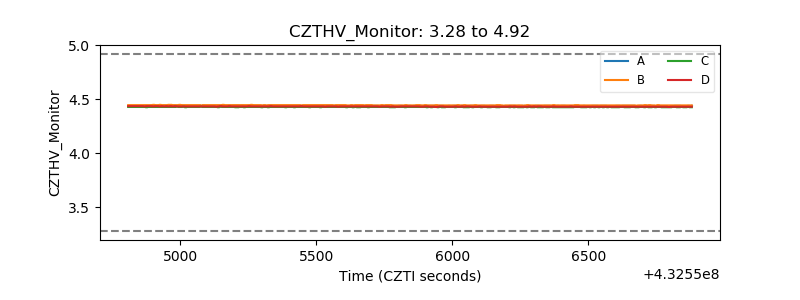 |
| D_VDD |  |
| Temperature 1 | 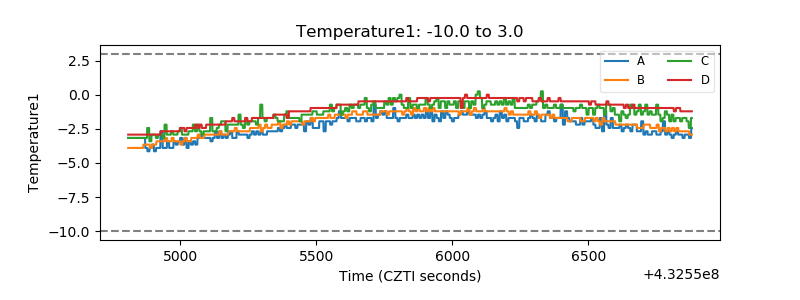 |
| Veto HV Monitor |  |
| Veto LLD | 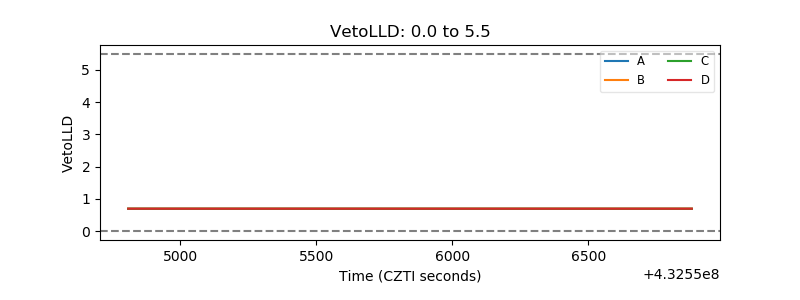 |
| Alpha Counter | 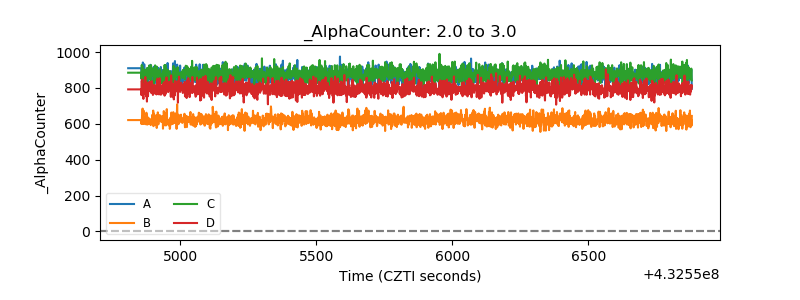 |
| _CPM_Rate | 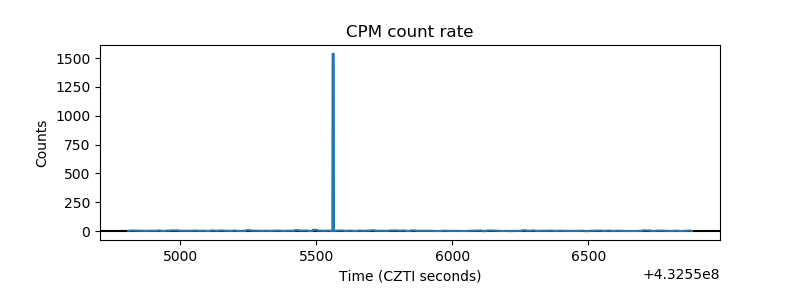 |
| CZT Counter | 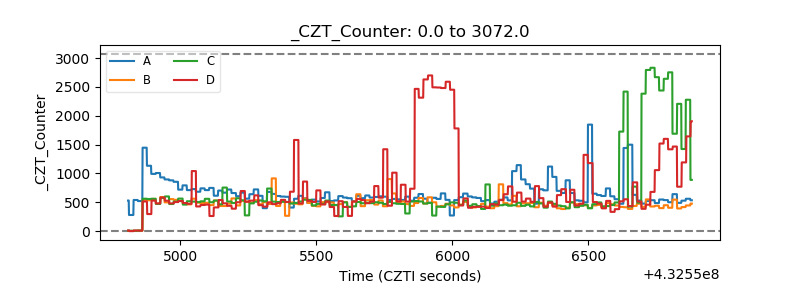 |
| +2.5 Volts monitor | 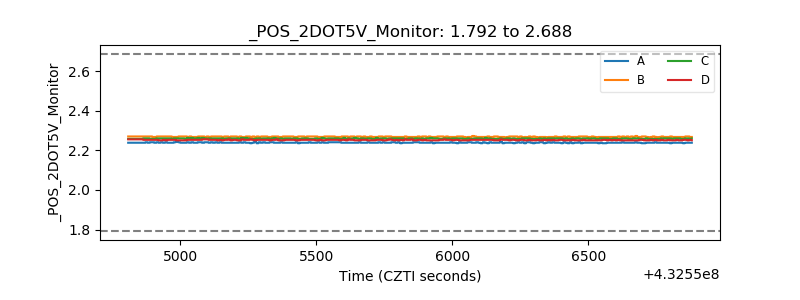 |
| +5 Volts monitor | 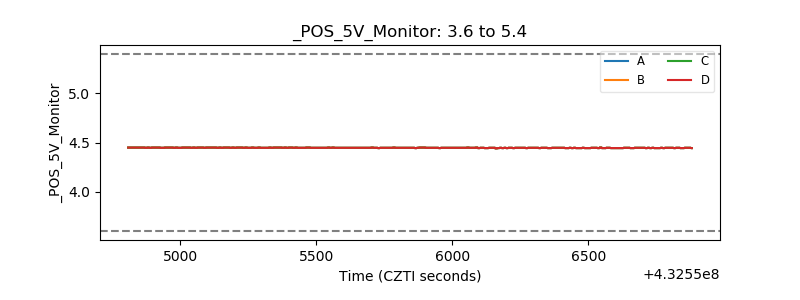 |
| _ROLL_ROT | 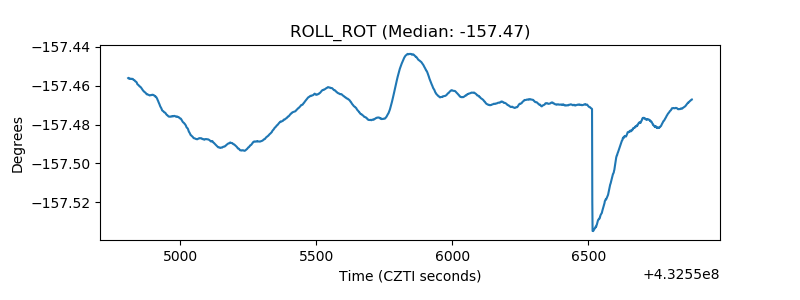 |
| _Roll_DEC | 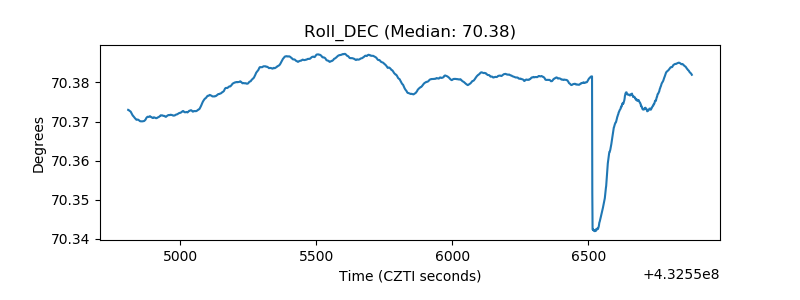 |
| _Roll_RA | 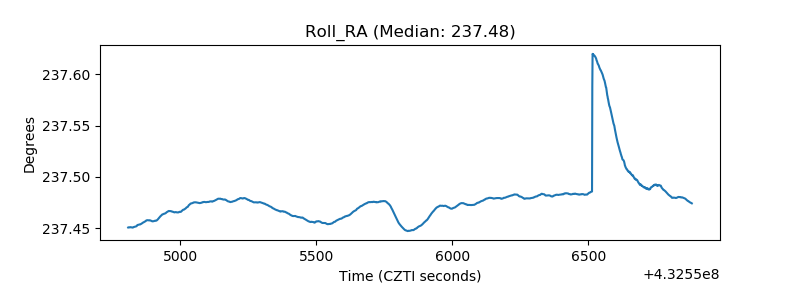 |
| Veto Counter | 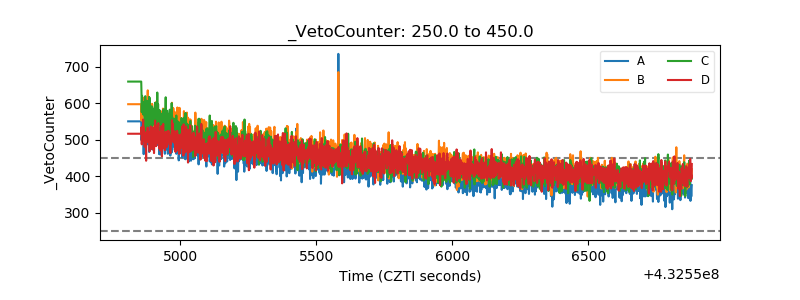 |