| Param | Original file | Final file |
|---|---|---|
| Filename | modeM0/AS1T05_152T01_9000005846_43083cztM0_level2.fits | modeM0/AS1T05_152T01_9000005846_43083cztM0_level2_quad_clean.evt |
| Size (bytes) | 156,268,800 | 46,399,680 |
| Size | 149.0 MB | 44.3 MB |
| Events in quadrant A | 1,547,029 | 321,749 |
| Events in quadrant B | 1,302,211 | 319,745 |
| Events in quadrant C | 1,286,608 | 305,362 |
| Events in quadrant D | 1,449,565 | 276,538 |
| Mode M0 | |||
|---|---|---|---|
| Quadrant | BADHDUFLAG | Total packets | Discarded packets |
| A | 0 | 6157 | 1 |
| B | 0 | 5449 | 1 |
| C | 0 | 5267 | 1 |
| D | 0 | 6009 | 1 |
| Mode SS | |||
|---|---|---|---|
| Quadrant | BADHDUFLAG | Total packets | Discarded packets |
| A | 0 | 54 | 0 |
| B | 0 | 54 | 0 |
| C | 0 | 54 | 0 |
| D | 0 | 54 | 0 |
| Mode M9 | |||
|---|---|---|---|
| Quadrant | BADHDUFLAG | Total packets | Discarded packets |
| A | 0 | 21 | 0 |
| B | 0 | 21 | 0 |
| C | 0 | 21 | 0 |
| D | 0 | 21 | 0 |
| Quadrant | Total seconds | Saturated seconds | Saturation percentage |
|---|---|---|---|
| A | 2531 | 20 | 0.790202% |
| B | 2531 | 25 | 0.987752% |
| C | 2531 | 8 | 0.316081% |
| D | 2531 | 84 | 3.318846% |
Noise dominated data is calculated using 1-second bins in cleaned event files. If a bin has >2000 counts, and if more than 50% of those come from <1% of pixels, then it is considered to be noise-dominated and hence unusable.
| Quadrant | # 1 sec bins | Bins with >0 counts | Bins with >2000 counts | High rate bins dominated by noise | Noise dominated (total time) | Noise dominated (detector-on time) | Marked lightcurve |
|---|---|---|---|---|---|---|---|
| A | 4624 | 2532 | 13 | 13 | 0.28% | 0.51% | 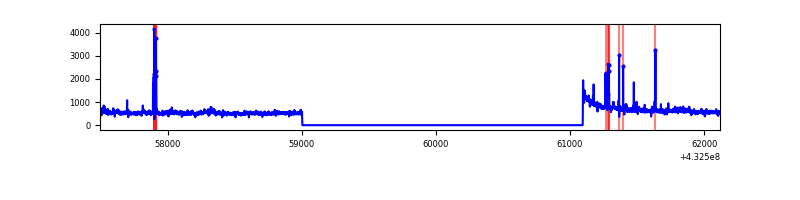 |
| B | 4624 | 2532 | 16 | 16 | 0.35% | 0.63% | 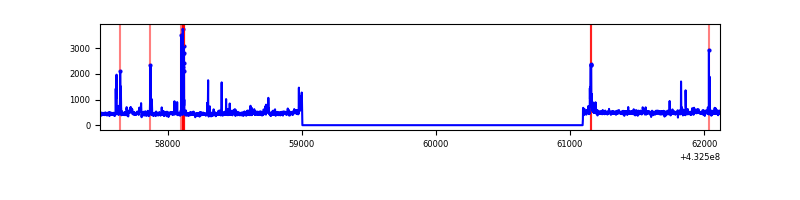 |
| C | 4624 | 2532 | 3 | 3 | 0.06% | 0.12% | 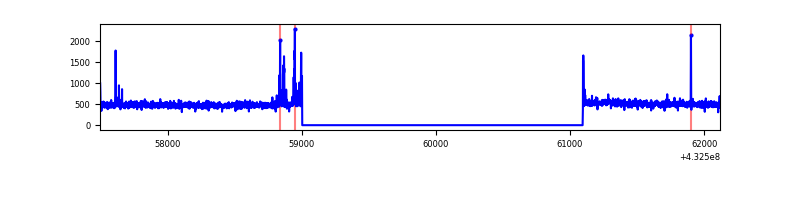 |
| D | 4624 | 2532 | 63 | 63 | 1.36% | 2.49% | 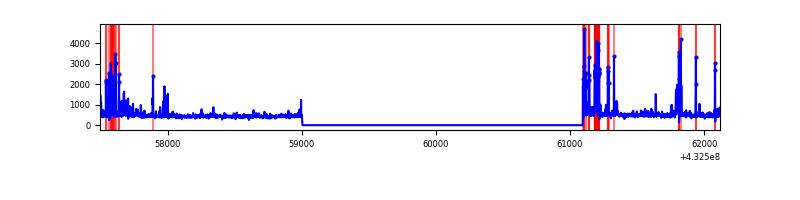 |
Top three noisy pixels from each quadrant. If the there are fewer than three noisy pixels in the level2.evt file, extra rows are filled as -1
| Pixel properties | Quadrant properties | ||||||
|---|---|---|---|---|---|---|---|
| Quadrant | DetID | PixID | Counts | Sigma | Mean | Median | Sigma |
| A | 10 | 83 | 293598 | 4786.02 | 294 | 289 | 61.3 |
| A | 15 | 237 | 59491 | 966.02 | 294 | 289 | 61.3 |
| A | 12 | 189 | 48773 | 791.13 | 294 | 289 | 61.3 |
| B | 3 | 112 | 63720 | 1123.15 | 290 | 282 | 56.5 |
| B | 5 | 255 | 51767 | 911.53 | 290 | 282 | 56.5 |
| B | 0 | 229 | 27043 | 473.8 | 290 | 282 | 56.5 |
| C | 15 | 214 | 113868 | 1695.73 | 286 | 288 | 67.0 |
| C | 12 | 2 | 50544 | 750.31 | 286 | 288 | 67.0 |
| C | 1 | 128 | 2900 | 39.0 | 286 | 288 | 67.0 |
| D | 13 | 249 | 114892 | 1635.44 | 283 | 275 | 70.1 |
| D | 1 | 52 | 91244 | 1298.02 | 283 | 275 | 70.1 |
| D | 12 | 218 | 35650 | 504.76 | 283 | 275 | 70.1 |
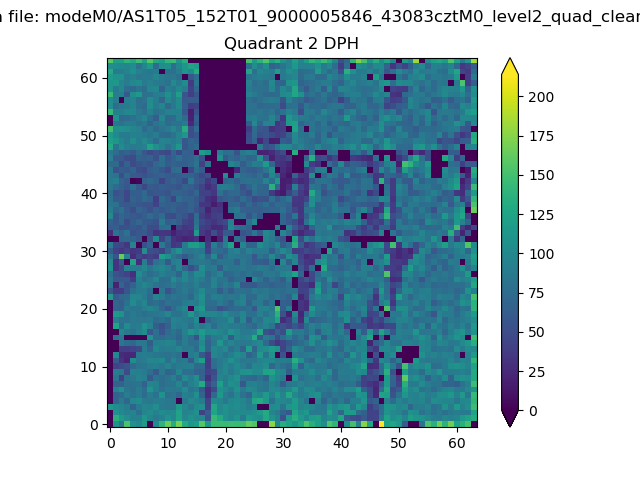
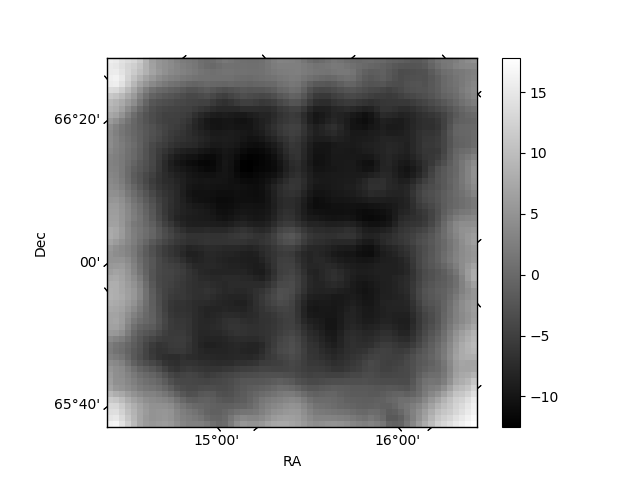
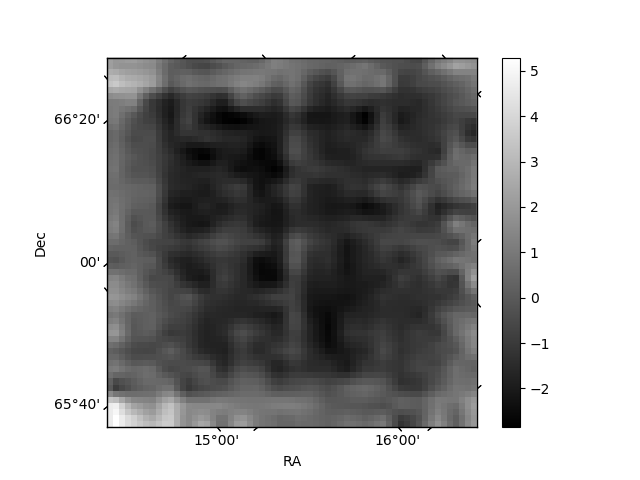
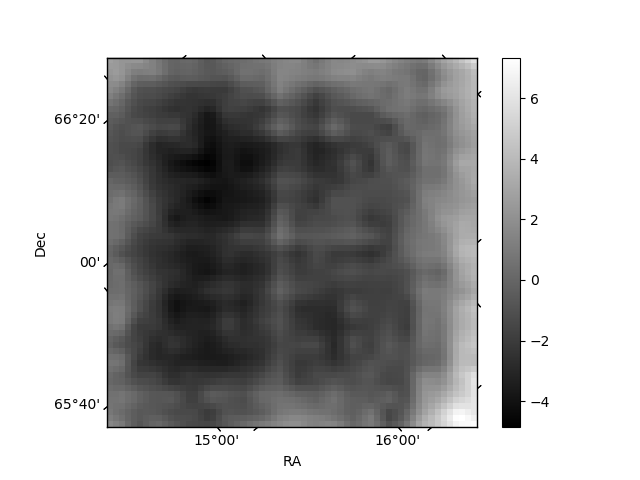
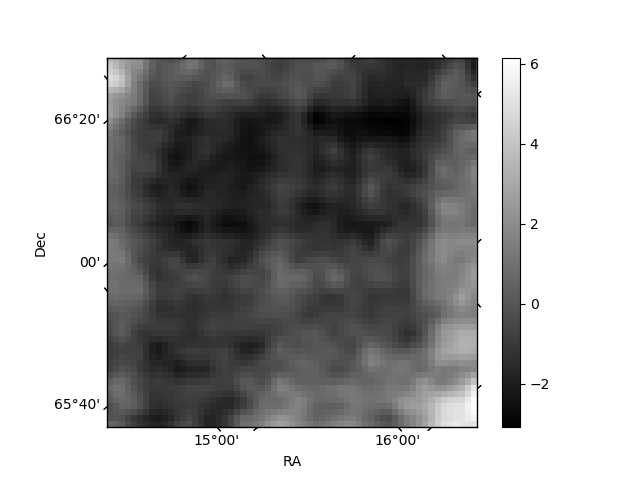
Histogram calculated using DETX and DETY for each event in the final _common_clean file
| Quadrant A | 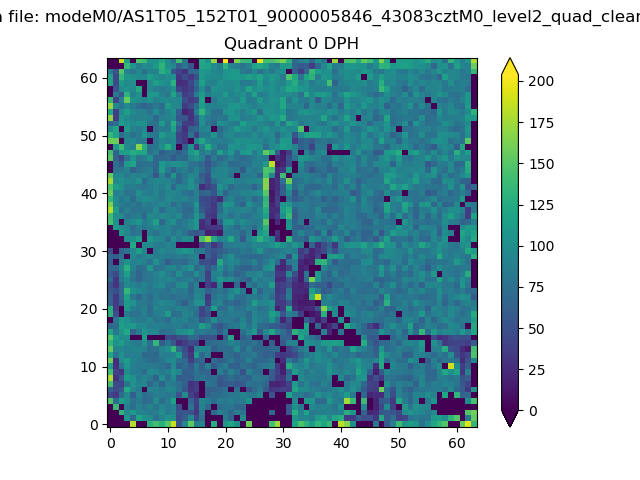 |
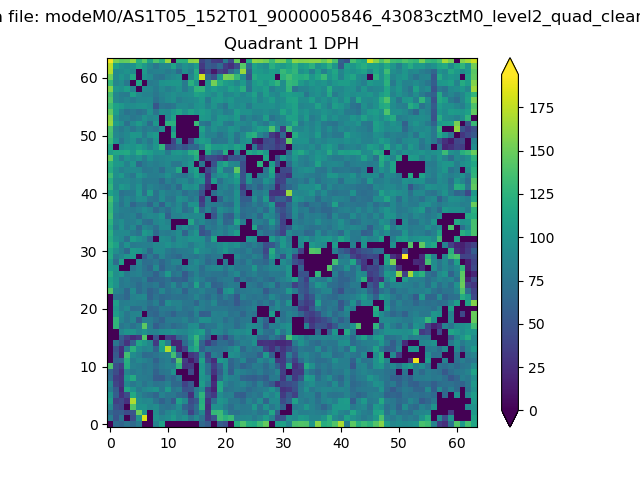 |
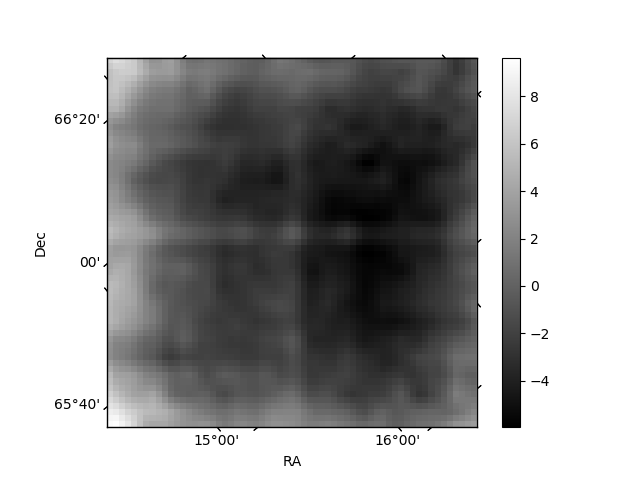
Quadrant B |
|---|---|---|---|
| Quadrant D | 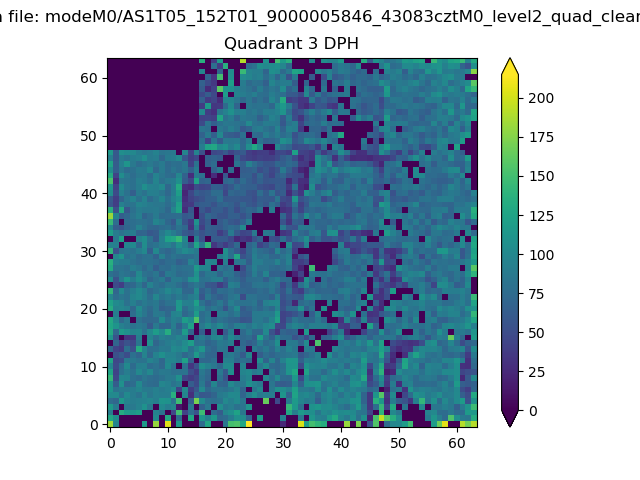 |
 |
Quadrant C |
| Plot type | Count rate plots | Images |
|---|---|---|
| Comparison with Poisson distribution Blue bars denote a histogram of data divided into 1 sec bins. Red curve is a Poisson curve with rate = median count rate of data. |
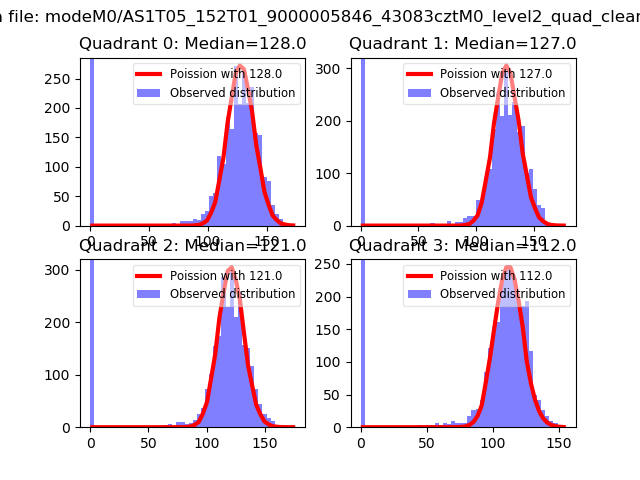 |
 |
| Quadrant-wise count rates Data is divided into 100 sec bins |
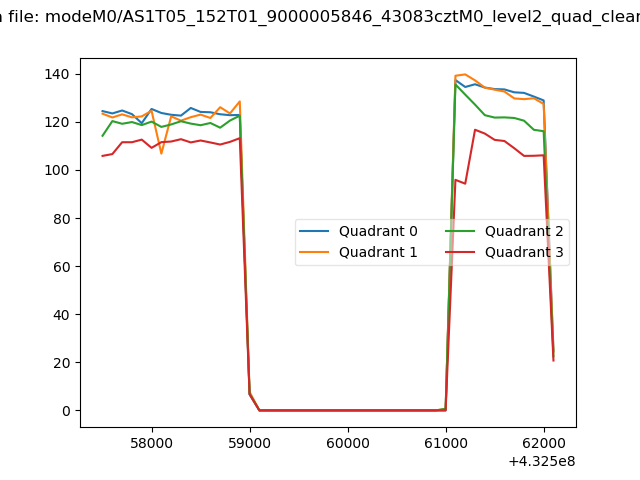 |
|
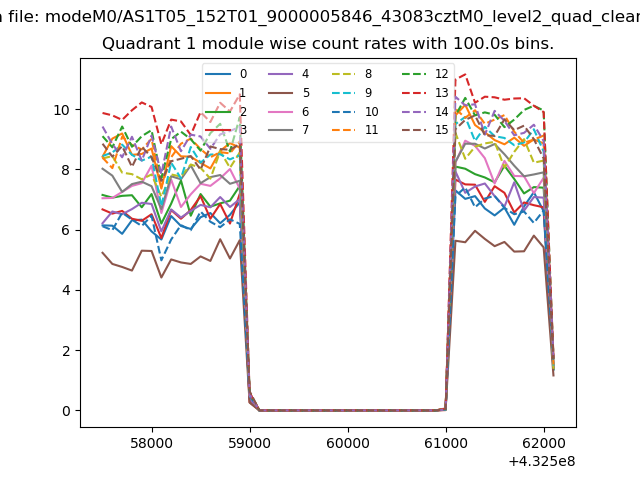
| Module-wise count rates for Quadrant A Data is divided into 100 sec bins |
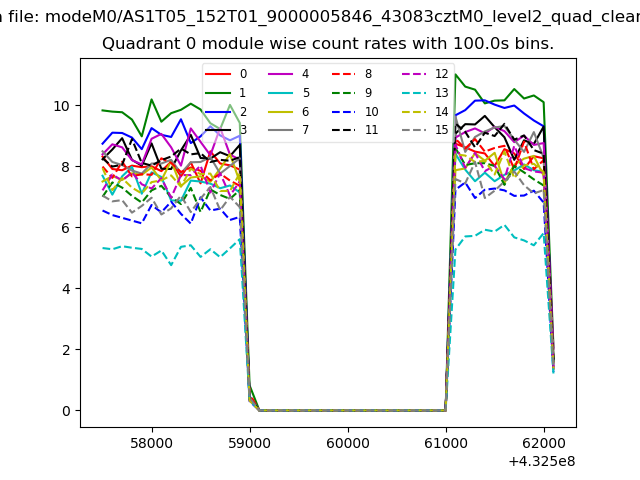 |
 |
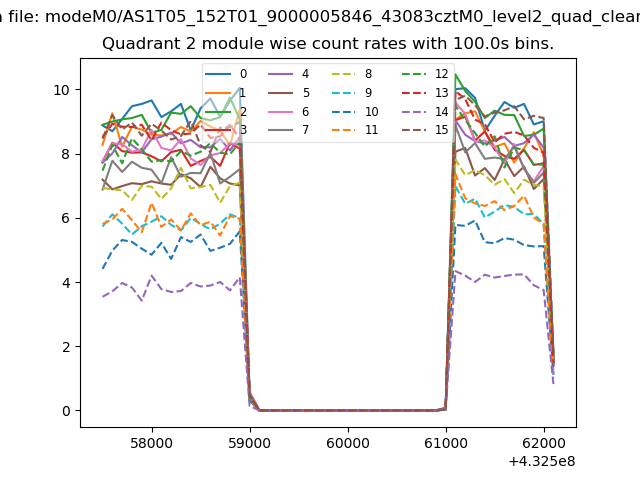
| Module-wise count rates for Quadrant B Data is divided into 100 sec bins |
 |
 |
| Module-wise count rates for Quadrant C Data is divided into 100 sec bins |
 |
 |
| Module-wise count rates for Quadrant D Data is divided into 100 sec bins |
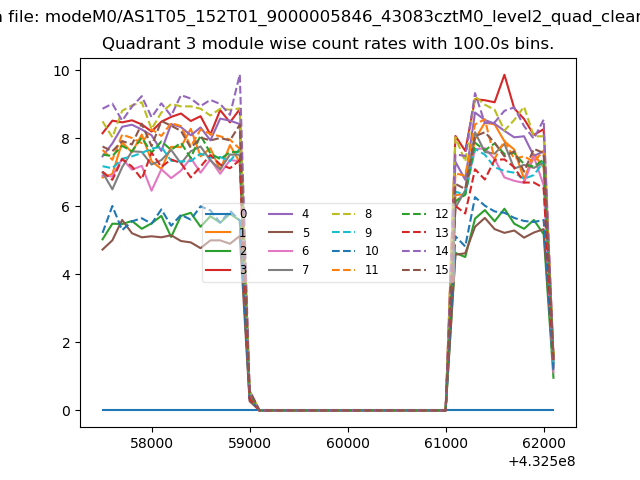 |
 |
| Parameter | Plot |
|---|---|
| CZT HV Monitor | 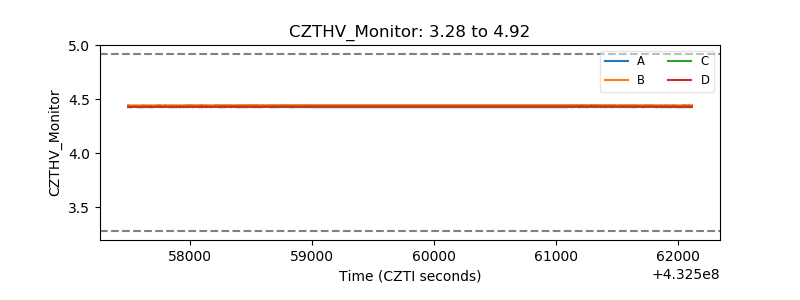 |
| D_VDD | 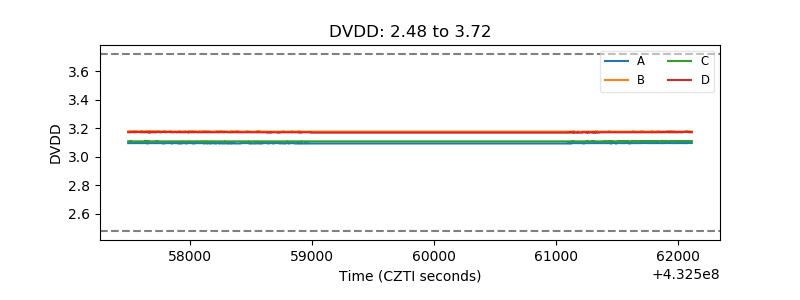 |
| Temperature 1 | 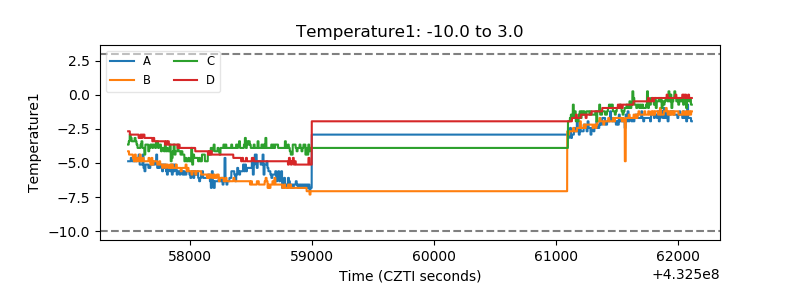 |
| Veto HV Monitor | 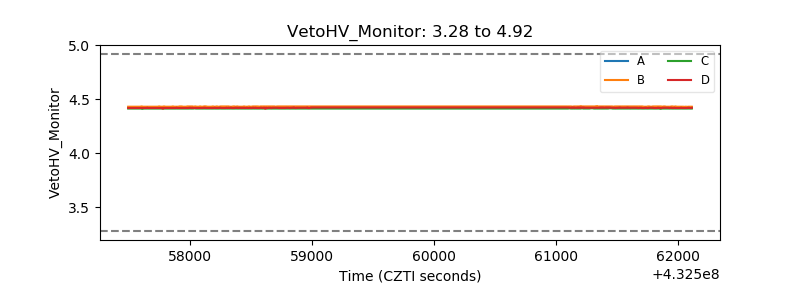 |
| Veto LLD | 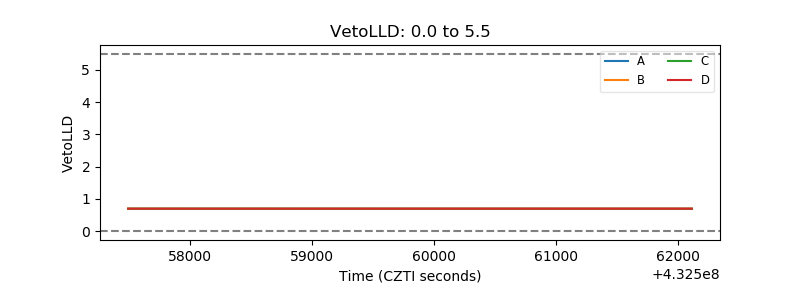 |
| Alpha Counter | 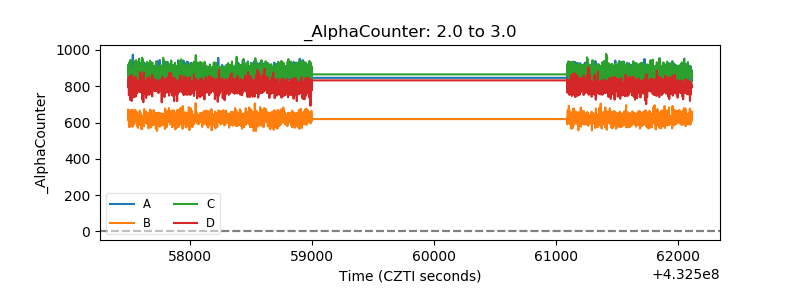 |
| _CPM_Rate | 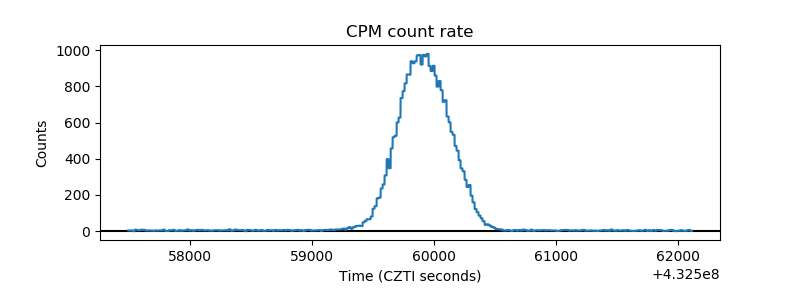 |
| CZT Counter | 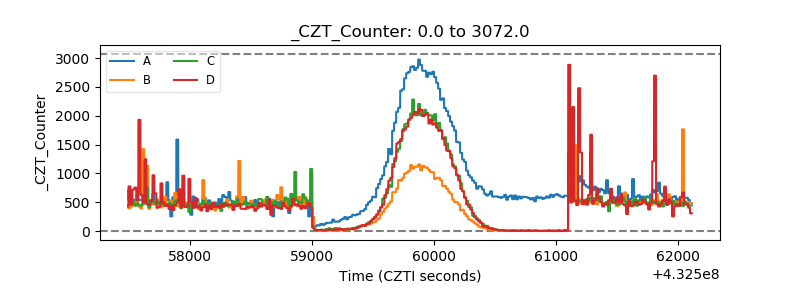 |
| +2.5 Volts monitor | 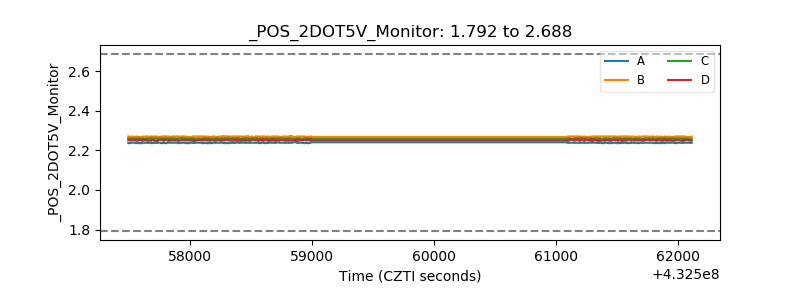 |
| +5 Volts monitor | 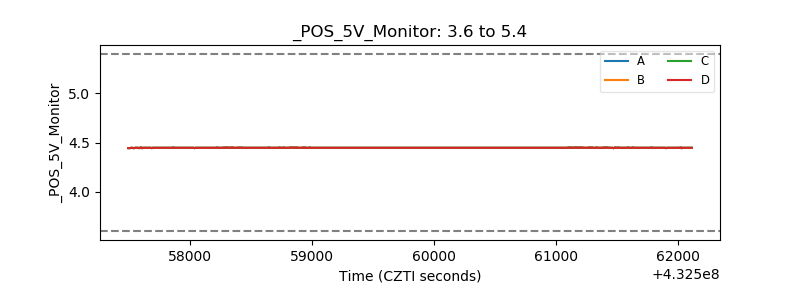 |
| _ROLL_ROT | 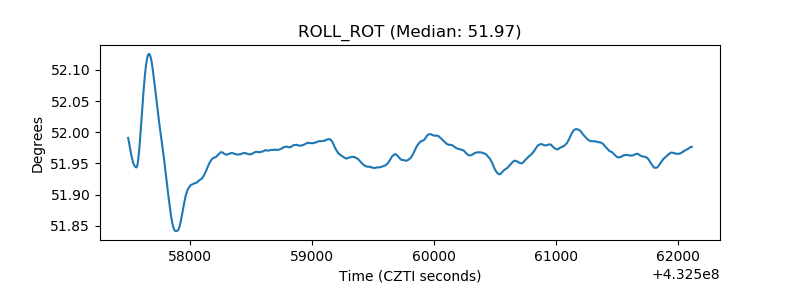 |
| _Roll_DEC | 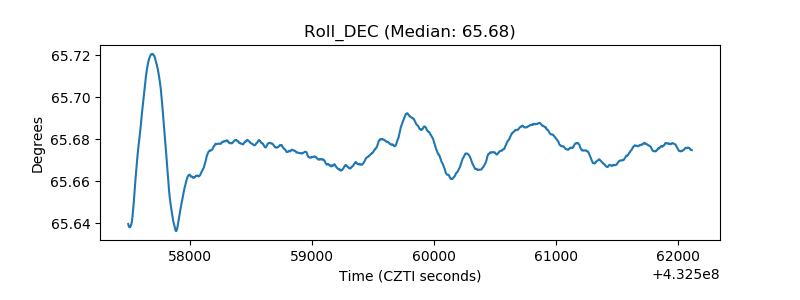 |
| _Roll_RA | 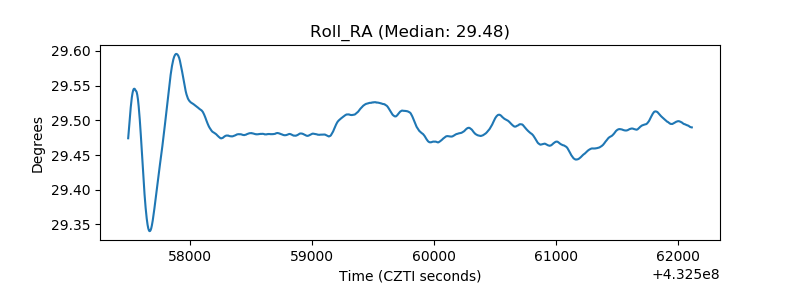 |
| Veto Counter | 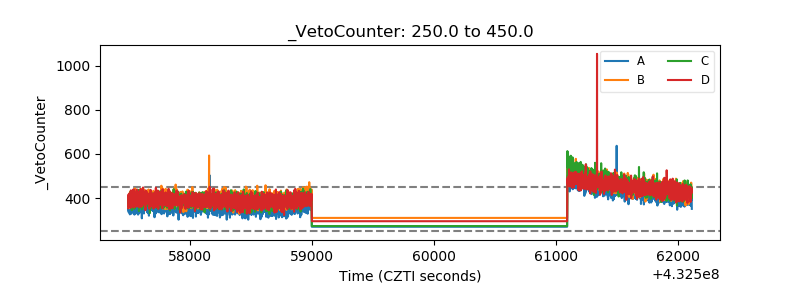 |