| Param | Original file | Final file |
|---|---|---|
| Filename | modeM0/AS1T05_152T01_9000005846_43084cztM0_level2.fits | modeM0/AS1T05_152T01_9000005846_43084cztM0_level2_quad_clean.evt |
| Size (bytes) | 332,020,800 | 90,504,000 |
| Size | 316.6 MB | 86.3 MB |
| Events in quadrant A | 3,601,068 | 612,277 |
| Events in quadrant B | 2,583,242 | 633,657 |
| Events in quadrant C | 2,492,672 | 596,534 |
| Events in quadrant D | 3,213,904 | 538,539 |
| Mode M0 | |||
|---|---|---|---|
| Quadrant | BADHDUFLAG | Total packets | Discarded packets |
| A | 0 | 13957 | 2 |
| B | 0 | 10909 | 2 |
| C | 0 | 10392 | 2 |
| D | 0 | 12993 | 2 |
| Mode SS | |||
|---|---|---|---|
| Quadrant | BADHDUFLAG | Total packets | Discarded packets |
| A | 0 | 106 | 0 |
| B | 0 | 106 | 0 |
| C | 0 | 106 | 0 |
| D | 0 | 106 | 0 |
| Mode M9 | |||
|---|---|---|---|
| Quadrant | BADHDUFLAG | Total packets | Discarded packets |
| A | 0 | 21 | 0 |
| B | 0 | 22 | 0 |
| C | 0 | 22 | 0 |
| D | 0 | 22 | 0 |
| Quadrant | Total seconds | Saturated seconds | Saturation percentage |
|---|---|---|---|
| A | 5126 | 245 | 4.779555% |
| B | 5126 | 23 | 0.448693% |
| C | 5126 | 3 | 0.058525% |
| D | 5126 | 229 | 4.467421% |
Noise dominated data is calculated using 1-second bins in cleaned event files. If a bin has >2000 counts, and if more than 50% of those come from <1% of pixels, then it is considered to be noise-dominated and hence unusable.
| Quadrant | # 1 sec bins | Bins with >0 counts | Bins with >2000 counts | High rate bins dominated by noise | Noise dominated (total time) | Noise dominated (detector-on time) | Marked lightcurve |
|---|---|---|---|---|---|---|---|
| A | 7248 | 5127 | 194 | 194 | 2.68% | 3.78% | 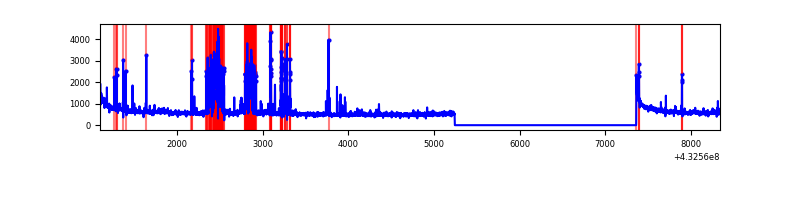 |
| B | 7248 | 5127 | 11 | 11 | 0.15% | 0.21% | 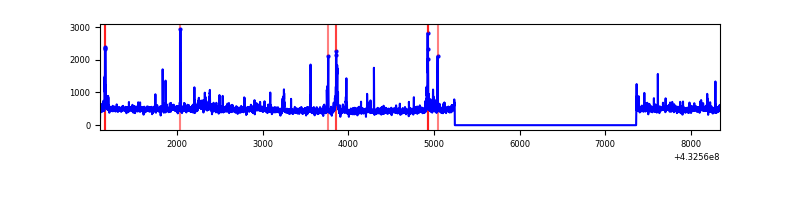 |
| C | 7248 | 5127 | 1 | 1 | 0.01% | 0.02% | 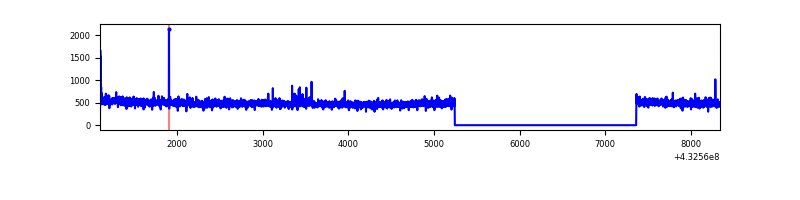 |
| D | 7248 | 5127 | 181 | 181 | 2.50% | 3.53% | 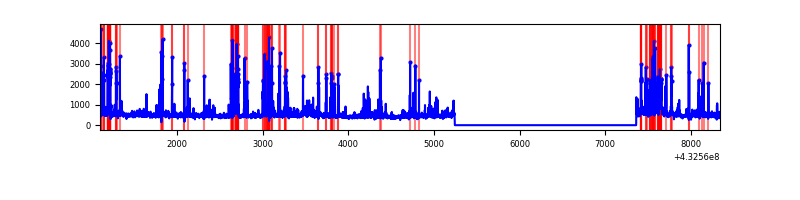 |
Top three noisy pixels from each quadrant. If the there are fewer than three noisy pixels in the level2.evt file, extra rows are filled as -1
| Pixel properties | Quadrant properties | ||||||
|---|---|---|---|---|---|---|---|
| Quadrant | DetID | PixID | Counts | Sigma | Mean | Median | Sigma |
| A | 15 | 237 | 675971 | 5767.51 | 578 | 567 | 117.1 |
| A | 10 | 83 | 611754 | 5219.14 | 578 | 567 | 117.1 |
| A | 12 | 189 | 47388 | 399.82 | 578 | 567 | 117.1 |
| B | 0 | 189 | 85876 | 769.95 | 579 | 564 | 110.8 |
| B | 3 | 112 | 79728 | 714.46 | 579 | 564 | 110.8 |
| B | 0 | 229 | 69595 | 623.01 | 579 | 564 | 110.8 |
| C | 15 | 214 | 233154 | 1775.53 | 566 | 570 | 131.0 |
| C | 12 | 2 | 14441 | 105.89 | 566 | 570 | 131.0 |
| C | 1 | 128 | 14335 | 105.08 | 566 | 570 | 131.0 |
| D | 1 | 52 | 342068 | 2508.26 | 561 | 545 | 136.2 |
| D | 10 | 118 | 228102 | 1671.25 | 561 | 545 | 136.2 |
| D | 12 | 218 | 146673 | 1073.21 | 561 | 545 | 136.2 |
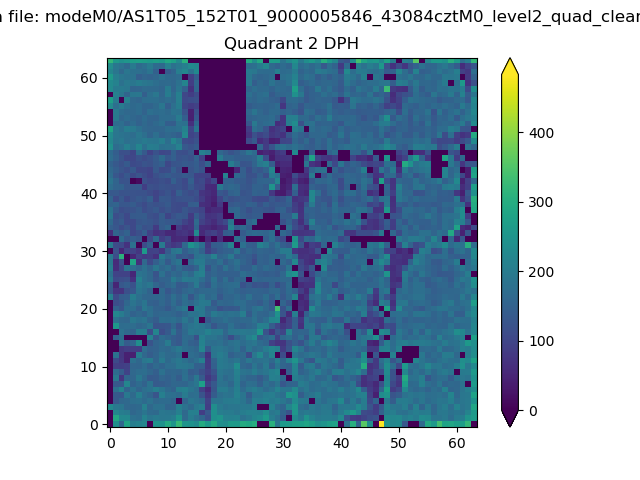
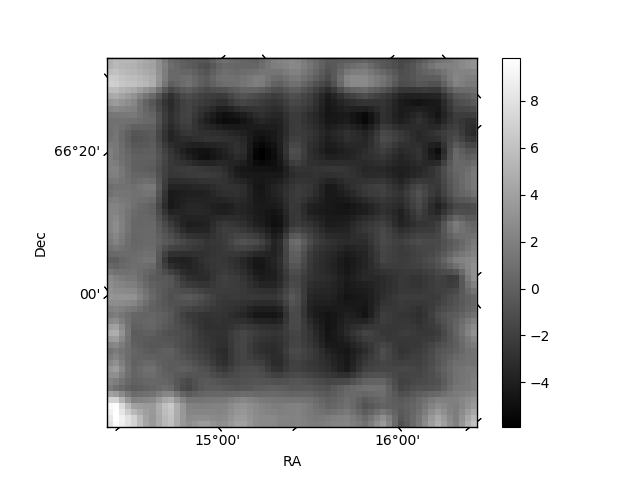
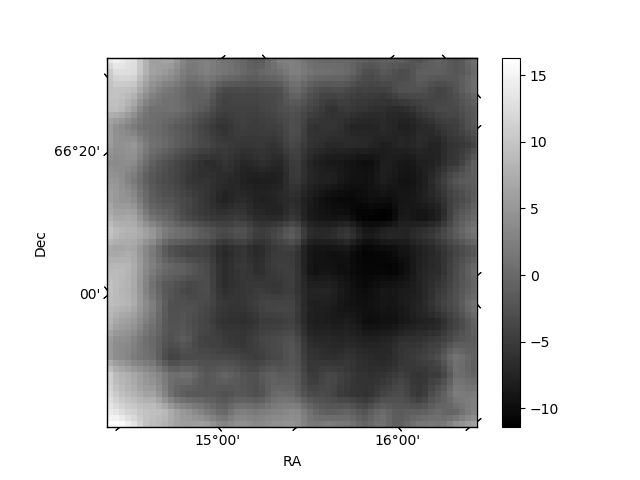
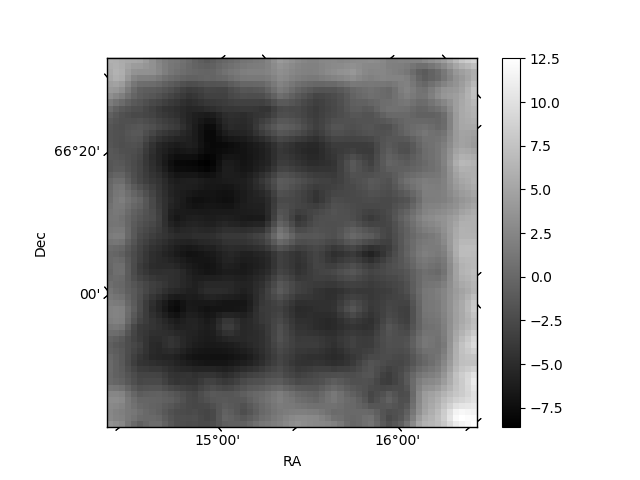
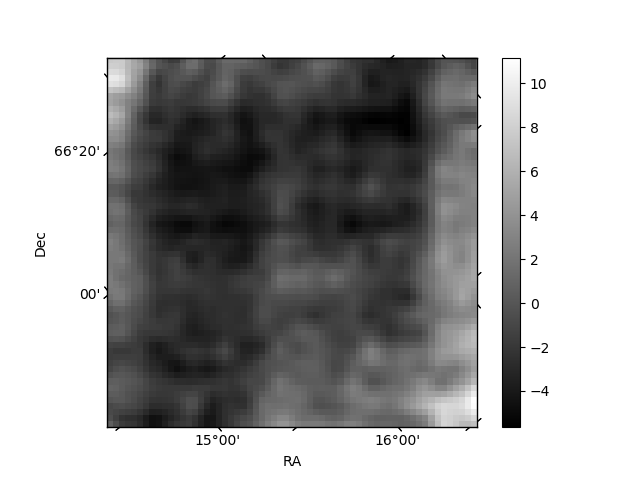
Histogram calculated using DETX and DETY for each event in the final _common_clean file
| Quadrant A | 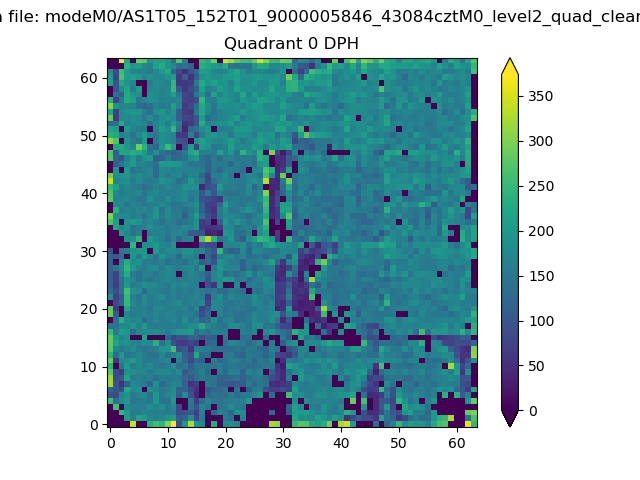 |
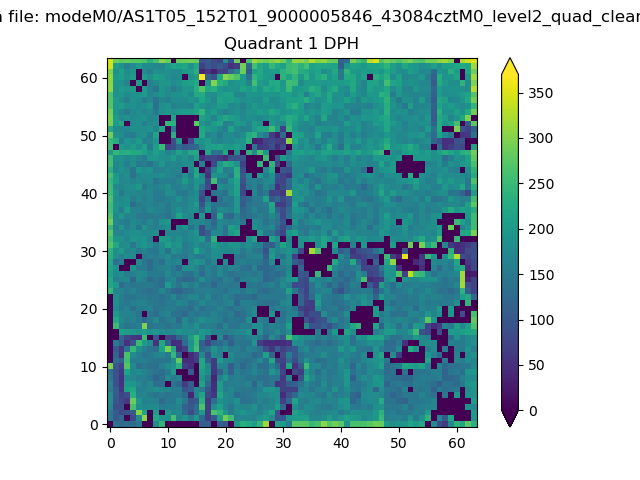 |
Quadrant B |
|---|---|---|---|
| Quadrant D | 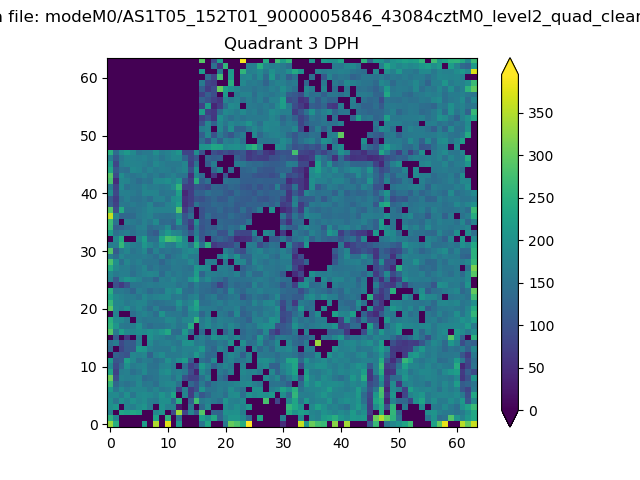 |
 |
Quadrant C |
| Plot type | Count rate plots | Images |
|---|---|---|
| Comparison with Poisson distribution Blue bars denote a histogram of data divided into 1 sec bins. Red curve is a Poisson curve with rate = median count rate of data. |
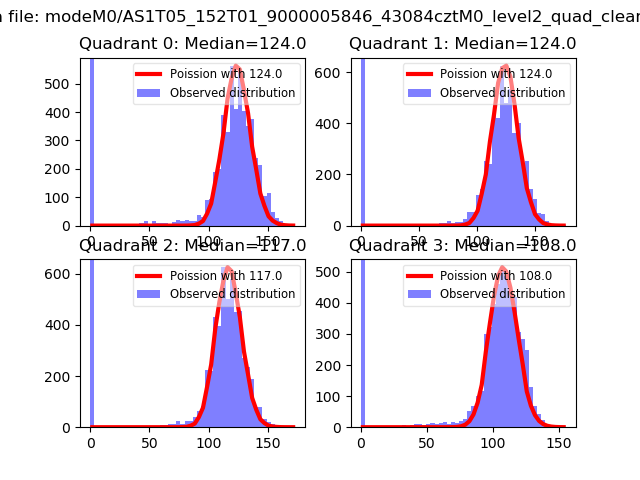 |
 |
| Quadrant-wise count rates Data is divided into 100 sec bins |
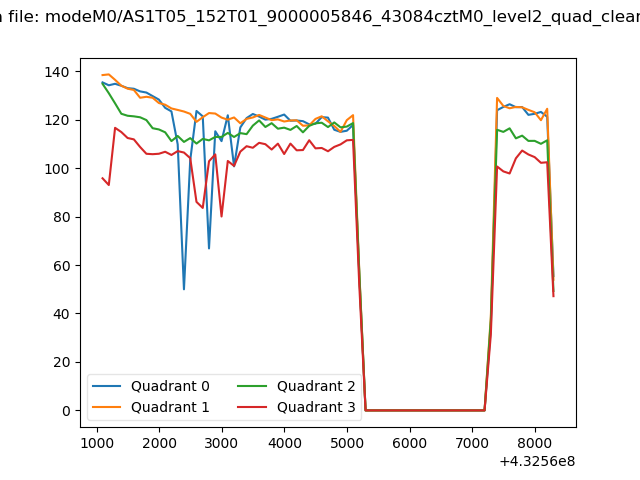 |
|
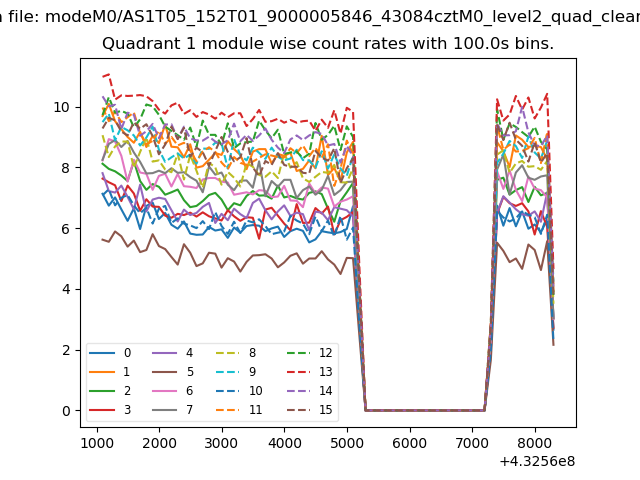
| Module-wise count rates for Quadrant A Data is divided into 100 sec bins |
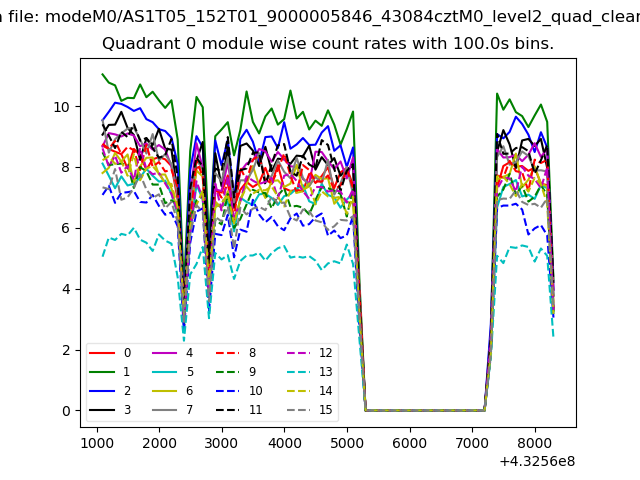 |
 |
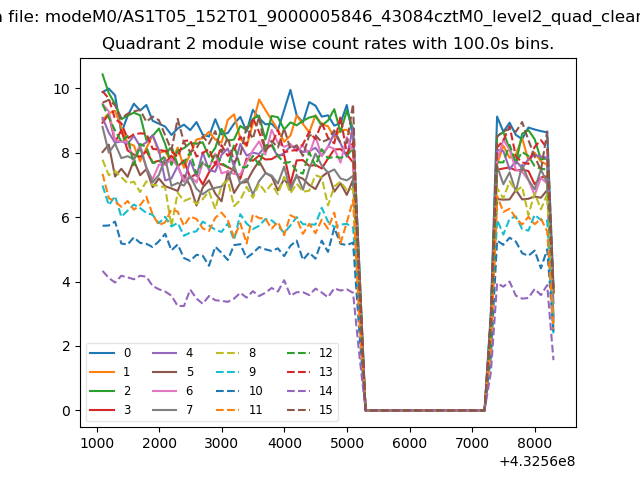
| Module-wise count rates for Quadrant B Data is divided into 100 sec bins |
 |
 |
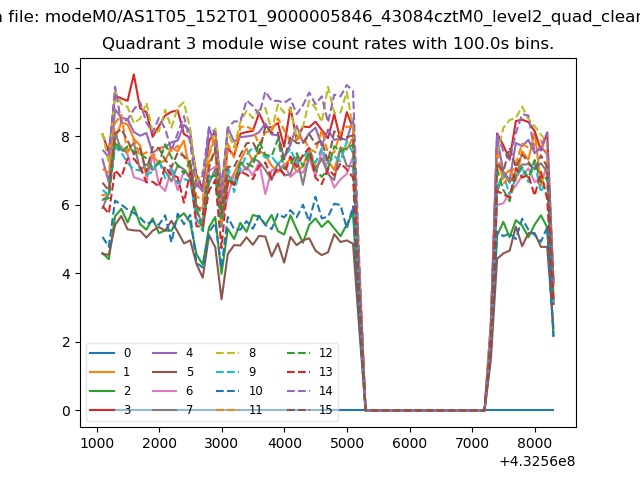
| Module-wise count rates for Quadrant C Data is divided into 100 sec bins |
 |
 |
| Module-wise count rates for Quadrant D Data is divided into 100 sec bins |
 |
 |
| Parameter | Plot |
|---|---|
| CZT HV Monitor | 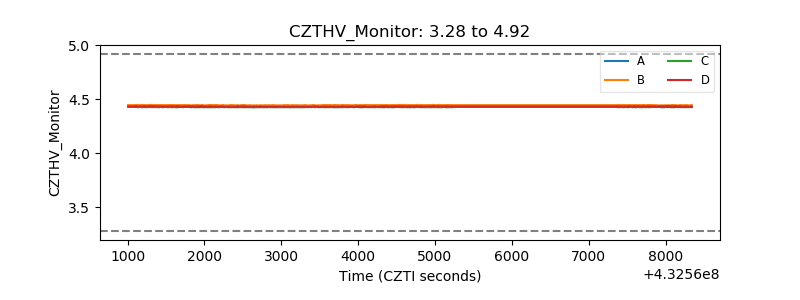 |
| D_VDD | 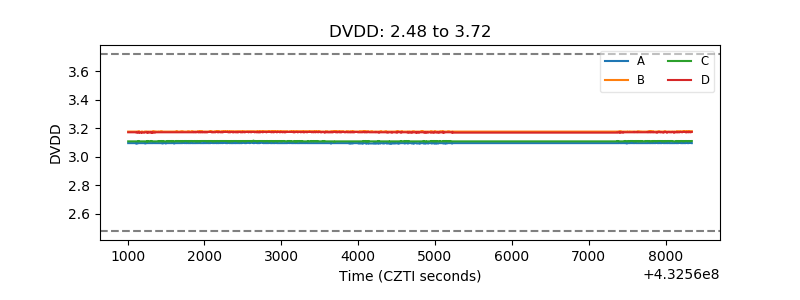 |
| Temperature 1 | 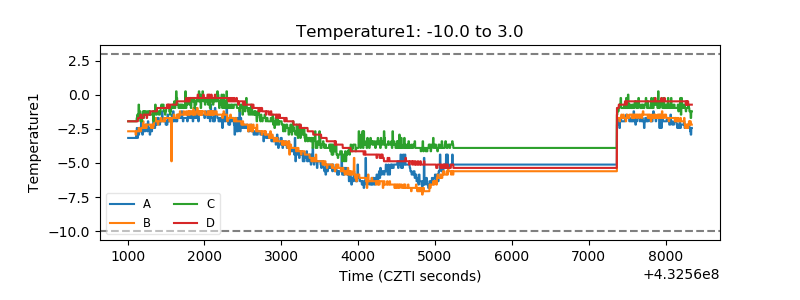 |
| Veto HV Monitor |  |
| Veto LLD | 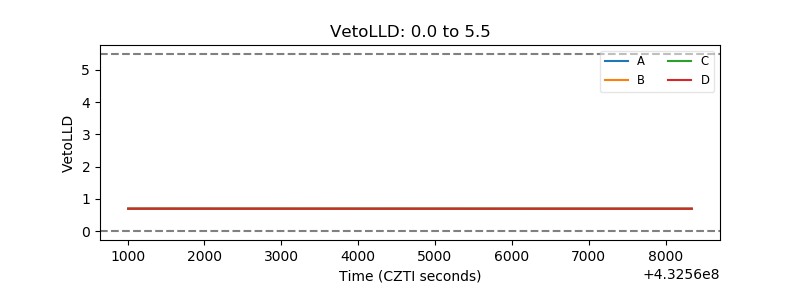 |
| Alpha Counter |  |
| _CPM_Rate |  |
| CZT Counter | 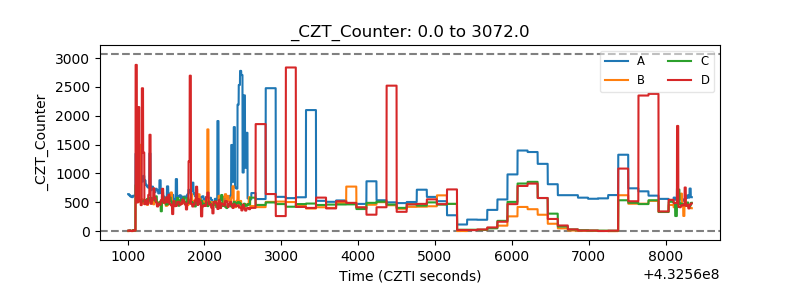 |
| +2.5 Volts monitor | 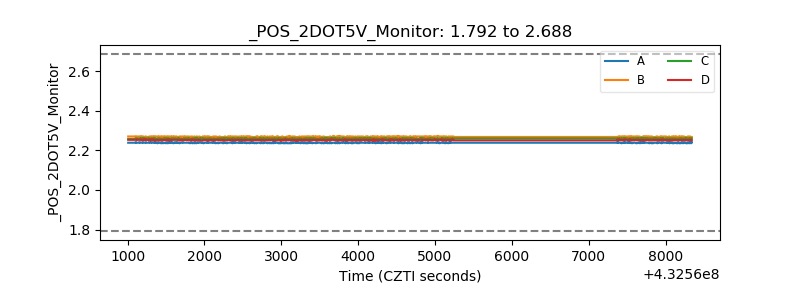 |
| +5 Volts monitor |  |
| _ROLL_ROT |  |
| _Roll_DEC | 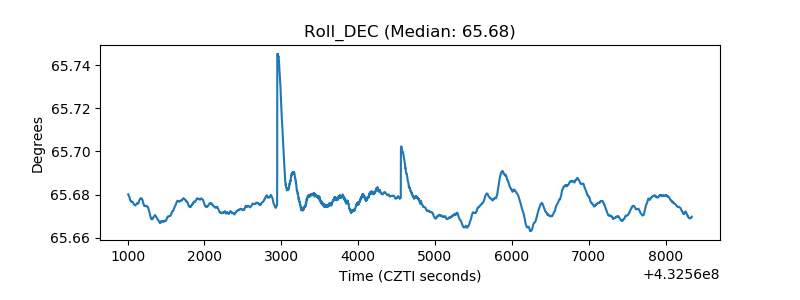 |
| _Roll_RA |  |
| Veto Counter | 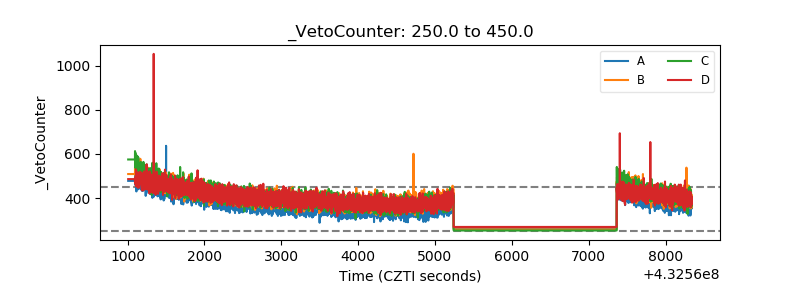 |