| Param | Original file | Final file |
|---|---|---|
| Filename | modeM0/AS1T05_152T01_9000005846_43086cztM0_level2.fits | modeM0/AS1T05_152T01_9000005846_43086cztM0_level2_quad_clean.evt |
| Size (bytes) | 260,398,080 | 58,026,240 |
| Size | 248.3 MB | 55.3 MB |
| Events in quadrant A | 2,182,791 | 404,975 |
| Events in quadrant B | 2,458,835 | 390,029 |
| Events in quadrant C | 1,732,498 | 386,101 |
| Events in quadrant D | 2,986,410 | 323,483 |
| Mode M0 | |||
|---|---|---|---|
| Quadrant | BADHDUFLAG | Total packets | Discarded packets |
| A | 0 | 8711 | 73 |
| B | 0 | 9836 | 95 |
| C | 0 | 7360 | 63 |
| D | 0 | 11395 | 57 |
| Mode SS | |||
|---|---|---|---|
| Quadrant | BADHDUFLAG | Total packets | Discarded packets |
| A | 0 | 74 | 0 |
| B | 0 | 74 | 0 |
| C | 0 | 75 | 1 |
| D | 0 | 74 | 0 |
| Mode M9 | |||
|---|---|---|---|
| Quadrant | BADHDUFLAG | Total packets | Discarded packets |
| A | 0 | 17 | 0 |
| B | 0 | 17 | 1 |
| C | 0 | 17 | 1 |
| D | 0 | 16 | 0 |
| Quadrant | Total seconds | Saturated seconds | Saturation percentage |
|---|---|---|---|
| A | 3556 | 52 | 1.462317% |
| B | 3563 | 224 | 6.286837% |
| C | 3561 | 7 | 0.196574% |
| D | 3563 | 442 | 12.405276% |
Noise dominated data is calculated using 1-second bins in cleaned event files. If a bin has >2000 counts, and if more than 50% of those come from <1% of pixels, then it is considered to be noise-dominated and hence unusable.
| Quadrant | # 1 sec bins | Bins with >0 counts | Bins with >2000 counts | High rate bins dominated by noise | Noise dominated (total time) | Noise dominated (detector-on time) | Marked lightcurve |
|---|---|---|---|---|---|---|---|
| A | 7092 | 3563 | 34 | 34 | 0.48% | 0.95% | 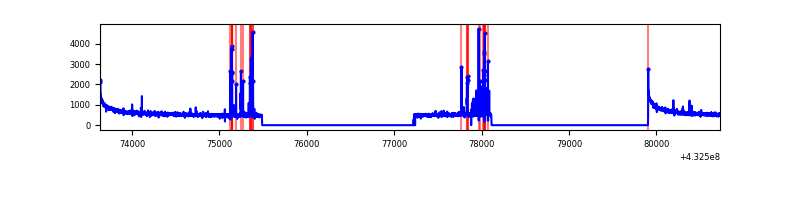 |
| B | 7093 | 3569 | 155 | 155 | 2.19% | 4.34% | 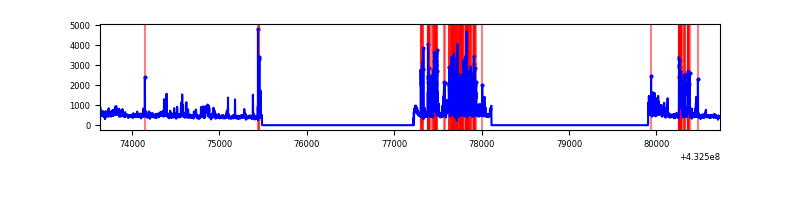 |
| C | 7093 | 3566 | 3 | 3 | 0.04% | 0.08% | 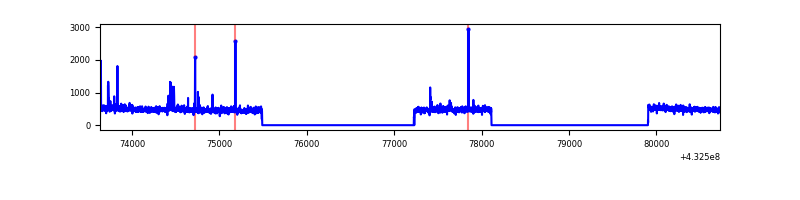 |
| D | 7093 | 3567 | 337 | 337 | 4.75% | 9.45% | 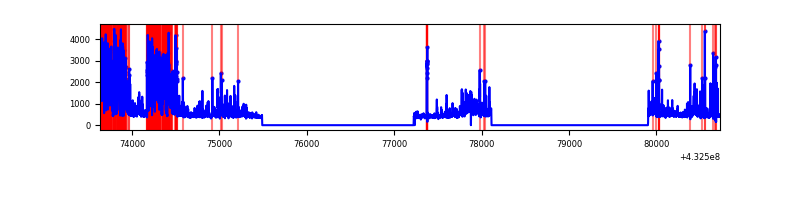 |
Top three noisy pixels from each quadrant. If the there are fewer than three noisy pixels in the level2.evt file, extra rows are filled as -1
| Pixel properties | Quadrant properties | ||||||
|---|---|---|---|---|---|---|---|
| Quadrant | DetID | PixID | Counts | Sigma | Mean | Median | Sigma |
| A | 10 | 83 | 488377 | 5967.42 | 394 | 386 | 81.8 |
| A | 15 | 237 | 143992 | 1756.09 | 394 | 386 | 81.8 |
| A | 12 | 189 | 10741 | 126.63 | 394 | 386 | 81.8 |
| B | 5 | 255 | 543950 | 7176.55 | 385 | 374 | 75.7 |
| B | 0 | 229 | 205652 | 2710.18 | 385 | 374 | 75.7 |
| B | 0 | 189 | 86731 | 1140.13 | 385 | 374 | 75.7 |
| C | 15 | 214 | 164231 | 1802.02 | 385 | 387 | 90.9 |
| C | 14 | 254 | 53039 | 579.09 | 385 | 387 | 90.9 |
| C | 1 | 128 | 4633 | 46.7 | 385 | 387 | 90.9 |
| D | 12 | 233 | 1084364 | 12009.98 | 367 | 356 | 90.3 |
| D | 1 | 52 | 264769 | 2929.49 | 367 | 356 | 90.3 |
| D | 2 | 16 | 85879 | 947.53 | 367 | 356 | 90.3 |
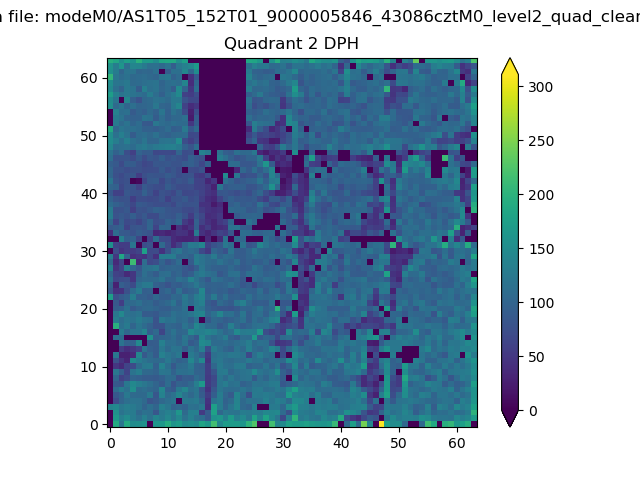
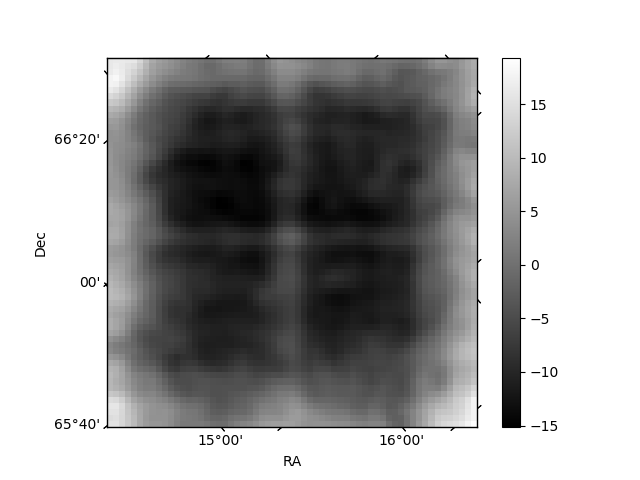
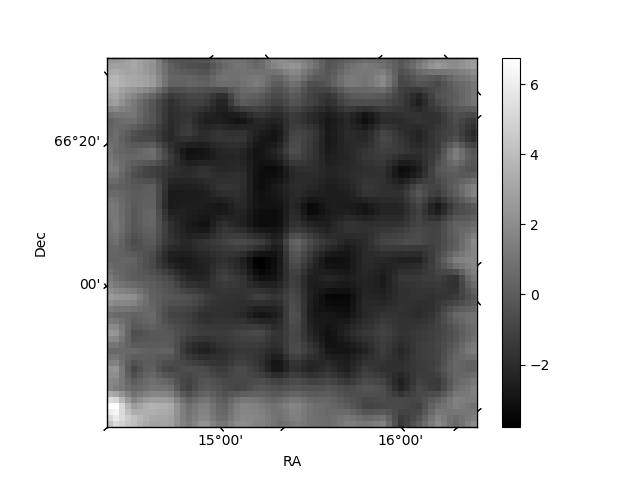
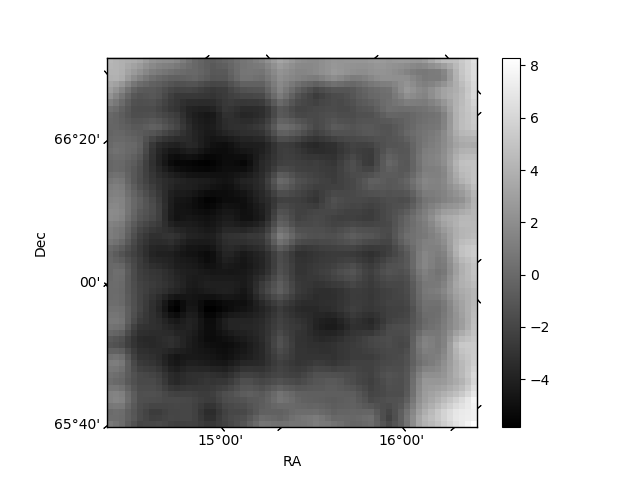
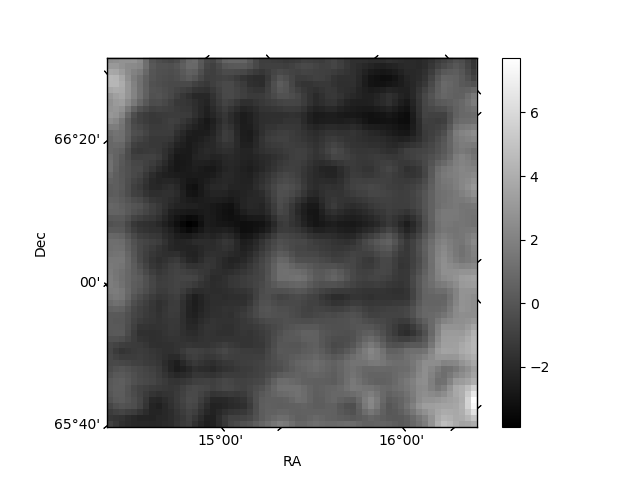
Histogram calculated using DETX and DETY for each event in the final _common_clean file
| Quadrant A | 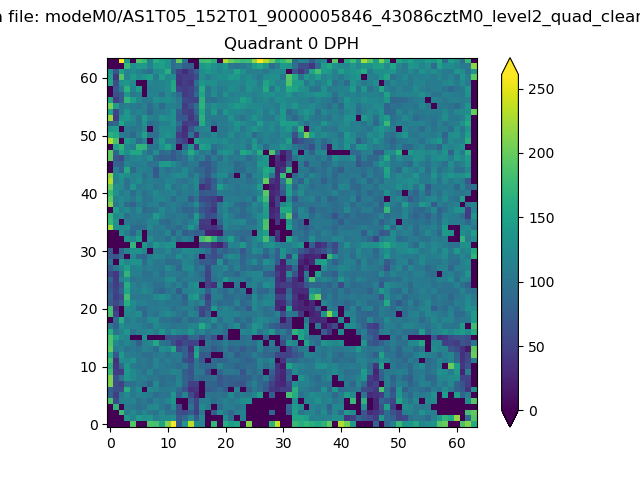 |
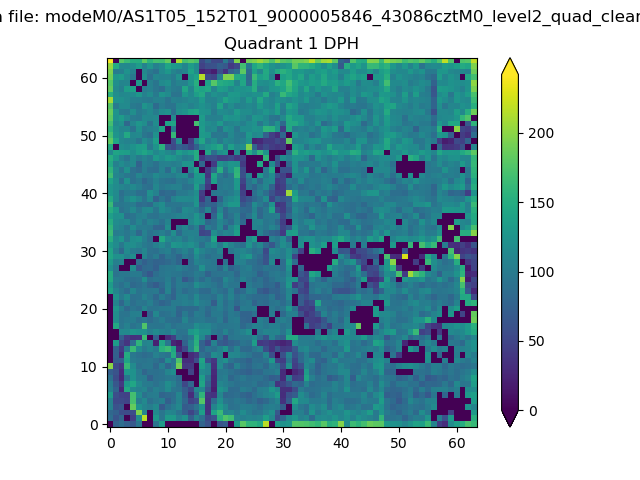 |
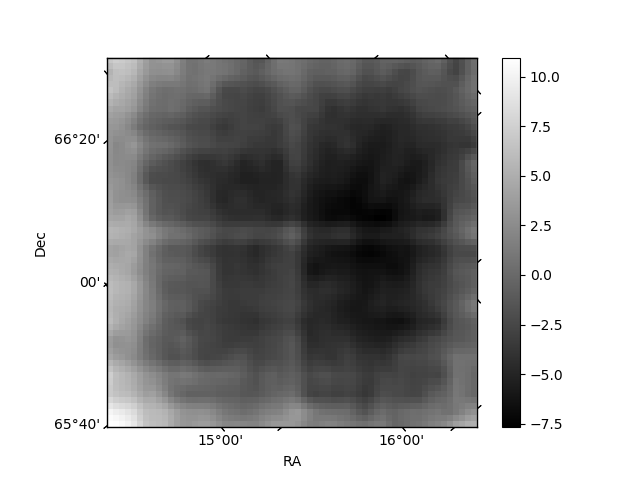
Quadrant B |
|---|---|---|---|
| Quadrant D | 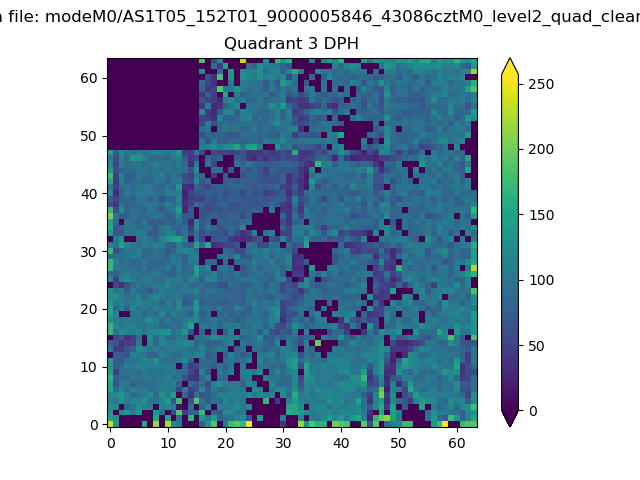 |
 |
Quadrant C |
| Plot type | Count rate plots | Images |
|---|---|---|
| Comparison with Poisson distribution Blue bars denote a histogram of data divided into 1 sec bins. Red curve is a Poisson curve with rate = median count rate of data. |
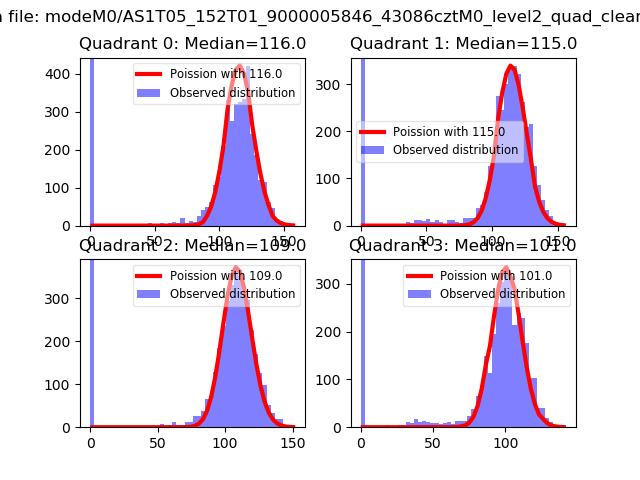 |
 |
| Quadrant-wise count rates Data is divided into 100 sec bins |
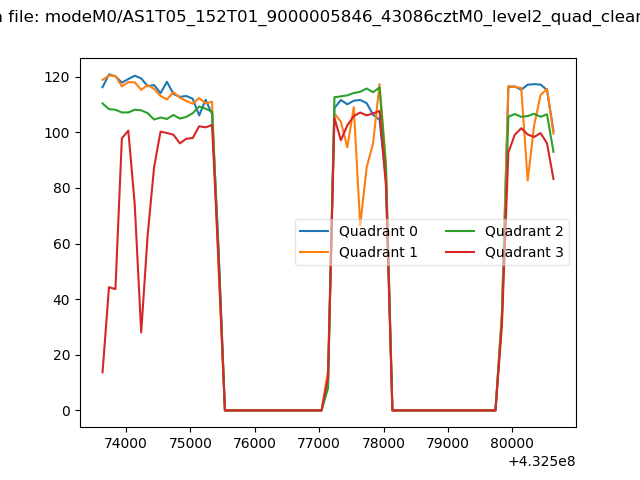 |
|
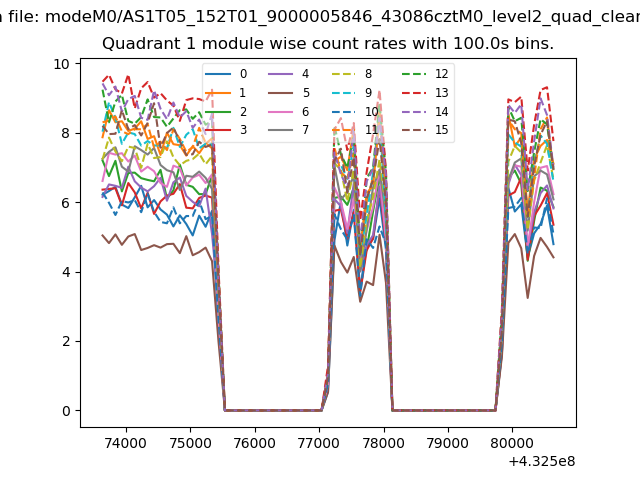
| Module-wise count rates for Quadrant A Data is divided into 100 sec bins |
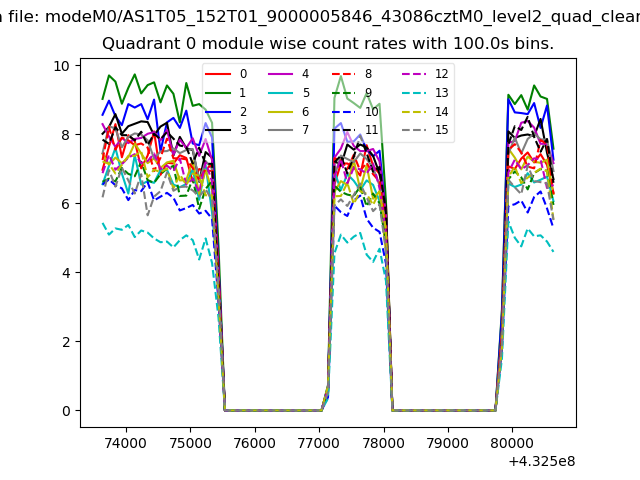 |
 |
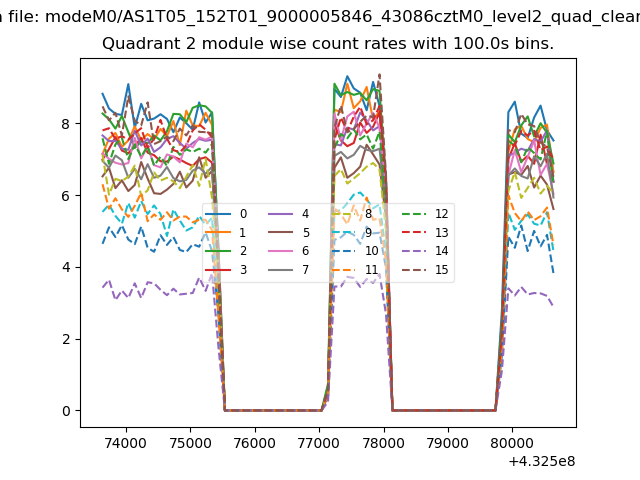
| Module-wise count rates for Quadrant B Data is divided into 100 sec bins |
 |
 |
| Module-wise count rates for Quadrant C Data is divided into 100 sec bins |
 |
 |
| Module-wise count rates for Quadrant D Data is divided into 100 sec bins |
 |
 |
| Parameter | Plot |
|---|---|
| CZT HV Monitor | 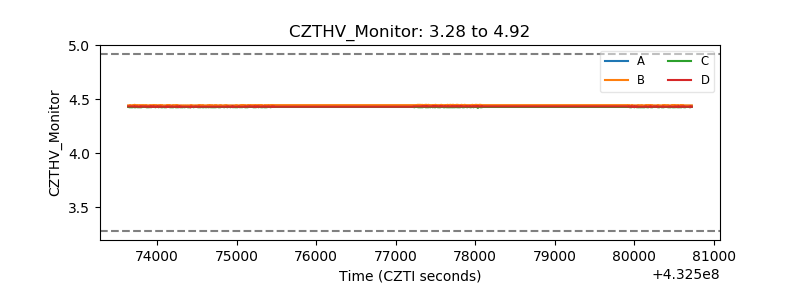 |
| D_VDD | 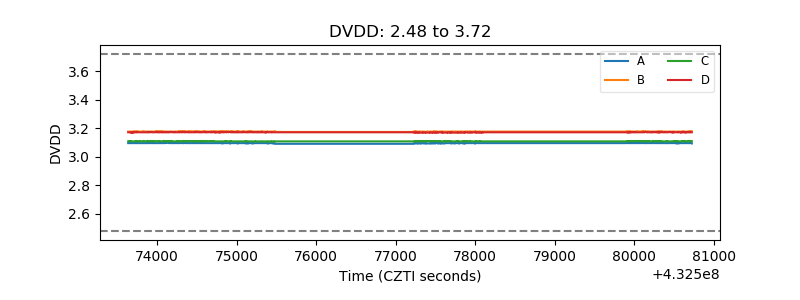 |
| Temperature 1 | 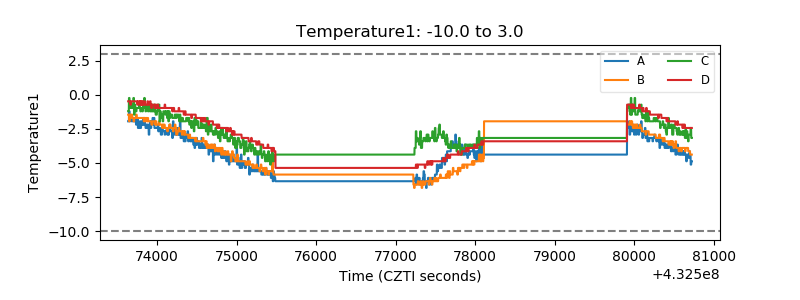 |
| Veto HV Monitor | 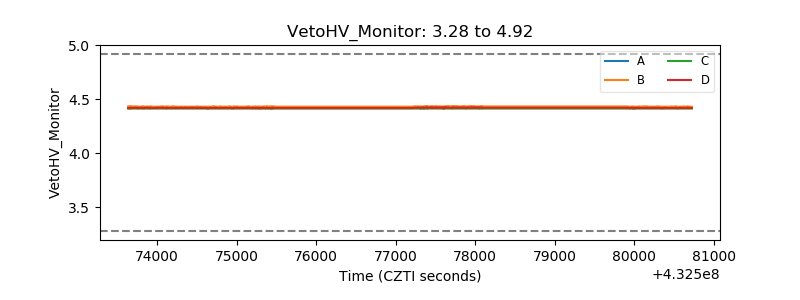 |
| Veto LLD | 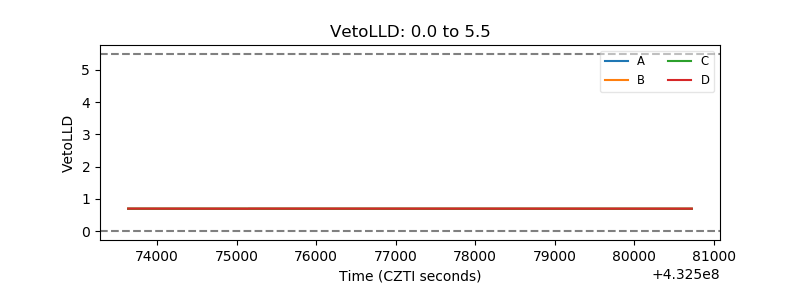 |
| Alpha Counter | 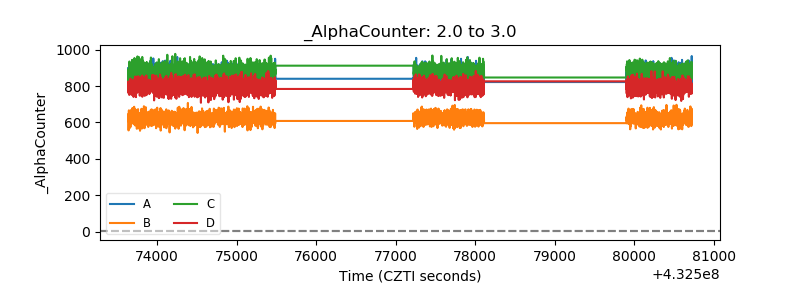 |
| _CPM_Rate | 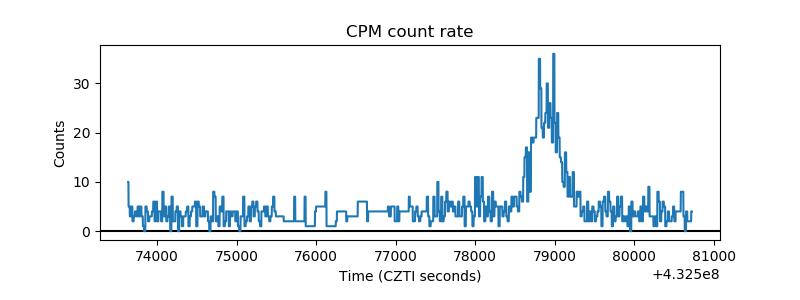 |
| CZT Counter | 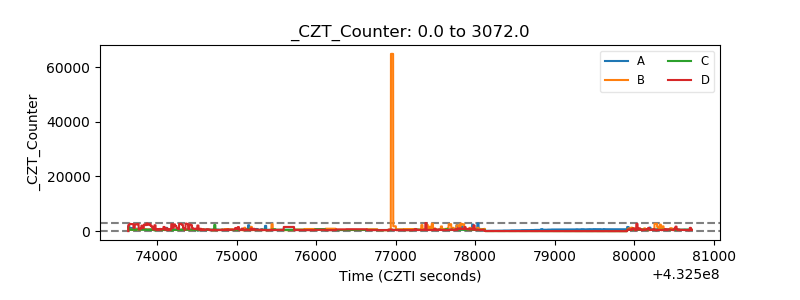 |
| +2.5 Volts monitor | 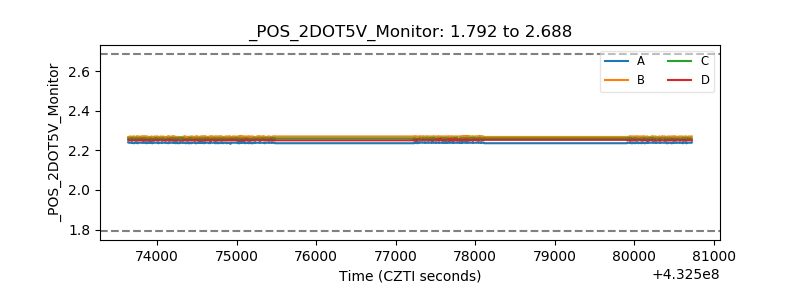 |
| +5 Volts monitor | 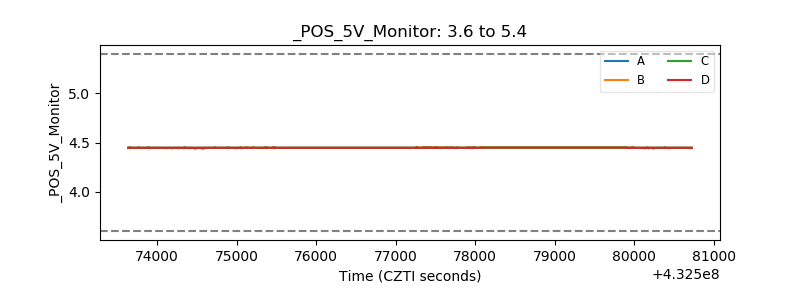 |
| _ROLL_ROT | 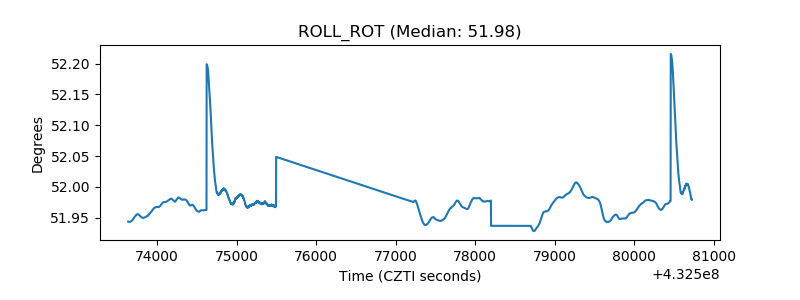 |
| _Roll_DEC | 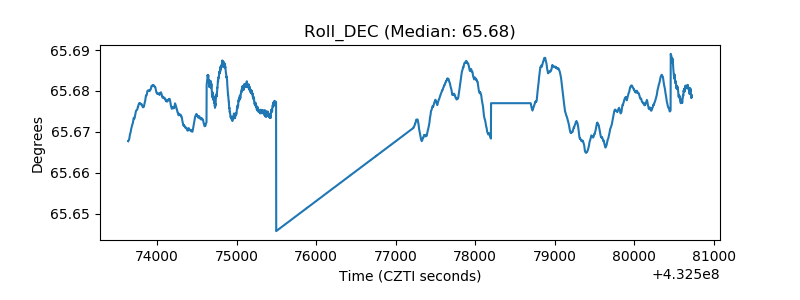 |
| _Roll_RA | 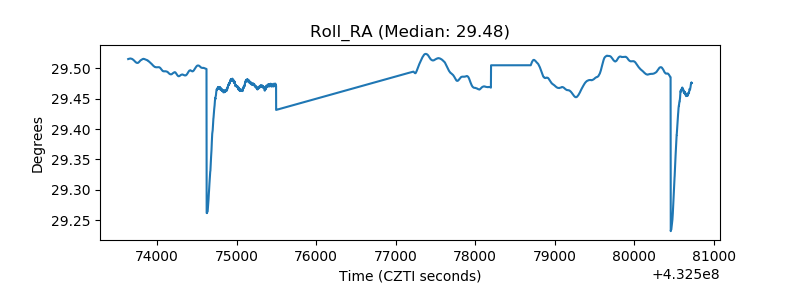 |
| Veto Counter | 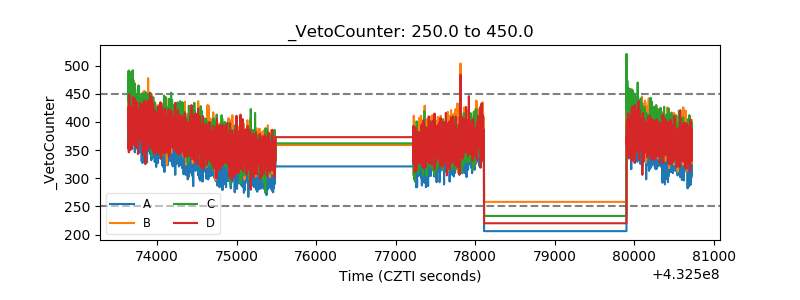 |