| Param | Original file | Final file |
|---|---|---|
| Filename | modeM0/AS1T05_152T01_9000005846_43087cztM0_level2.fits | modeM0/AS1T05_152T01_9000005846_43087cztM0_level2_quad_clean.evt |
| Size (bytes) | 342,290,880 | 93,585,600 |
| Size | 326.4 MB | 89.3 MB |
| Events in quadrant A | 3,360,890 | 625,589 |
| Events in quadrant B | 2,931,706 | 631,336 |
| Events in quadrant C | 2,907,225 | 610,372 |
| Events in quadrant D | 3,028,069 | 568,524 |
| Mode M0 | |||
|---|---|---|---|
| Quadrant | BADHDUFLAG | Total packets | Discarded packets |
| A | 0 | 13656 | 2 |
| B | 0 | 12675 | 2 |
| C | 0 | 12265 | 2 |
| D | 0 | 13228 | 3 |
| Mode SS | |||
|---|---|---|---|
| Quadrant | BADHDUFLAG | Total packets | Discarded packets |
| A | 0 | 118 | 0 |
| B | 0 | 118 | 0 |
| C | 0 | 118 | 0 |
| D | 0 | 118 | 0 |
| Mode M9 | |||
|---|---|---|---|
| Quadrant | BADHDUFLAG | Total packets | Discarded packets |
| A | 0 | 25 | 0 |
| B | 0 | 26 | 0 |
| C | 0 | 26 | 0 |
| D | 0 | 26 | 0 |
| Quadrant | Total seconds | Saturated seconds | Saturation percentage |
|---|---|---|---|
| A | 5684 | 76 | 1.337087% |
| B | 5684 | 58 | 1.020408% |
| C | 5684 | 40 | 0.703730% |
| D | 5683 | 47 | 0.827028% |
Noise dominated data is calculated using 1-second bins in cleaned event files. If a bin has >2000 counts, and if more than 50% of those come from <1% of pixels, then it is considered to be noise-dominated and hence unusable.
| Quadrant | # 1 sec bins | Bins with >0 counts | Bins with >2000 counts | High rate bins dominated by noise | Noise dominated (total time) | Noise dominated (detector-on time) | Marked lightcurve |
|---|---|---|---|---|---|---|---|
| A | 7117 | 5685 | 42 | 42 | 0.59% | 0.74% | 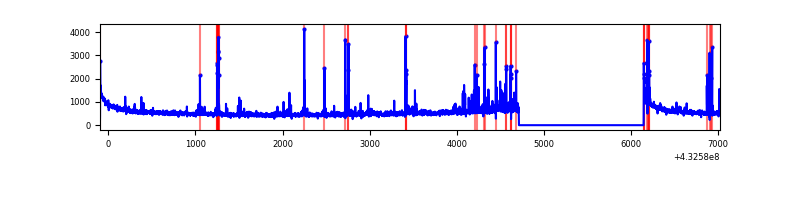 |
| B | 7117 | 5685 | 37 | 37 | 0.52% | 0.65% | 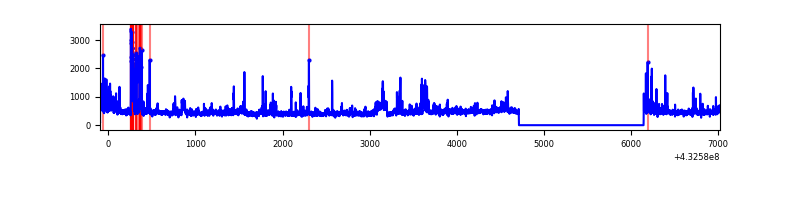 |
| C | 7117 | 5685 | 31 | 31 | 0.44% | 0.55% | 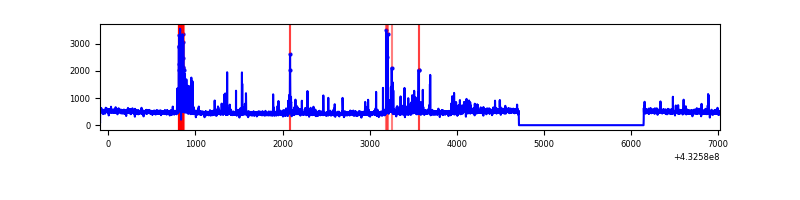 |
| D | 7116 | 5684 | 39 | 39 | 0.55% | 0.69% | 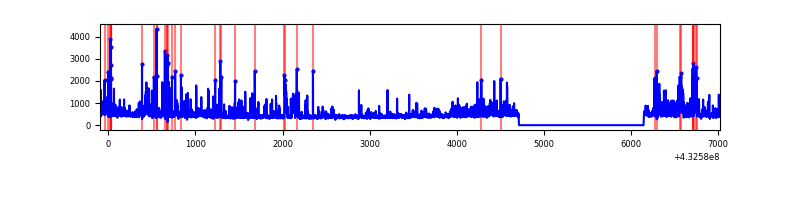 |
Top three noisy pixels from each quadrant. If the there are fewer than three noisy pixels in the level2.evt file, extra rows are filled as -1
| Pixel properties | Quadrant properties | ||||||
|---|---|---|---|---|---|---|---|
| Quadrant | DetID | PixID | Counts | Sigma | Mean | Median | Sigma |
| A | 10 | 83 | 624255 | 4997.45 | 604 | 590 | 124.8 |
| A | 15 | 237 | 243227 | 1944.26 | 604 | 590 | 124.8 |
| A | 12 | 189 | 112443 | 896.28 | 604 | 590 | 124.8 |
| B | 5 | 255 | 186606 | 1606.95 | 599 | 583 | 115.8 |
| B | 0 | 229 | 170320 | 1466.26 | 599 | 583 | 115.8 |
| B | 0 | 189 | 114745 | 986.18 | 599 | 583 | 115.8 |
| C | 14 | 254 | 310039 | 2222.57 | 594 | 598 | 139.2 |
| C | 15 | 214 | 253013 | 1812.98 | 594 | 598 | 139.2 |
| C | 0 | 207 | 15066 | 103.92 | 594 | 598 | 139.2 |
| D | 1 | 52 | 327285 | 2278.82 | 593 | 576 | 143.4 |
| D | 2 | 16 | 172993 | 1202.62 | 593 | 576 | 143.4 |
| D | 12 | 233 | 67980 | 470.15 | 593 | 576 | 143.4 |
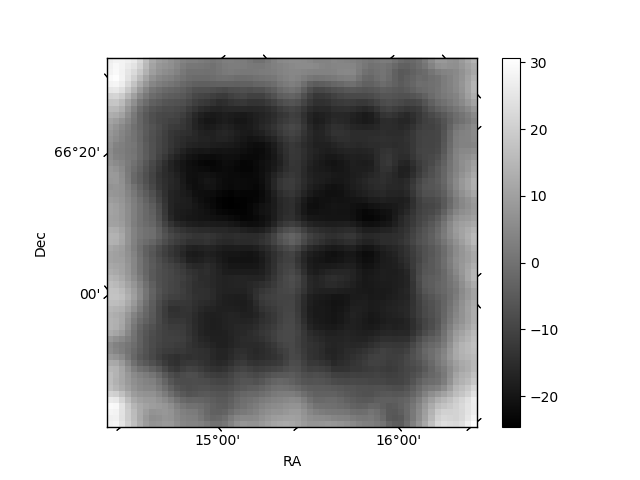
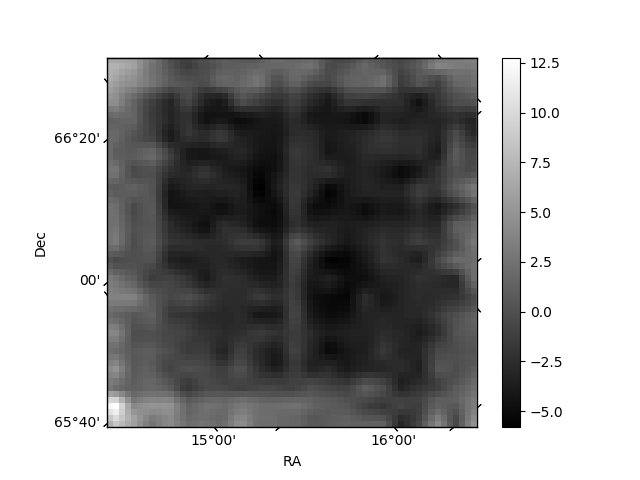
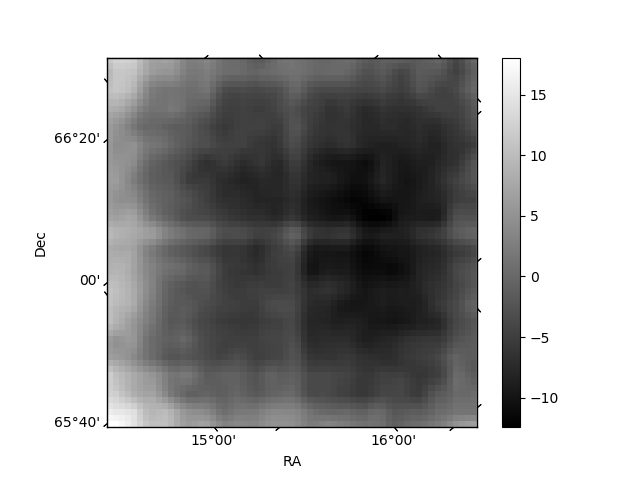
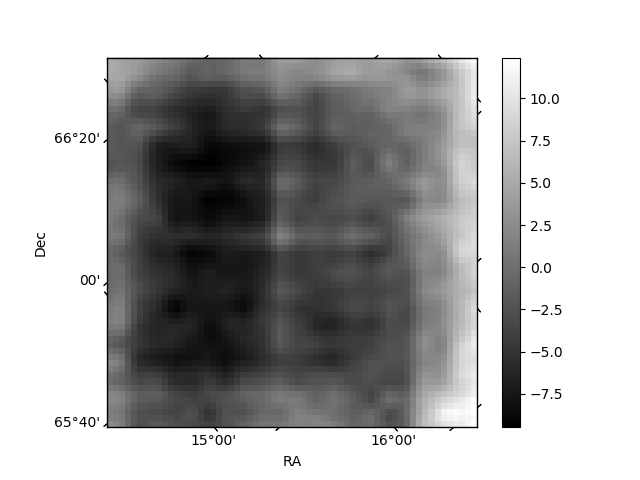
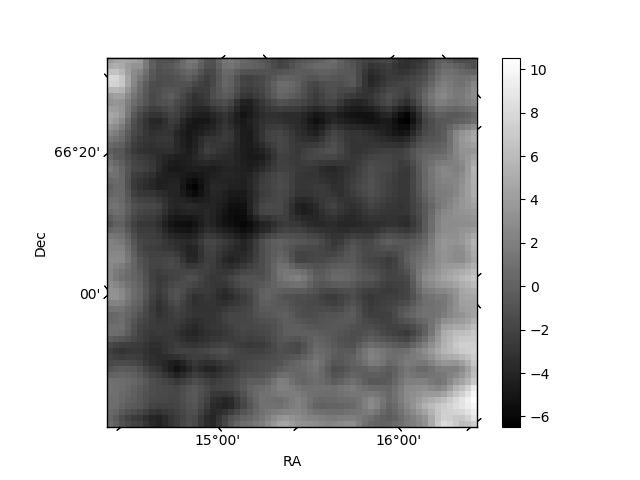
Histogram calculated using DETX and DETY for each event in the final _common_clean file
| Quadrant A | 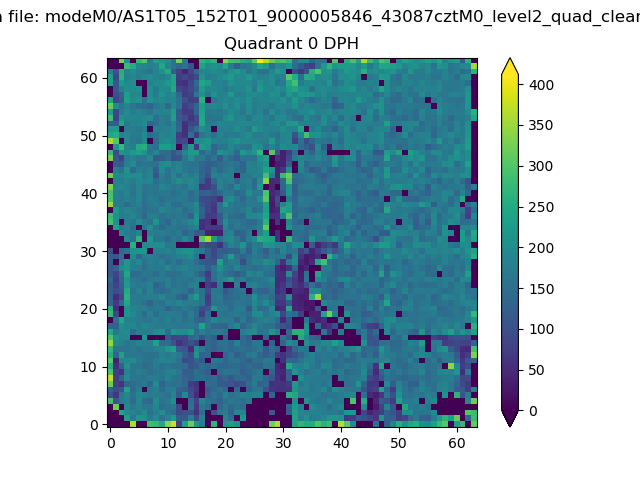 |
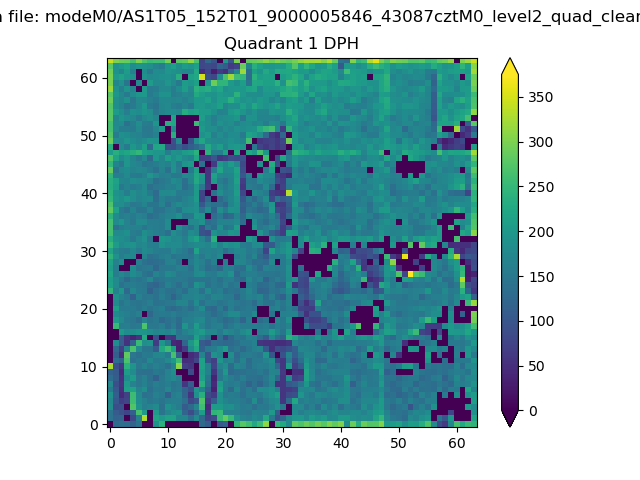 |
Quadrant B |
|---|---|---|---|
| Quadrant D | 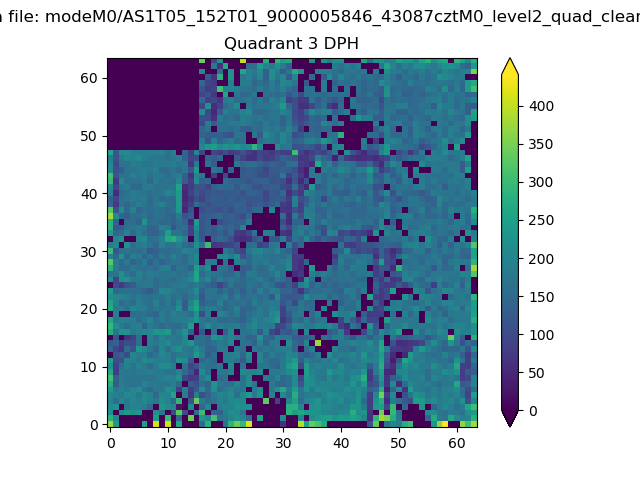 |
 |
Quadrant C |
| Plot type | Count rate plots | Images |
|---|---|---|
| Comparison with Poisson distribution Blue bars denote a histogram of data divided into 1 sec bins. Red curve is a Poisson curve with rate = median count rate of data. |
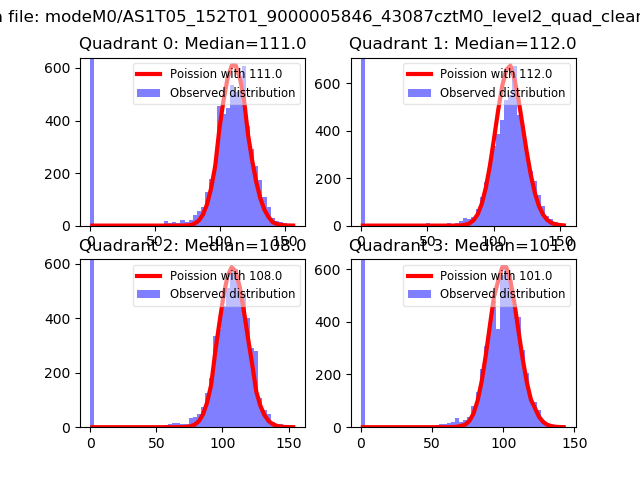 |
 |
| Quadrant-wise count rates Data is divided into 100 sec bins |
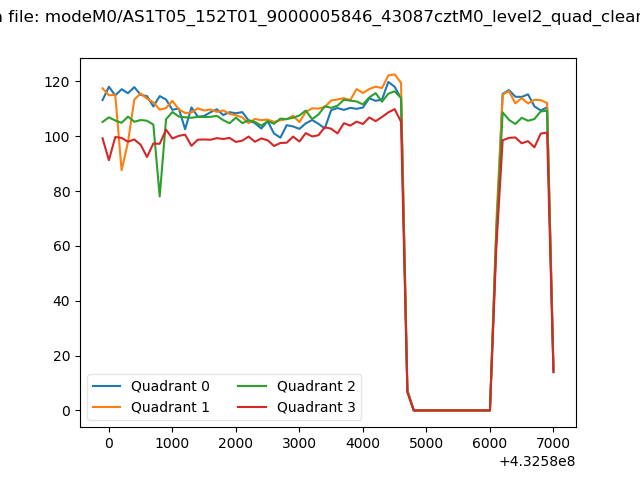 |
|
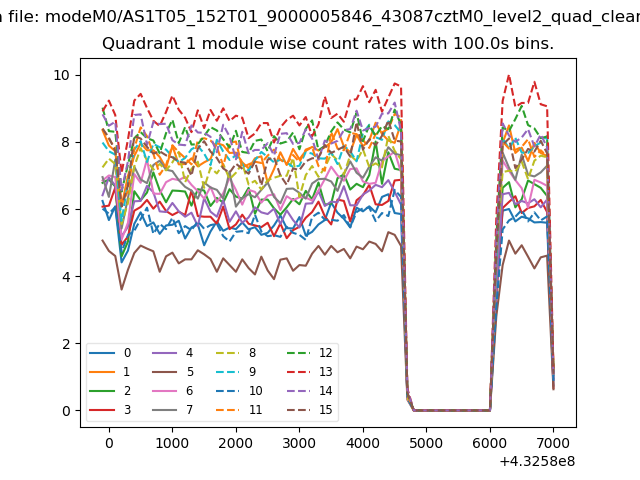
| Module-wise count rates for Quadrant A Data is divided into 100 sec bins |
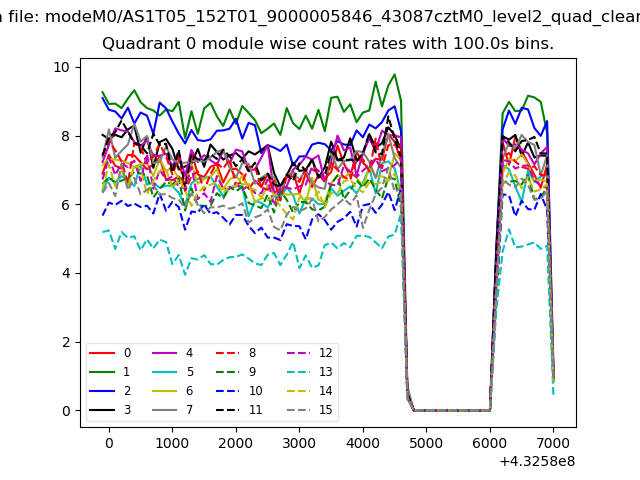 |
 |
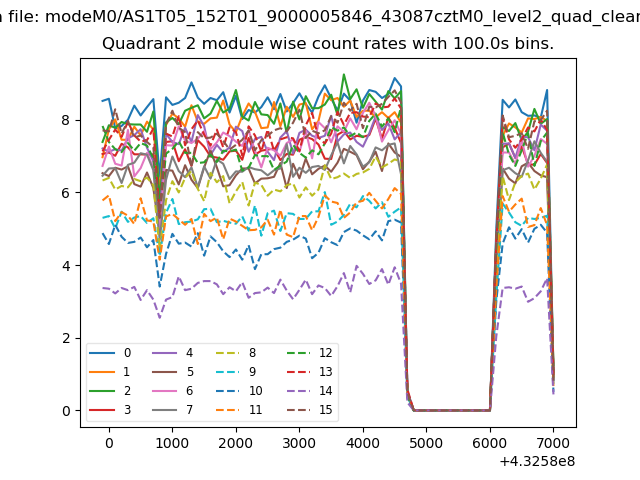
| Module-wise count rates for Quadrant B Data is divided into 100 sec bins |
 |
 |
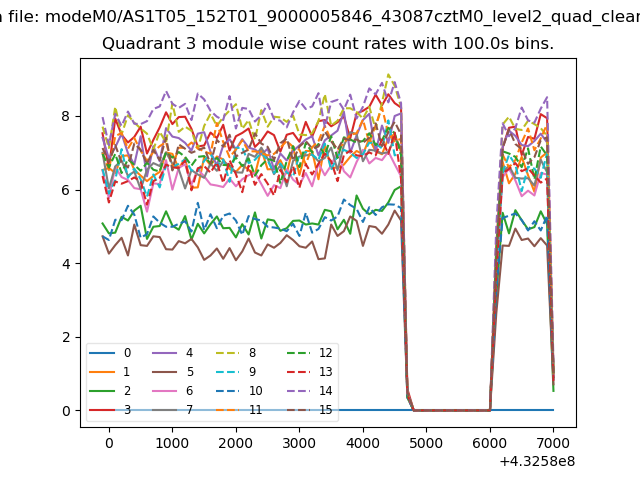
| Module-wise count rates for Quadrant C Data is divided into 100 sec bins |
 |
 |
| Module-wise count rates for Quadrant D Data is divided into 100 sec bins |
 |
 |
| Parameter | Plot |
|---|---|
| CZT HV Monitor | 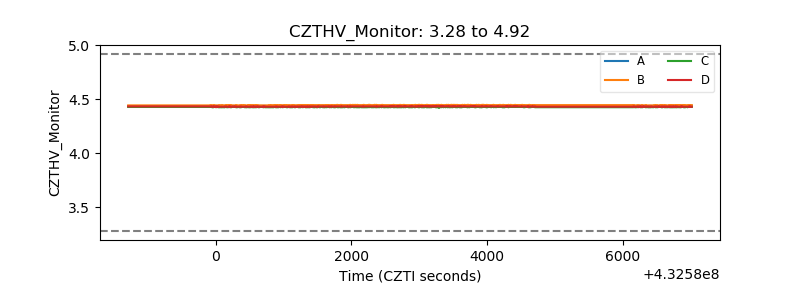 |
| D_VDD | 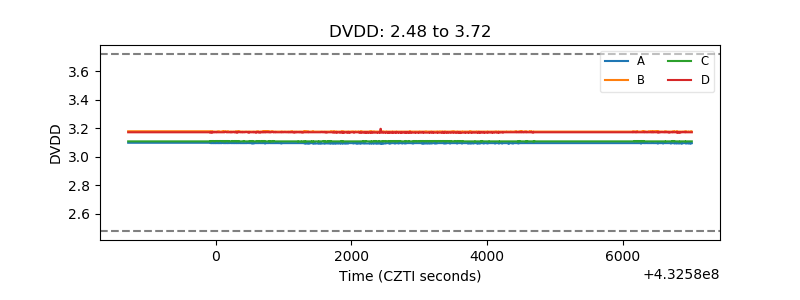 |
| Temperature 1 | 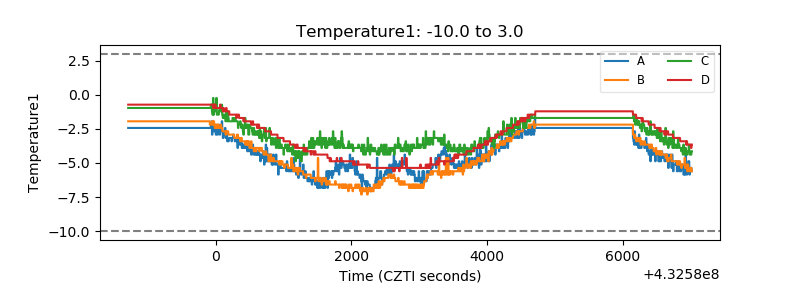 |
| Veto HV Monitor | 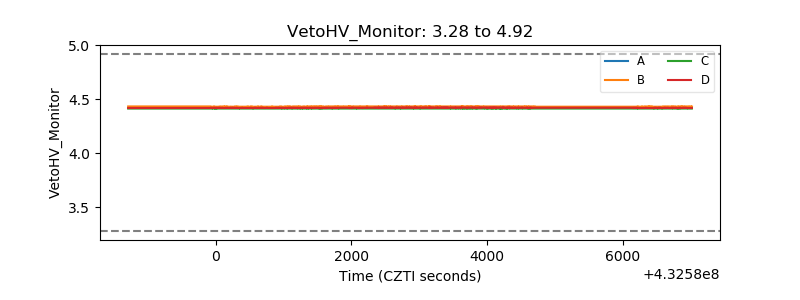 |
| Veto LLD | 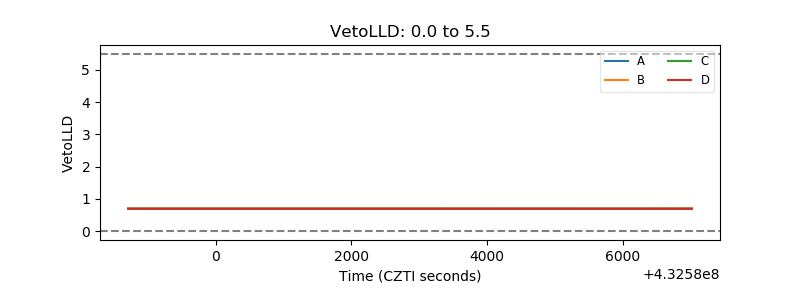 |
| Alpha Counter | 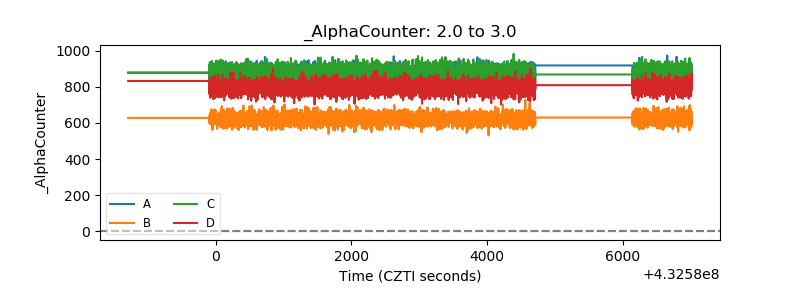 |
| _CPM_Rate | 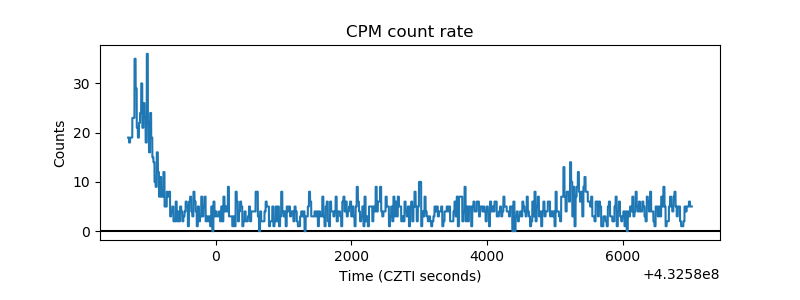 |
| CZT Counter | 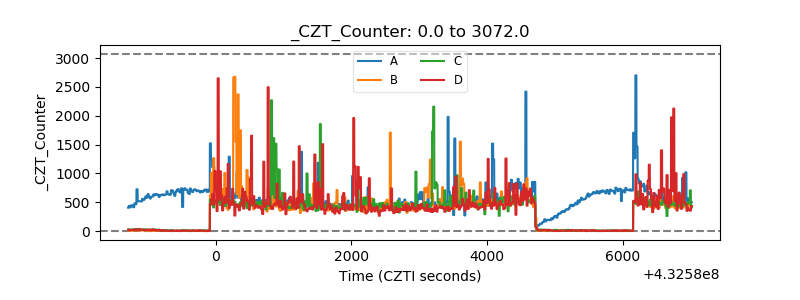 |
| +2.5 Volts monitor |  |
| +5 Volts monitor |  |
| _ROLL_ROT | 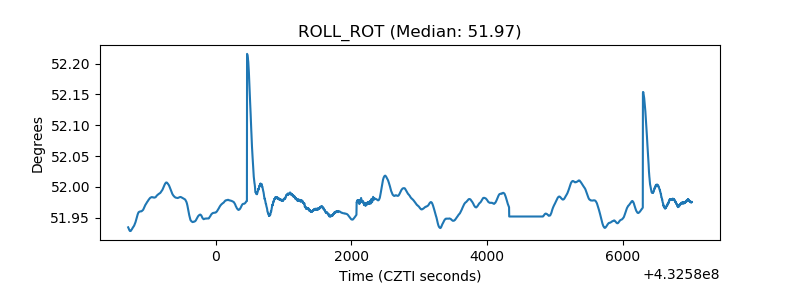 |
| _Roll_DEC |  |
| _Roll_RA | 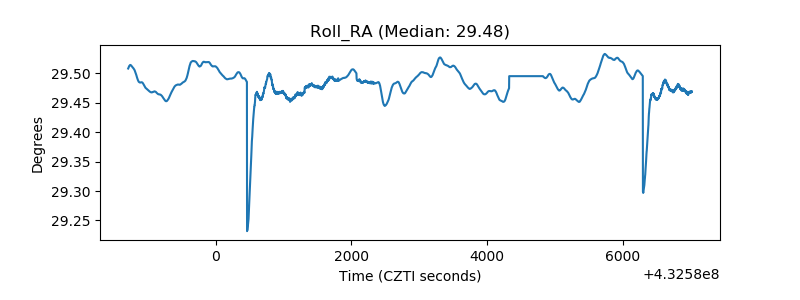 |
| Veto Counter | 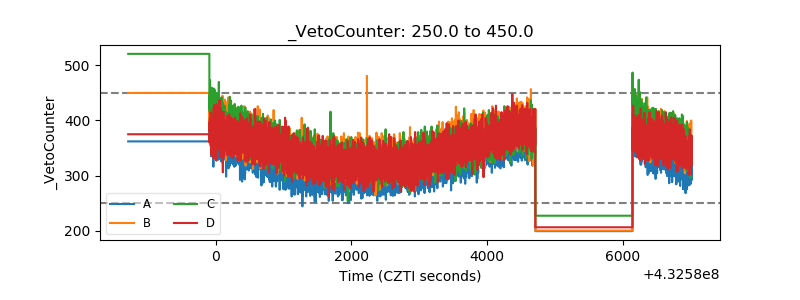 |