| Param | Original file | Final file |
|---|---|---|
| Filename | modeM0/AS1T05_152T01_9000005846_43088cztM0_level2.fits | modeM0/AS1T05_152T01_9000005846_43088cztM0_level2_quad_clean.evt |
| Size (bytes) | 344,543,040 | 94,680,000 |
| Size | 328.6 MB | 90.3 MB |
| Events in quadrant A | 3,402,277 | 632,465 |
| Events in quadrant B | 2,883,486 | 639,079 |
| Events in quadrant C | 2,709,360 | 625,888 |
| Events in quadrant D | 3,307,180 | 564,643 |
| Mode M0 | |||
|---|---|---|---|
| Quadrant | BADHDUFLAG | Total packets | Discarded packets |
| A | 0 | 13797 | 2 |
| B | 0 | 12630 | 2 |
| C | 0 | 11800 | 2 |
| D | 0 | 14171 | 2 |
| Mode SS | |||
|---|---|---|---|
| Quadrant | BADHDUFLAG | Total packets | Discarded packets |
| A | 0 | 116 | 0 |
| B | 0 | 116 | 0 |
| C | 0 | 116 | 0 |
| D | 0 | 116 | 0 |
| Mode M9 | |||
|---|---|---|---|
| Quadrant | BADHDUFLAG | Total packets | Discarded packets |
| A | 0 | 26 | 0 |
| B | 0 | 27 | 0 |
| C | 0 | 27 | 0 |
| D | 0 | 27 | 0 |
| Quadrant | Total seconds | Saturated seconds | Saturation percentage |
|---|---|---|---|
| A | 5798 | 49 | 0.845119% |
| B | 5798 | 68 | 1.172818% |
| C | 5798 | 6 | 0.103484% |
| D | 5798 | 185 | 3.190755% |
Noise dominated data is calculated using 1-second bins in cleaned event files. If a bin has >2000 counts, and if more than 50% of those come from <1% of pixels, then it is considered to be noise-dominated and hence unusable.
| Quadrant | # 1 sec bins | Bins with >0 counts | Bins with >2000 counts | High rate bins dominated by noise | Noise dominated (total time) | Noise dominated (detector-on time) | Marked lightcurve |
|---|---|---|---|---|---|---|---|
| A | 7111 | 5799 | 37 | 37 | 0.52% | 0.64% | 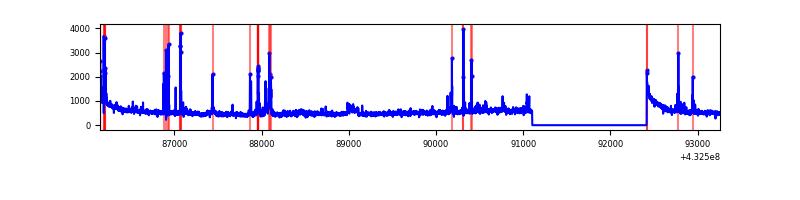 |
| B | 7111 | 5799 | 32 | 32 | 0.45% | 0.55% | 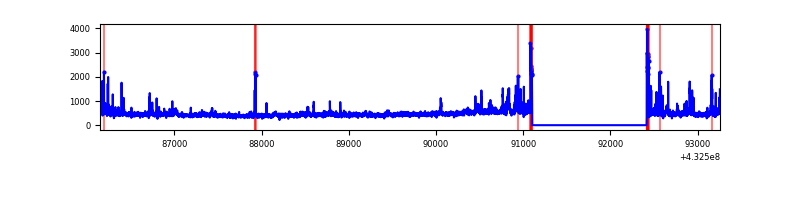 |
| C | 7111 | 5799 | 0 | 0 | 0.00% | 0.00% | 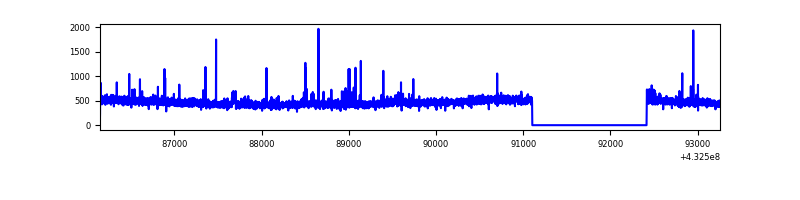 |
| D | 7111 | 5799 | 150 | 150 | 2.11% | 2.59% | 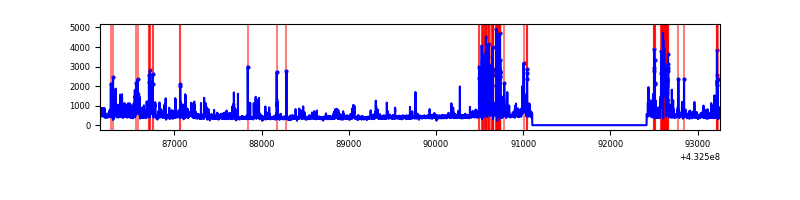 |
Top three noisy pixels from each quadrant. If the there are fewer than three noisy pixels in the level2.evt file, extra rows are filled as -1
| Pixel properties | Quadrant properties | ||||||
|---|---|---|---|---|---|---|---|
| Quadrant | DetID | PixID | Counts | Sigma | Mean | Median | Sigma |
| A | 10 | 83 | 624052 | 4895.89 | 618 | 604 | 127.3 |
| A | 12 | 189 | 211595 | 1656.9 | 618 | 604 | 127.3 |
| A | 15 | 237 | 118015 | 922.02 | 618 | 604 | 127.3 |
| B | 0 | 229 | 204209 | 1713.59 | 612 | 595 | 118.8 |
| B | 5 | 255 | 156353 | 1310.84 | 612 | 595 | 118.8 |
| B | 3 | 112 | 51871 | 431.53 | 612 | 595 | 118.8 |
| C | 15 | 214 | 248333 | 1755.67 | 606 | 610 | 141.1 |
| C | 0 | 207 | 41512 | 289.88 | 606 | 610 | 141.1 |
| C | 14 | 254 | 38698 | 269.94 | 606 | 610 | 141.1 |
| D | 1 | 52 | 487641 | 3343.04 | 595 | 575 | 145.7 |
| D | 12 | 218 | 219115 | 1499.98 | 595 | 575 | 145.7 |
| D | 2 | 16 | 134656 | 920.28 | 595 | 575 | 145.7 |
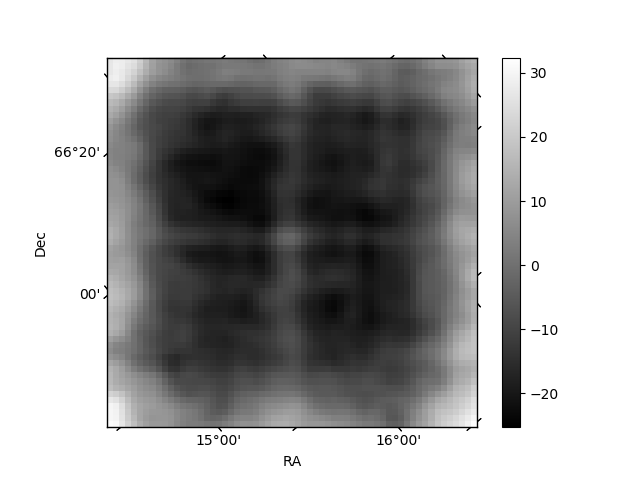
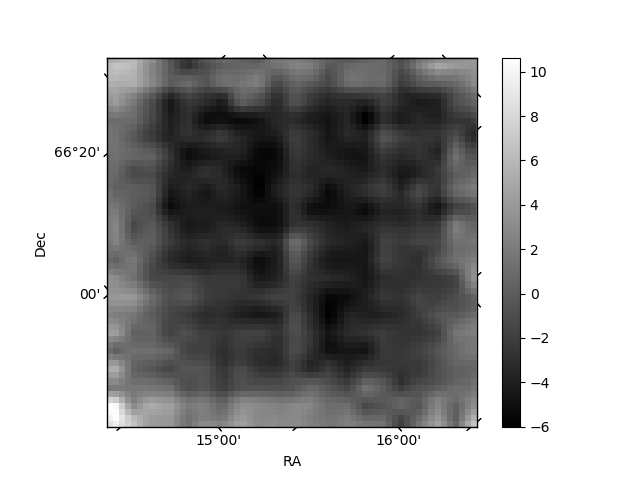
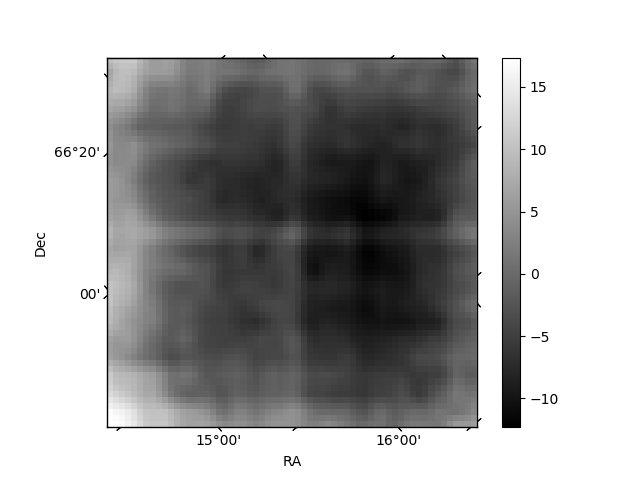
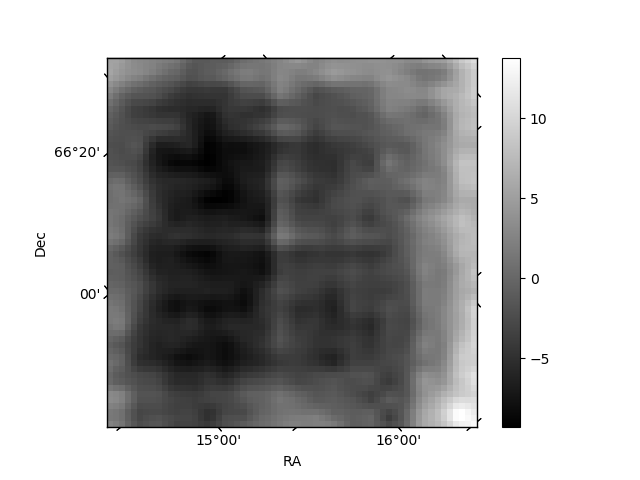
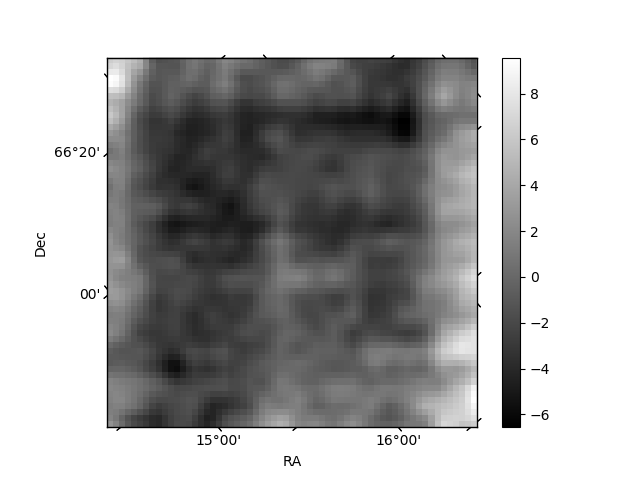
Histogram calculated using DETX and DETY for each event in the final _common_clean file
| Quadrant A | 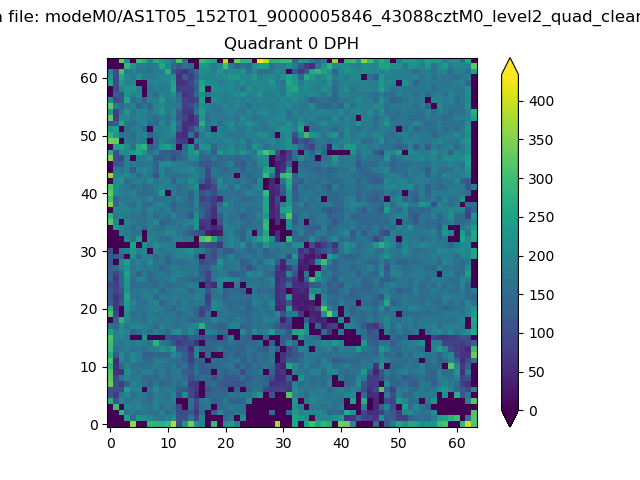 |
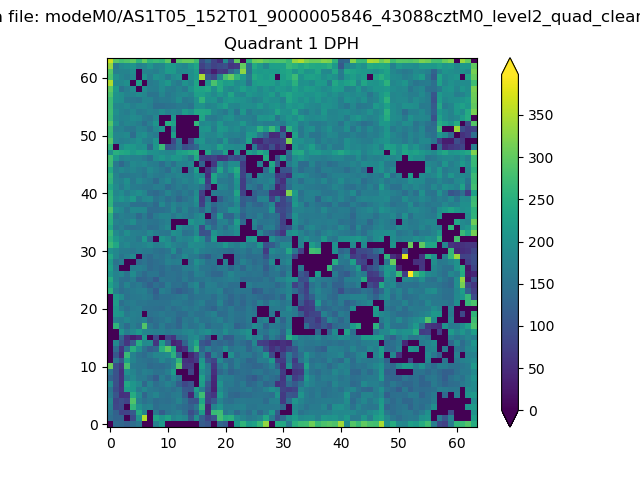 |
Quadrant B |
|---|---|---|---|
| Quadrant D | 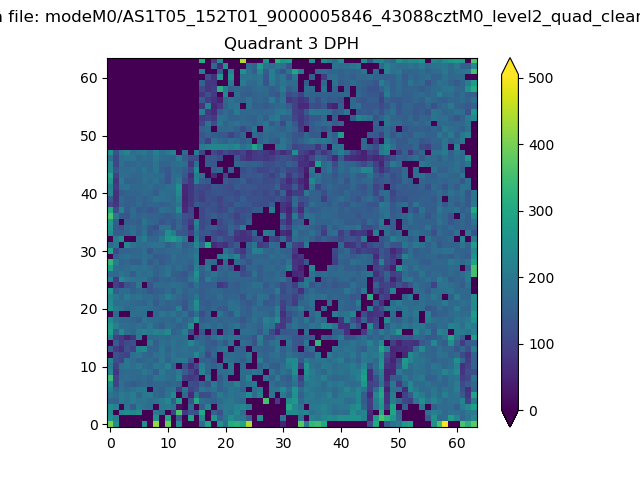 |
 |
Quadrant C |
| Plot type | Count rate plots | Images |
|---|---|---|
| Comparison with Poisson distribution Blue bars denote a histogram of data divided into 1 sec bins. Red curve is a Poisson curve with rate = median count rate of data. |
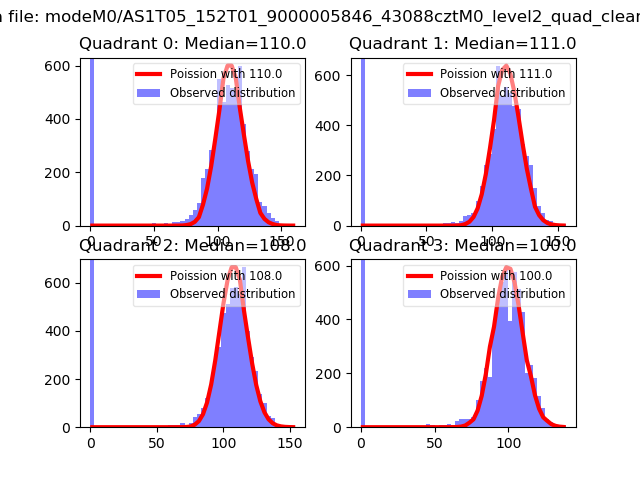 |
 |
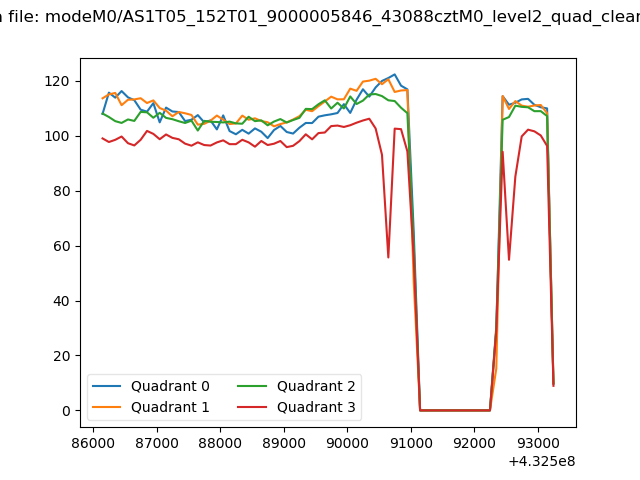
| Quadrant-wise count rates Data is divided into 100 sec bins |
 |
|
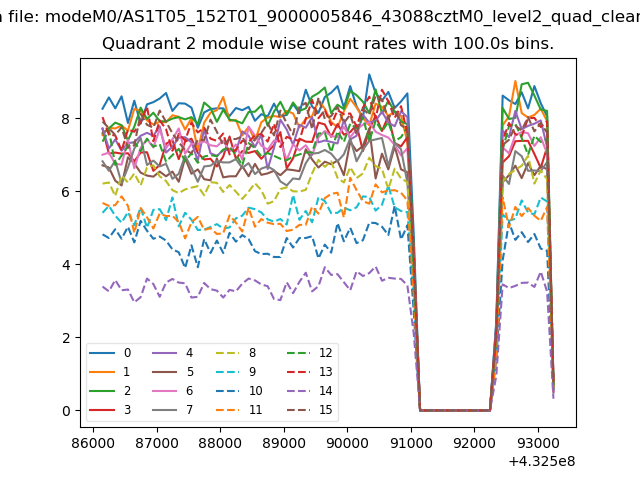
| Module-wise count rates for Quadrant A Data is divided into 100 sec bins |
 |
 |
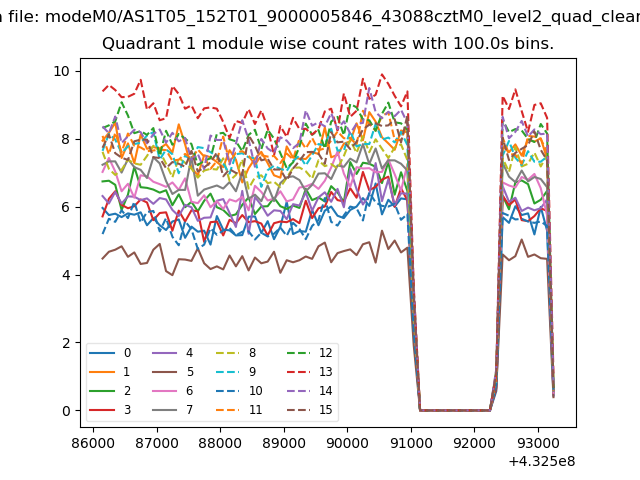
| Module-wise count rates for Quadrant B Data is divided into 100 sec bins |
 |
 |
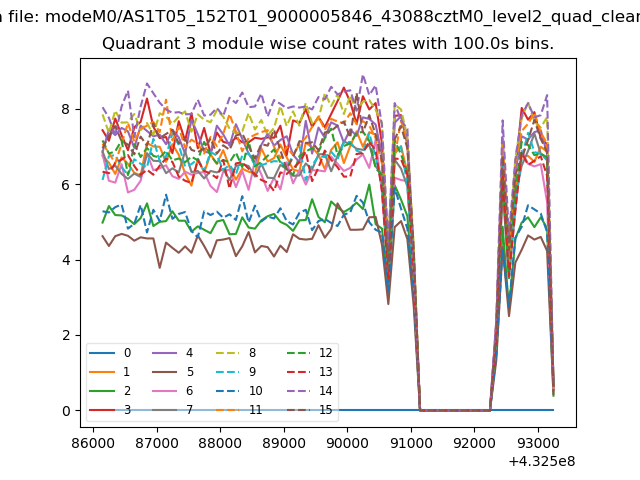
| Module-wise count rates for Quadrant C Data is divided into 100 sec bins |
 |
 |
| Module-wise count rates for Quadrant D Data is divided into 100 sec bins |
 |
 |
| Parameter | Plot |
|---|---|
| CZT HV Monitor |  |
| D_VDD |  |
| Temperature 1 | 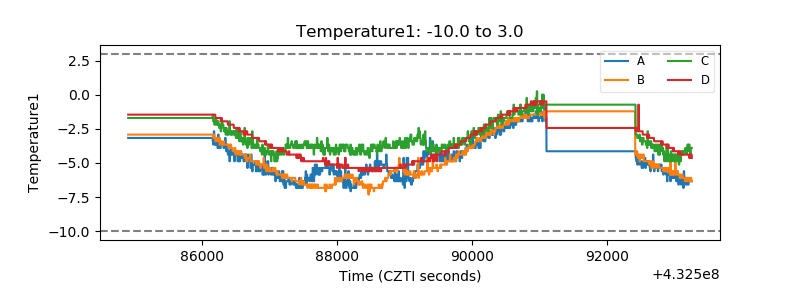 |
| Veto HV Monitor | 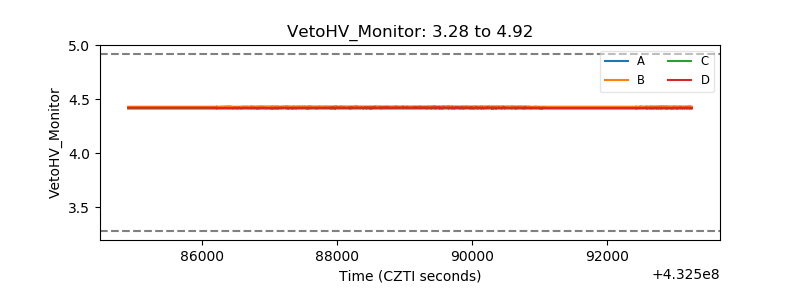 |
| Veto LLD | 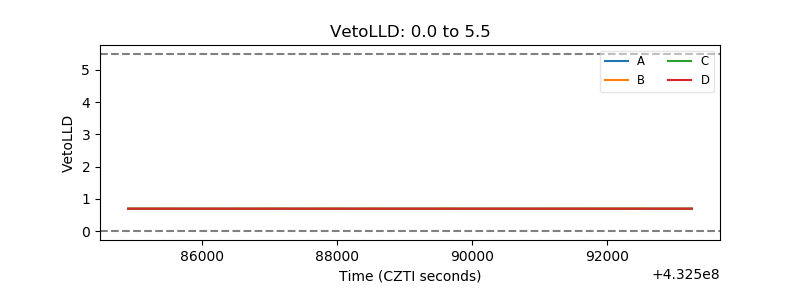 |
| Alpha Counter | 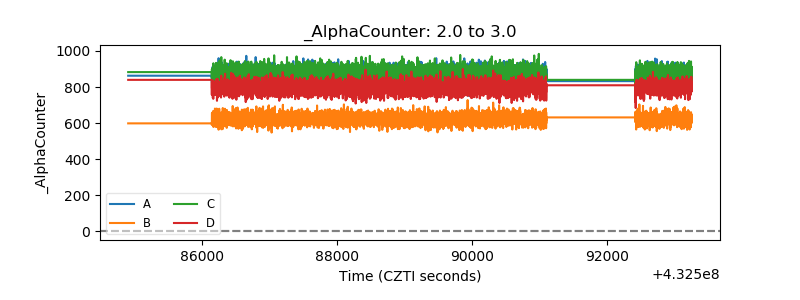 |
| _CPM_Rate | 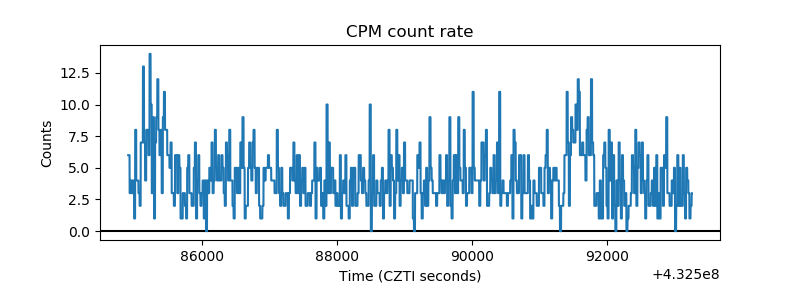 |
| CZT Counter | 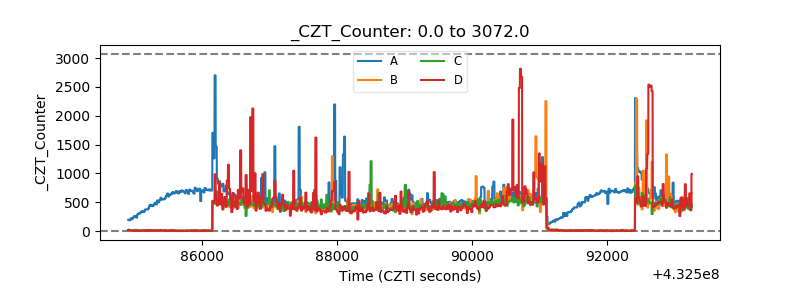 |
| +2.5 Volts monitor | 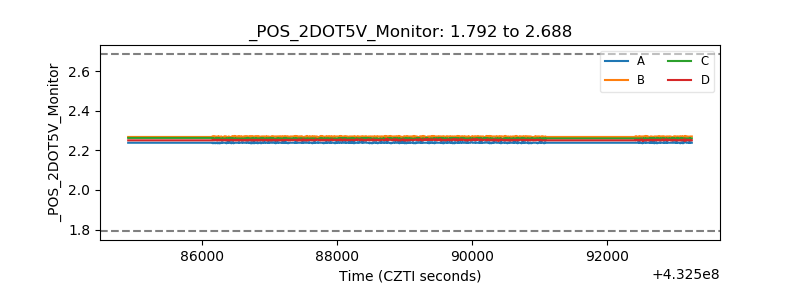 |
| +5 Volts monitor | 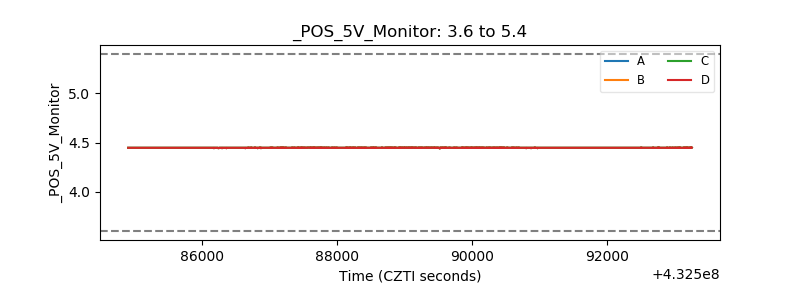 |
| _ROLL_ROT | 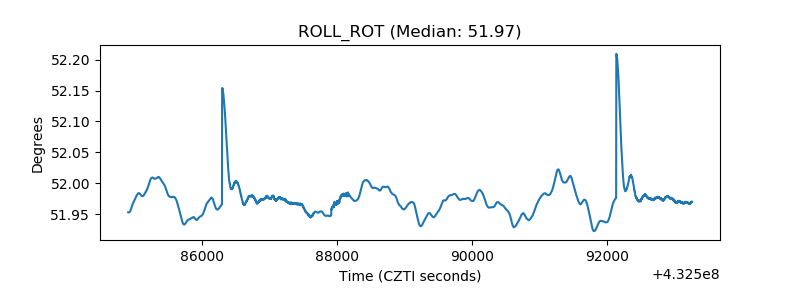 |
| _Roll_DEC | 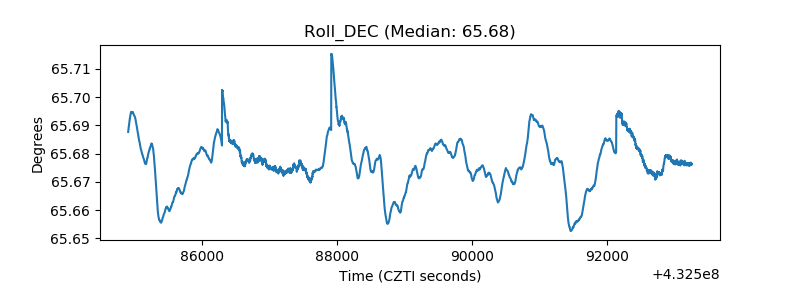 |
| _Roll_RA | 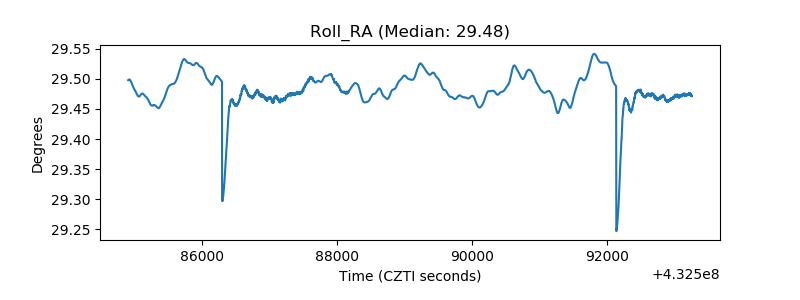 |
| Veto Counter | 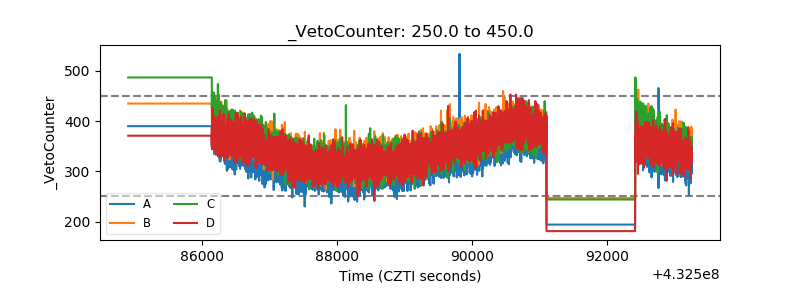 |