| Param | Original file | Final file |
|---|---|---|
| Filename | modeM0/AS1T05_152T01_9000005846_43091cztM0_level2.fits | modeM0/AS1T05_152T01_9000005846_43091cztM0_level2_quad_clean.evt |
| Size (bytes) | 940,694,400 | 252,797,760 |
| Size | 897.1 MB | 241.1 MB |
| Events in quadrant A | 9,015,579 | 1,684,615 |
| Events in quadrant B | 8,156,798 | 1,708,676 |
| Events in quadrant C | 7,232,556 | 1,670,078 |
| Events in quadrant D | 9,194,059 | 1,502,824 |
| Mode M0 | |||
|---|---|---|---|
| Quadrant | BADHDUFLAG | Total packets | Discarded packets |
| A | 0 | 37086 | 4 |
| B | 0 | 35272 | 4 |
| C | 0 | 32094 | 4 |
| D | 0 | 39366 | 4 |
| Mode SS | |||
|---|---|---|---|
| Quadrant | BADHDUFLAG | Total packets | Discarded packets |
| A | 0 | 322 | 0 |
| B | 0 | 322 | 0 |
| C | 0 | 322 | 0 |
| D | 0 | 322 | 0 |
| Mode M9 | |||
|---|---|---|---|
| Quadrant | BADHDUFLAG | Total packets | Discarded packets |
| A | 0 | 56 | 0 |
| B | 0 | 56 | 0 |
| C | 0 | 56 | 0 |
| D | 0 | 56 | 0 |
| Quadrant | Total seconds | Saturated seconds | Saturation percentage |
|---|---|---|---|
| A | 15772 | 200 | 1.268070% |
| B | 15773 | 183 | 1.160210% |
| C | 15773 | 27 | 0.171179% |
| D | 15773 | 541 | 3.429912% |
Noise dominated data is calculated using 1-second bins in cleaned event files. If a bin has >2000 counts, and if more than 50% of those come from <1% of pixels, then it is considered to be noise-dominated and hence unusable.
| Quadrant | # 1 sec bins | Bins with >0 counts | Bins with >2000 counts | High rate bins dominated by noise | Noise dominated (total time) | Noise dominated (detector-on time) | Marked lightcurve |
|---|---|---|---|---|---|---|---|
| A | 21265 | 15776 | 114 | 114 | 0.54% | 0.72% | 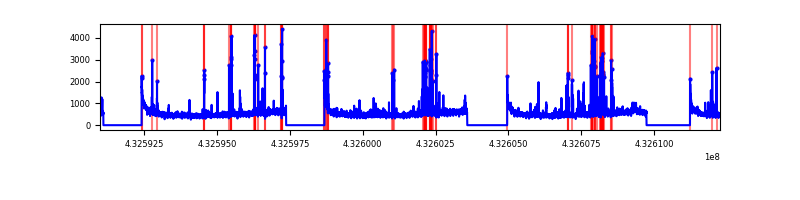 |
| B | 21266 | 15777 | 90 | 90 | 0.42% | 0.57% | 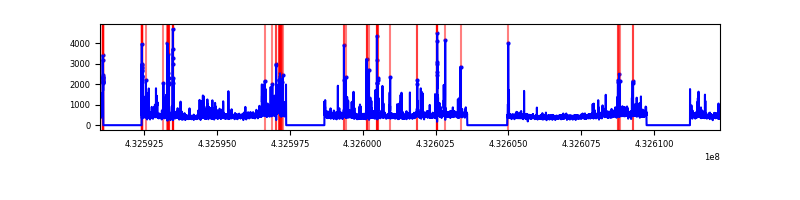 |
| C | 21266 | 15777 | 10 | 10 | 0.05% | 0.06% | 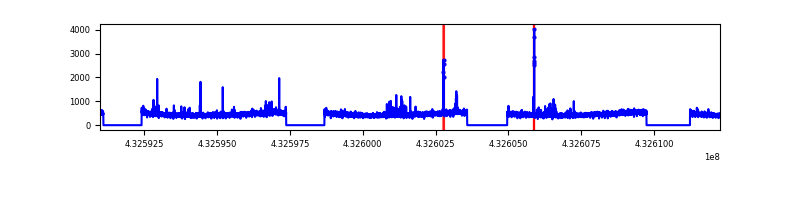 |
| D | 21266 | 15777 | 432 | 432 | 2.03% | 2.74% | 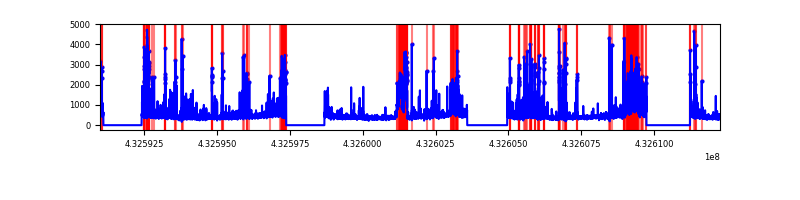 |
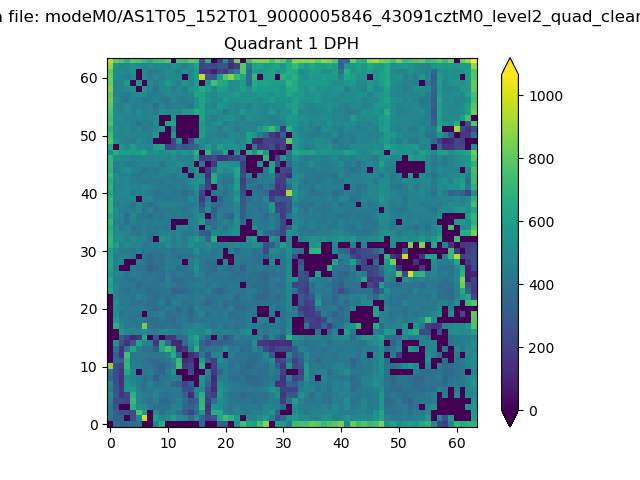
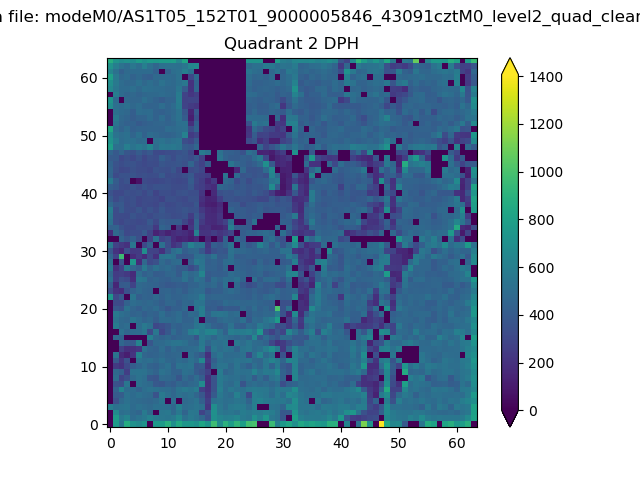
Top three noisy pixels from each quadrant. If the there are fewer than three noisy pixels in the level2.evt file, extra rows are filled as -1
| Pixel properties | Quadrant properties | ||||||
|---|---|---|---|---|---|---|---|
| Quadrant | DetID | PixID | Counts | Sigma | Mean | Median | Sigma |
| A | 10 | 83 | 1529363 | 4457.97 | 1682 | 1644 | 342.7 |
| A | 15 | 237 | 635436 | 1849.44 | 1682 | 1644 | 342.7 |
| A | 12 | 189 | 266395 | 772.56 | 1682 | 1644 | 342.7 |
| B | 5 | 255 | 426645 | 1328.4 | 1667 | 1619 | 320.0 |
| B | 0 | 189 | 388721 | 1209.87 | 1667 | 1619 | 320.0 |
| B | 0 | 229 | 375445 | 1168.37 | 1667 | 1619 | 320.0 |
| C | 15 | 214 | 648814 | 1703.77 | 1646 | 1653 | 379.8 |
| C | 14 | 254 | 99615 | 257.9 | 1646 | 1653 | 379.8 |
| C | 0 | 207 | 35550 | 89.24 | 1646 | 1653 | 379.8 |
| D | 12 | 218 | 797402 | 2034.37 | 1623 | 1574 | 391.2 |
| D | 13 | 249 | 628379 | 1602.29 | 1623 | 1574 | 391.2 |
| D | 5 | 32 | 624863 | 1593.31 | 1623 | 1574 | 391.2 |
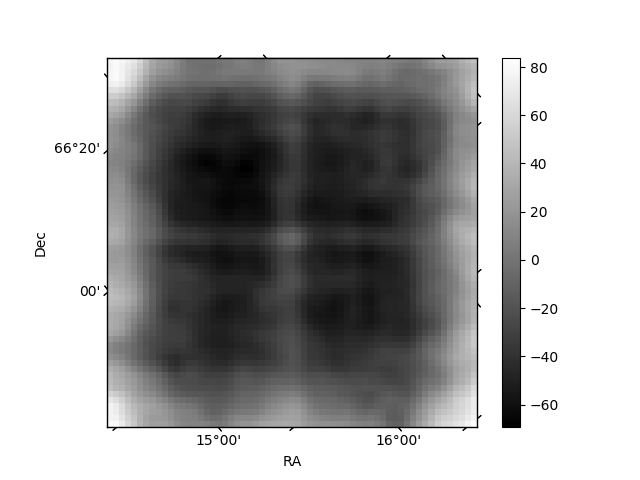
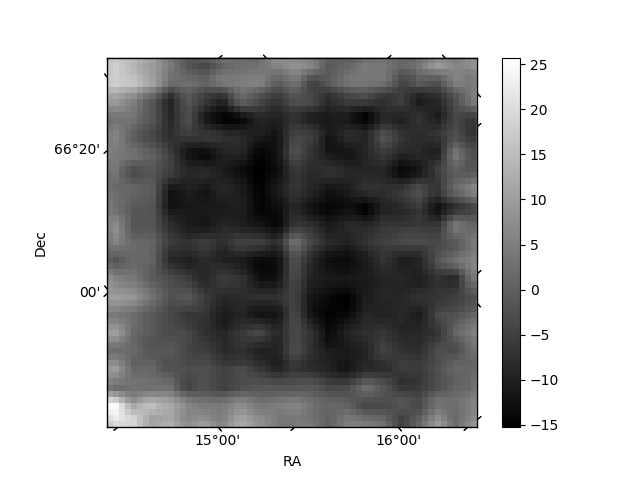
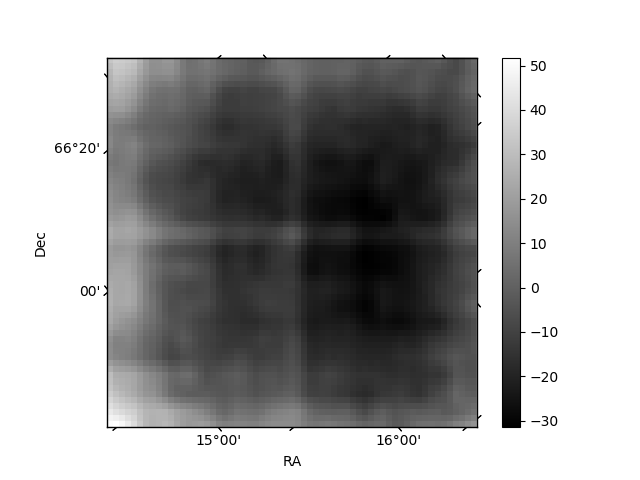
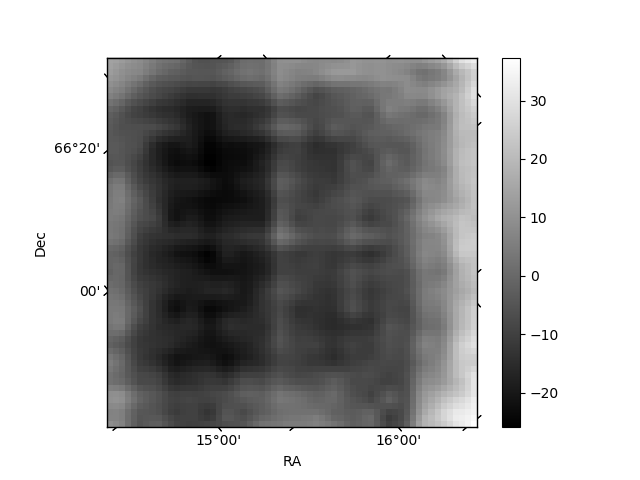
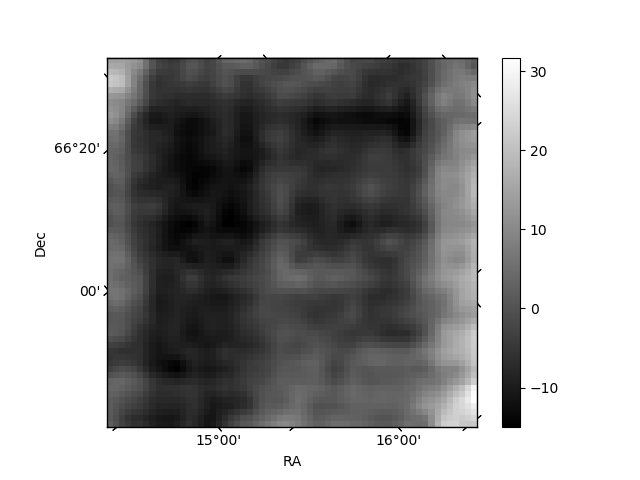
Histogram calculated using DETX and DETY for each event in the final _common_clean file
| Quadrant A | 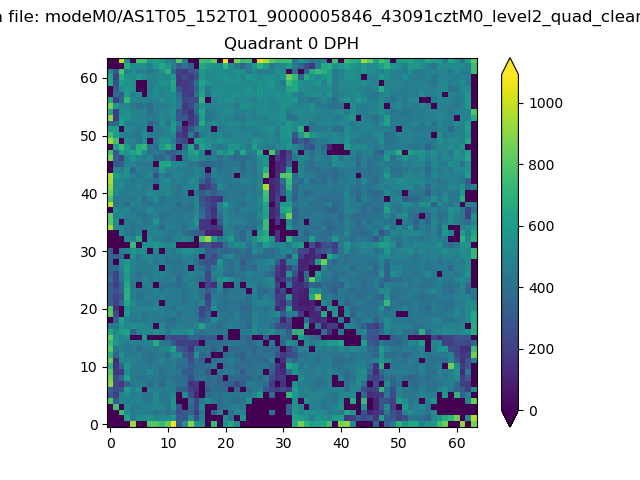 |
 |
Quadrant B |
|---|---|---|---|
| Quadrant D | 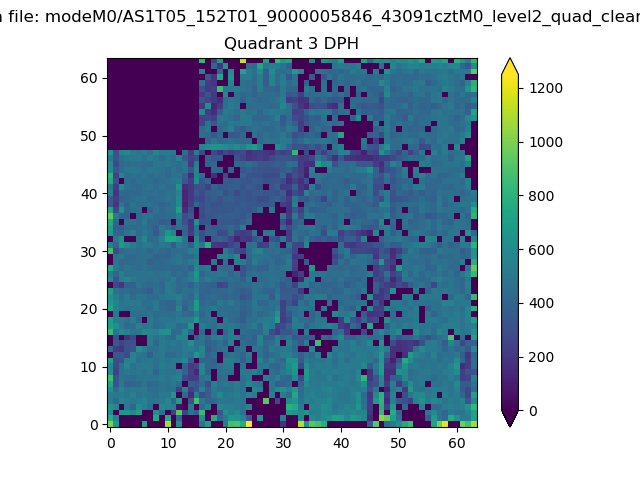 |
 |
Quadrant C |
| Plot type | Count rate plots | Images |
|---|---|---|
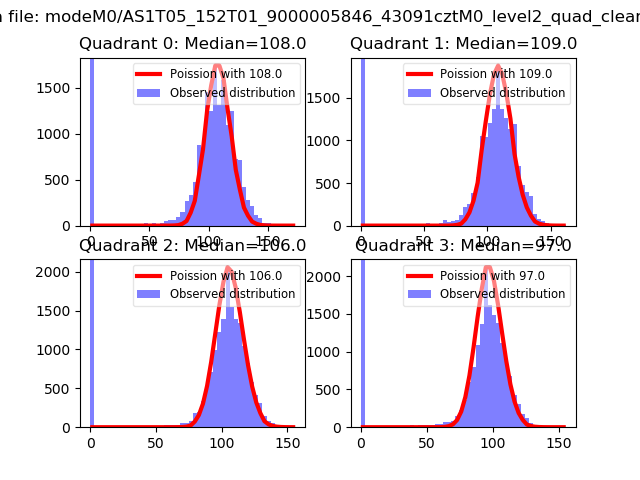
| Comparison with Poisson distribution Blue bars denote a histogram of data divided into 1 sec bins. Red curve is a Poisson curve with rate = median count rate of data. |
 |
 |
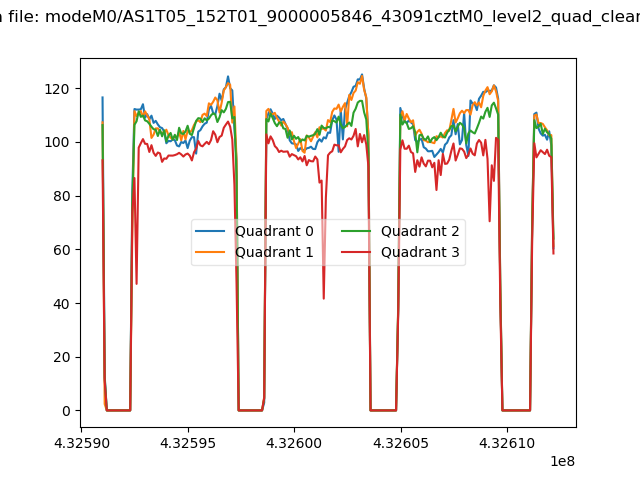
| Quadrant-wise count rates Data is divided into 100 sec bins |
 |
|
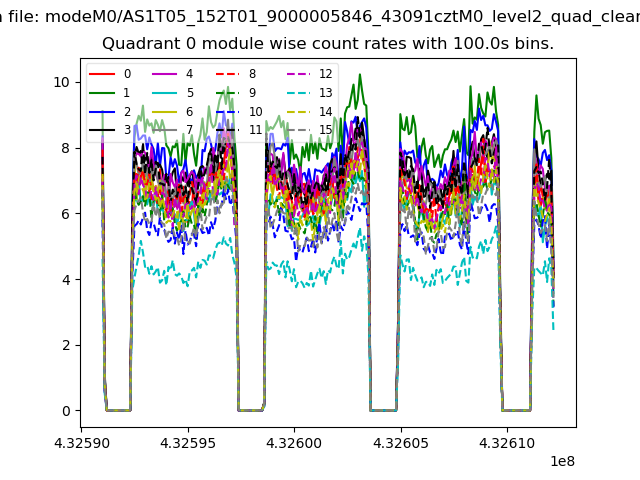
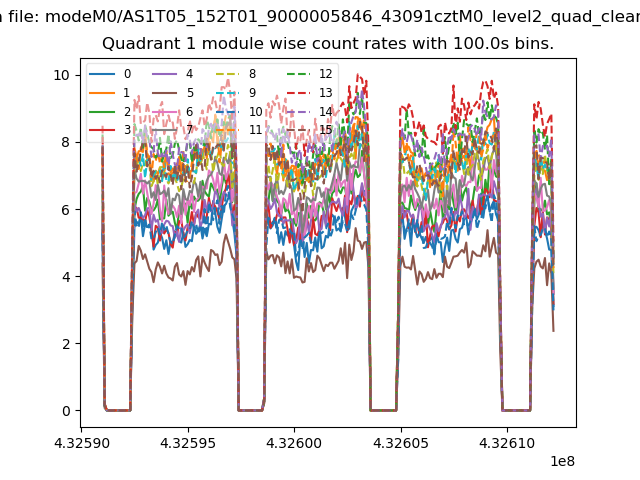
| Module-wise count rates for Quadrant A Data is divided into 100 sec bins |
 |
 |
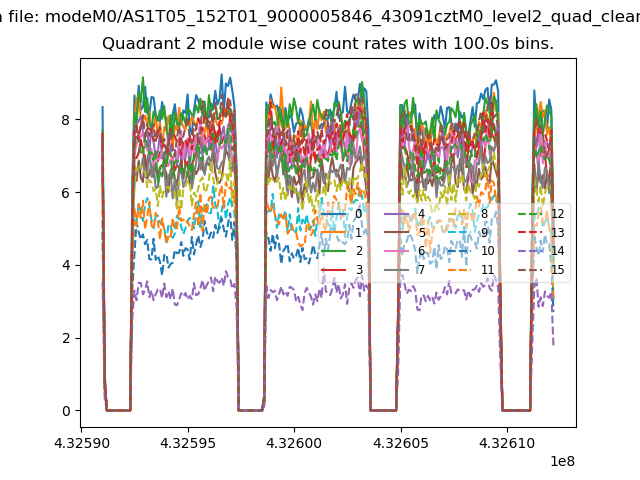
| Module-wise count rates for Quadrant B Data is divided into 100 sec bins |
 |
 |
| Module-wise count rates for Quadrant C Data is divided into 100 sec bins |
 |
 |
| Module-wise count rates for Quadrant D Data is divided into 100 sec bins |
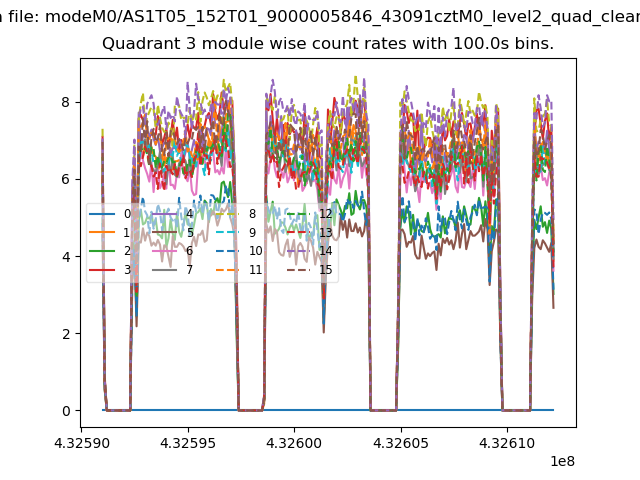 |
 |
| Parameter | Plot |
|---|---|
| CZT HV Monitor | 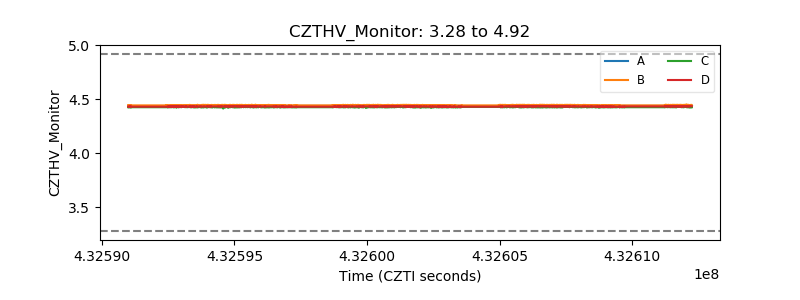 |
| D_VDD | 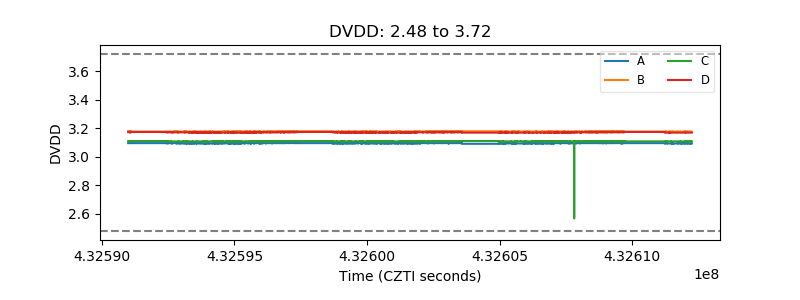 |
| Temperature 1 | 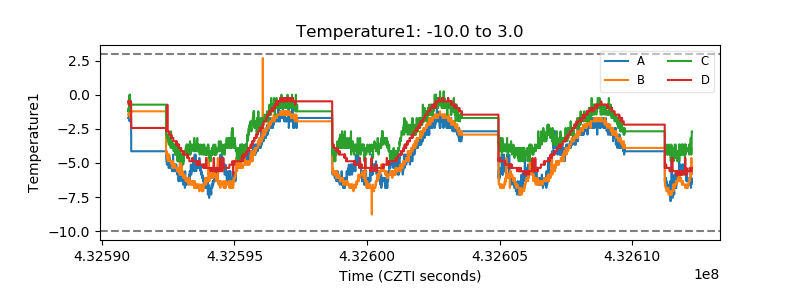 |
| Veto HV Monitor | 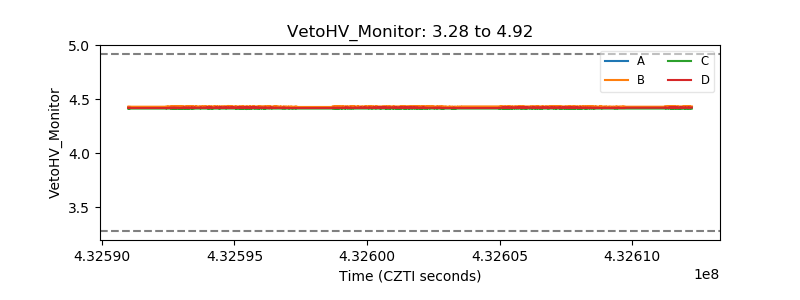 |
| Veto LLD | 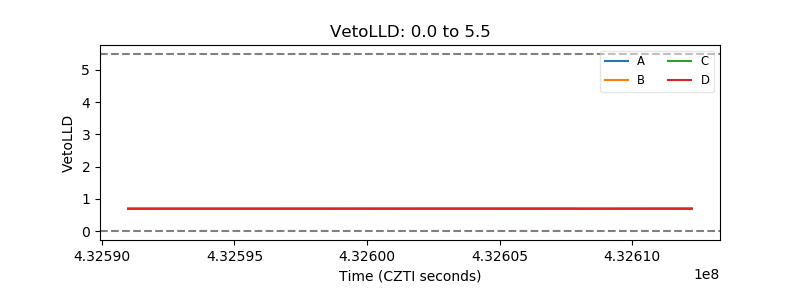 |
| Alpha Counter | 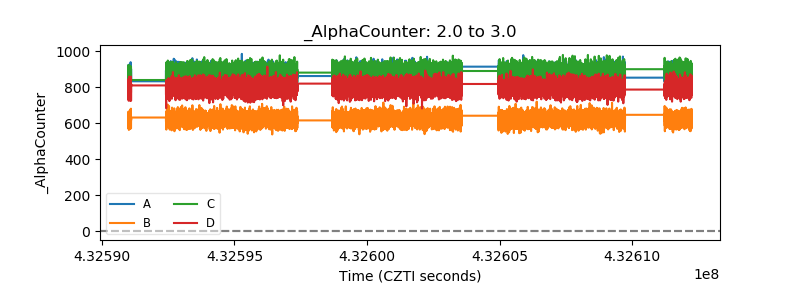 |
| _CPM_Rate | 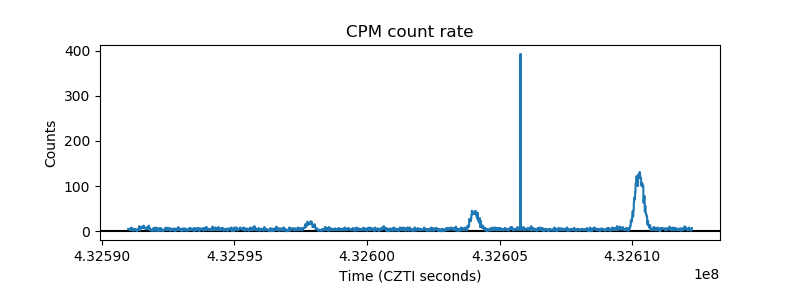 |
| CZT Counter | 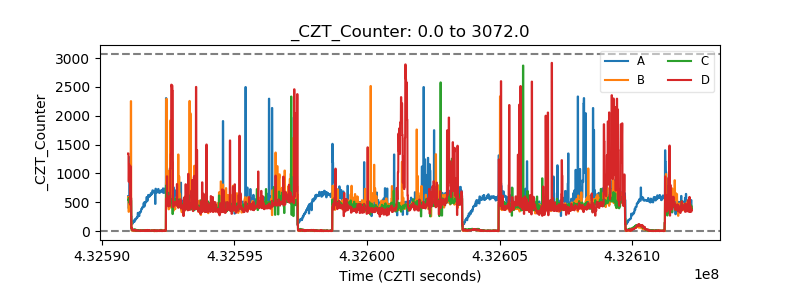 |
| +2.5 Volts monitor | 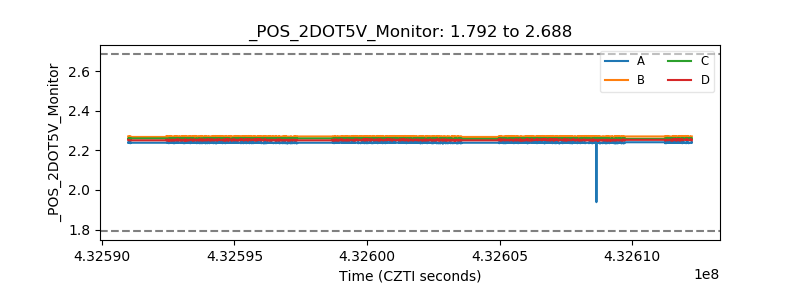 |
| +5 Volts monitor | 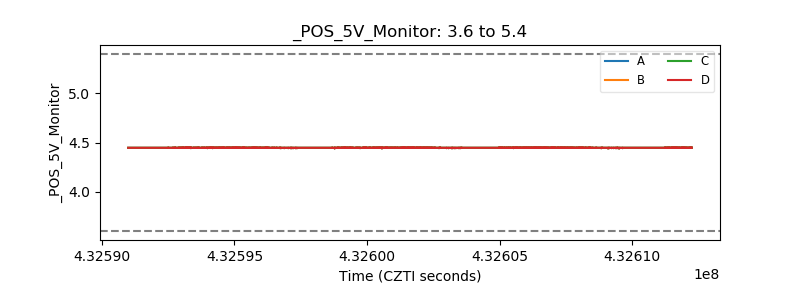 |
| _ROLL_ROT | 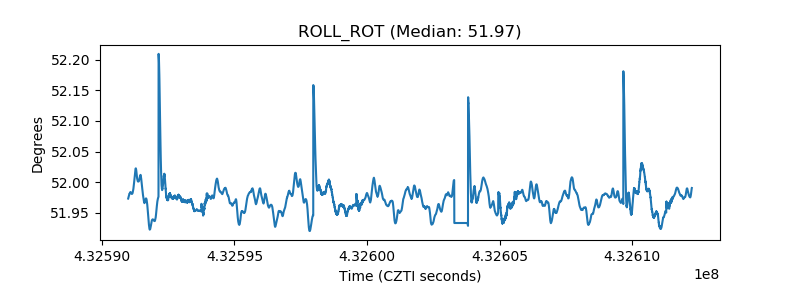 |
| _Roll_DEC | 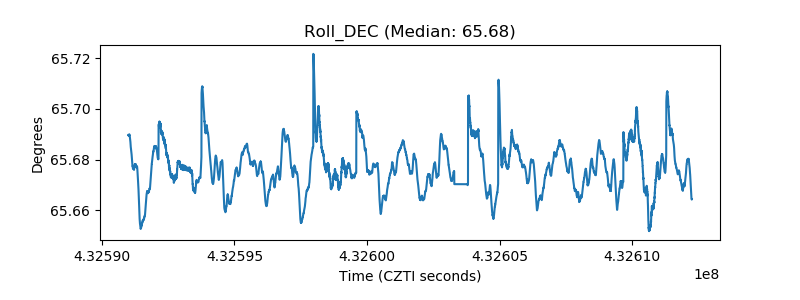 |
| _Roll_RA | 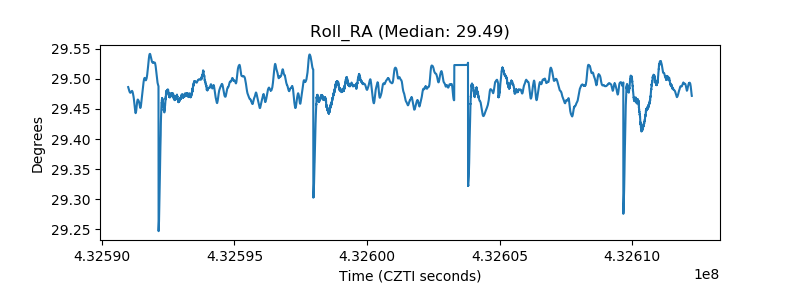 |
| Veto Counter | 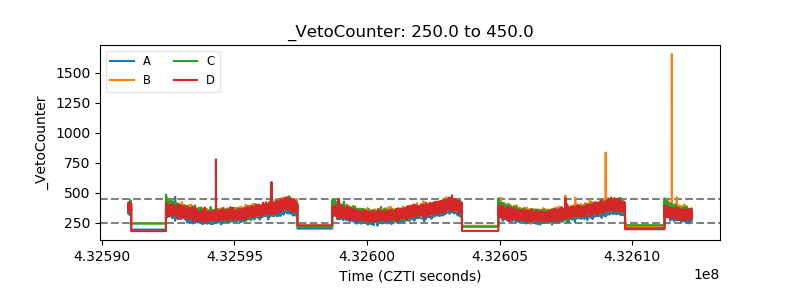 |