| Param | Original file | Final file |
|---|---|---|
| Filename | modeM0/AS1T05_152T01_9000005846_43092cztM0_level2.fits | modeM0/AS1T05_152T01_9000005846_43092cztM0_level2_quad_clean.evt |
| Size (bytes) | 351,691,200 | 97,663,680 |
| Size | 335.4 MB | 93.1 MB |
| Events in quadrant A | 3,394,828 | 649,594 |
| Events in quadrant B | 2,916,073 | 660,144 |
| Events in quadrant C | 2,784,859 | 640,573 |
| Events in quadrant D | 3,451,985 | 584,936 |
| Mode M0 | |||
|---|---|---|---|
| Quadrant | BADHDUFLAG | Total packets | Discarded packets |
| A | 0 | 13965 | 3 |
| B | 0 | 12887 | 2 |
| C | 0 | 12312 | 2 |
| D | 0 | 14706 | 2 |
| Mode SS | |||
|---|---|---|---|
| Quadrant | BADHDUFLAG | Total packets | Discarded packets |
| A | 0 | 124 | 0 |
| B | 0 | 124 | 0 |
| C | 0 | 124 | 0 |
| D | 0 | 124 | 0 |
| Mode M9 | |||
|---|---|---|---|
| Quadrant | BADHDUFLAG | Total packets | Discarded packets |
| A | 0 | 31 | 0 |
| B | 0 | 31 | 0 |
| C | 0 | 31 | 0 |
| D | 0 | 31 | 0 |
| Quadrant | Total seconds | Saturated seconds | Saturation percentage |
|---|---|---|---|
| A | 6043 | 45 | 0.744663% |
| B | 6043 | 15 | 0.248221% |
| C | 6043 | 8 | 0.132385% |
| D | 6043 | 140 | 2.316730% |
Noise dominated data is calculated using 1-second bins in cleaned event files. If a bin has >2000 counts, and if more than 50% of those come from <1% of pixels, then it is considered to be noise-dominated and hence unusable.
| Quadrant | # 1 sec bins | Bins with >0 counts | Bins with >2000 counts | High rate bins dominated by noise | Noise dominated (total time) | Noise dominated (detector-on time) | Marked lightcurve |
|---|---|---|---|---|---|---|---|
| A | 9118 | 6045 | 36 | 36 | 0.39% | 0.60% | 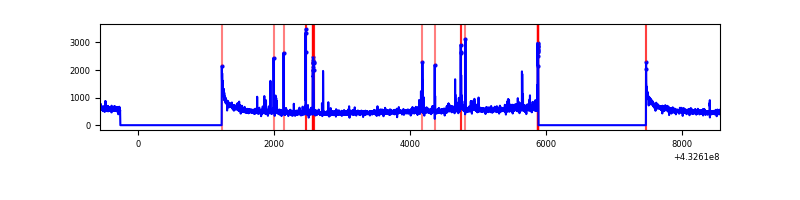 |
| B | 9118 | 6045 | 8 | 8 | 0.09% | 0.13% | 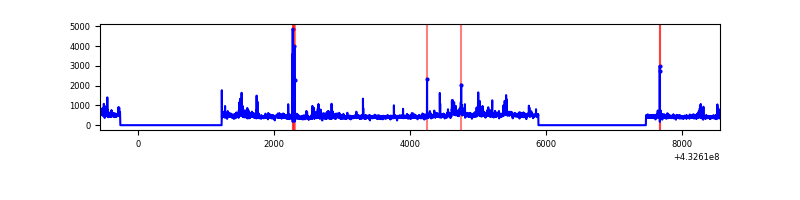 |
| C | 9118 | 6045 | 1 | 1 | 0.01% | 0.02% | 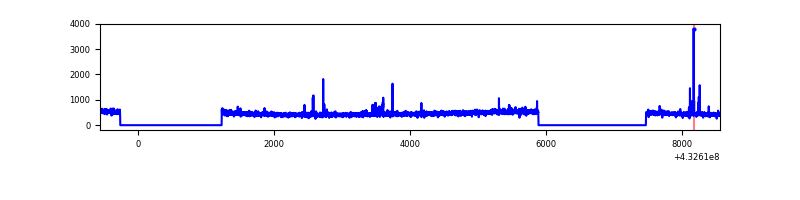 |
| D | 9118 | 6045 | 105 | 105 | 1.15% | 1.74% | 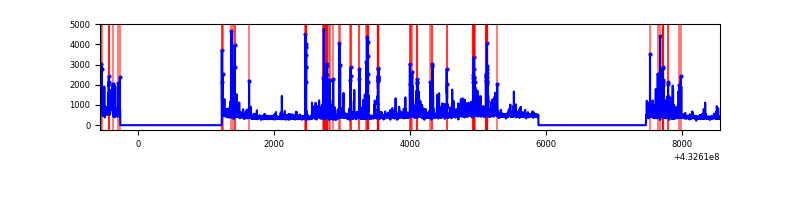 |
Top three noisy pixels from each quadrant. If the there are fewer than three noisy pixels in the level2.evt file, extra rows are filled as -1
| Pixel properties | Quadrant properties | ||||||
|---|---|---|---|---|---|---|---|
| Quadrant | DetID | PixID | Counts | Sigma | Mean | Median | Sigma |
| A | 10 | 83 | 634209 | 4736.59 | 648 | 635 | 133.8 |
| A | 15 | 237 | 137765 | 1025.18 | 648 | 635 | 133.8 |
| A | 12 | 189 | 105904 | 786.99 | 648 | 635 | 133.8 |
| B | 0 | 229 | 157253 | 1244.27 | 643 | 624 | 125.9 |
| B | 0 | 189 | 78797 | 621.01 | 643 | 624 | 125.9 |
| B | 5 | 255 | 77374 | 609.7 | 643 | 624 | 125.9 |
| C | 15 | 214 | 251746 | 1689.97 | 633 | 634 | 148.6 |
| C | 0 | 207 | 34047 | 224.87 | 633 | 634 | 148.6 |
| C | 14 | 254 | 22397 | 146.46 | 633 | 634 | 148.6 |
| D | 1 | 52 | 540981 | 3519.52 | 626 | 605 | 153.5 |
| D | 12 | 6 | 157826 | 1023.99 | 626 | 605 | 153.5 |
| D | 12 | 218 | 136157 | 882.86 | 626 | 605 | 153.5 |
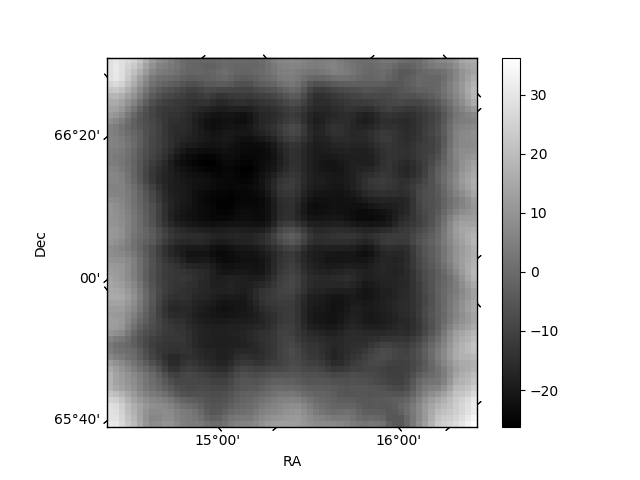
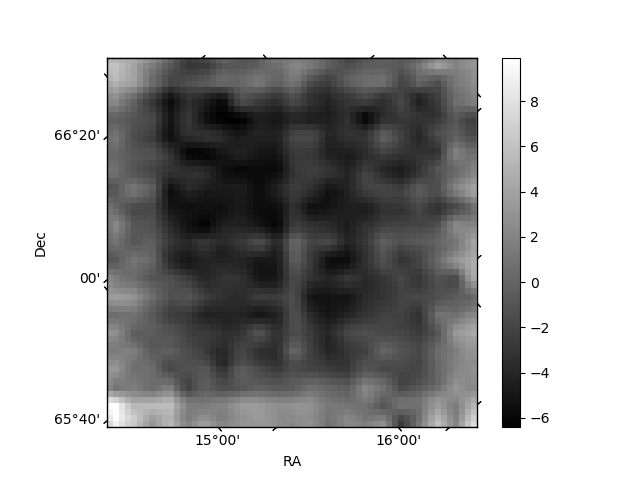
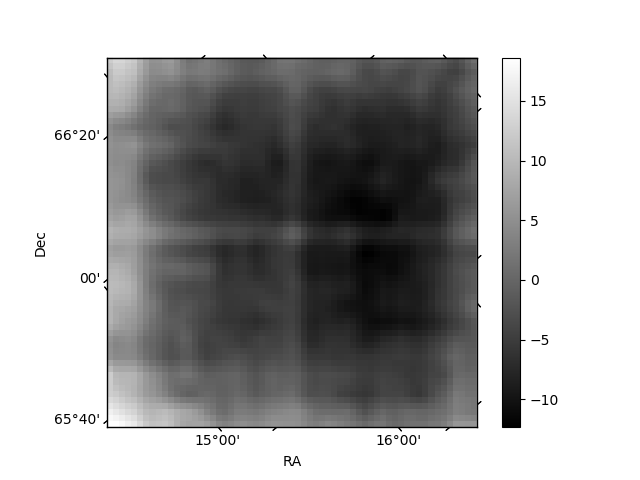
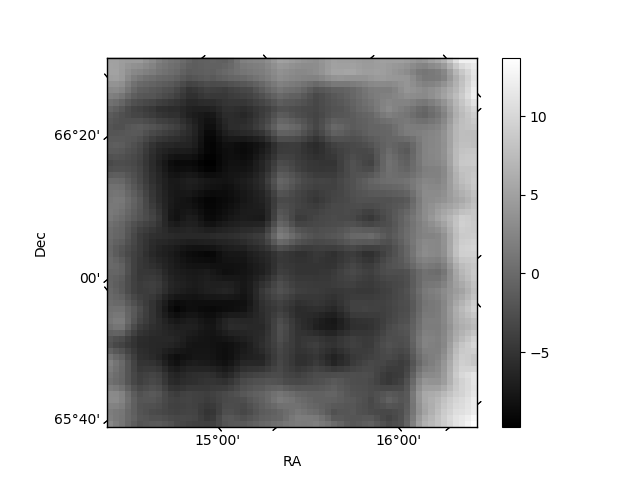
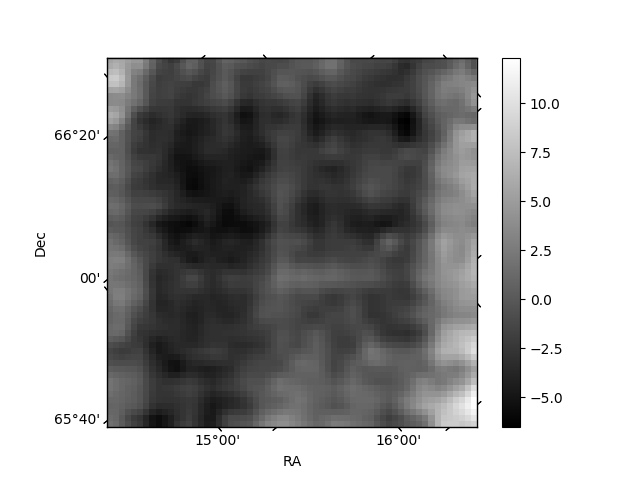
Histogram calculated using DETX and DETY for each event in the final _common_clean file
| Quadrant A | 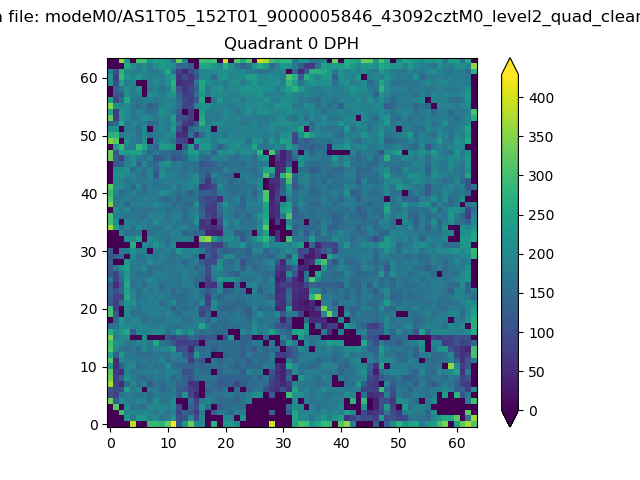 |
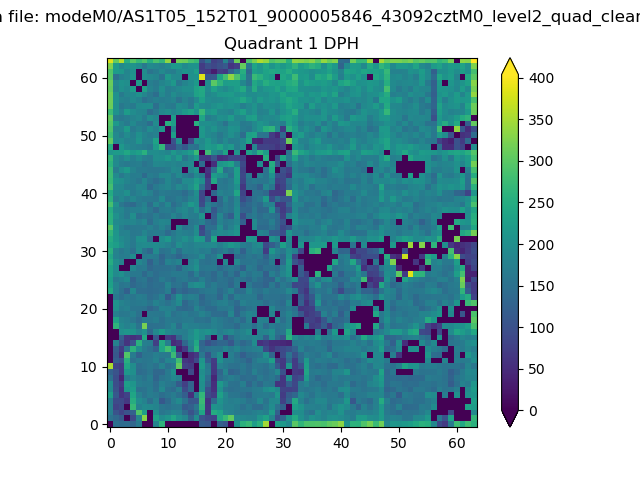 |
Quadrant B |
|---|---|---|---|
| Quadrant D | 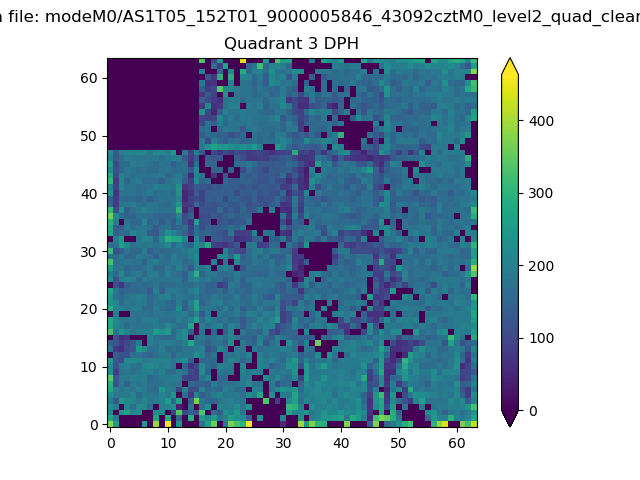 |
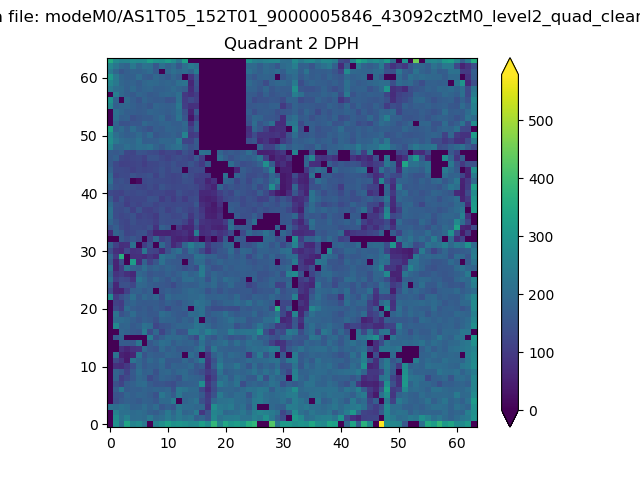 |
Quadrant C |
| Plot type | Count rate plots | Images |
|---|---|---|
| Comparison with Poisson distribution Blue bars denote a histogram of data divided into 1 sec bins. Red curve is a Poisson curve with rate = median count rate of data. |
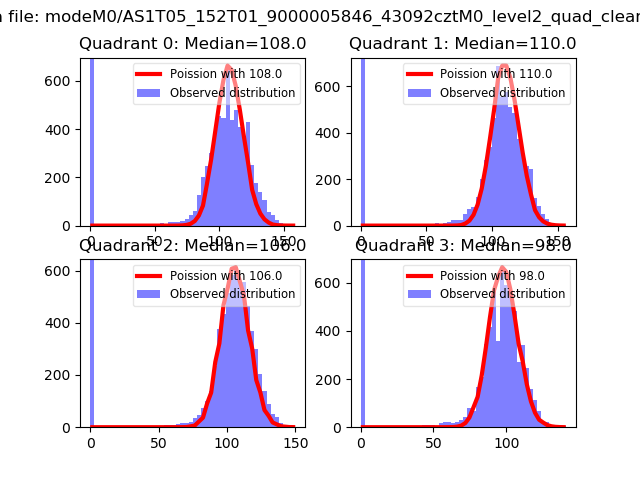 |
 |
| Quadrant-wise count rates Data is divided into 100 sec bins |
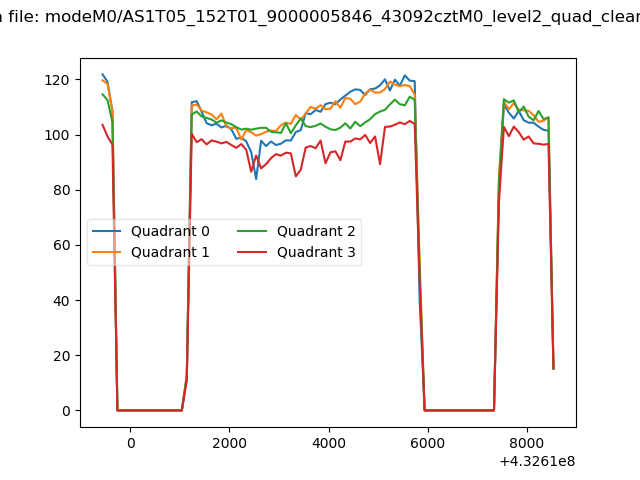 |
|
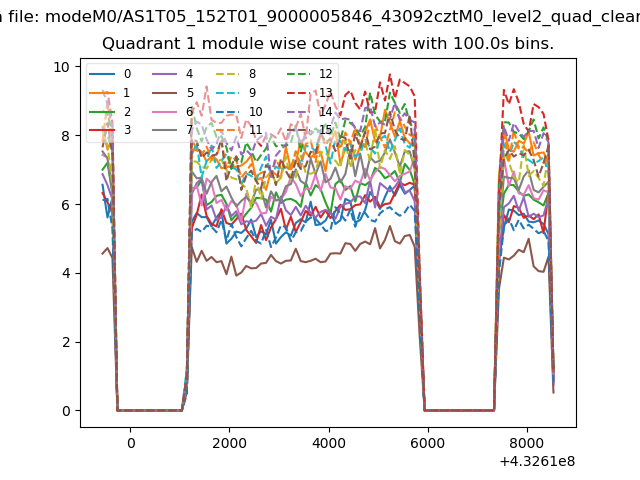
| Module-wise count rates for Quadrant A Data is divided into 100 sec bins |
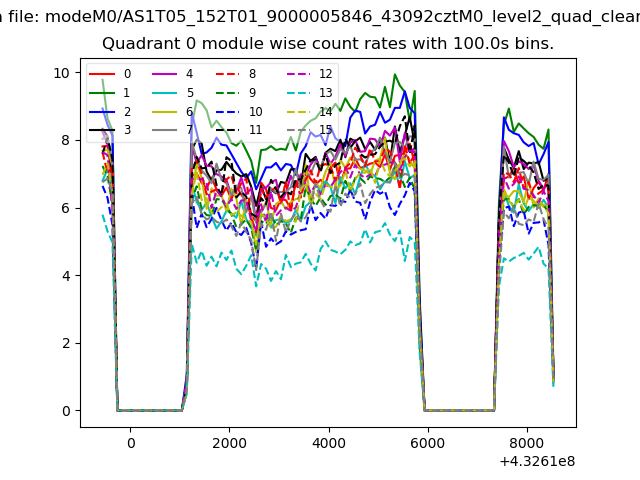 |
 |
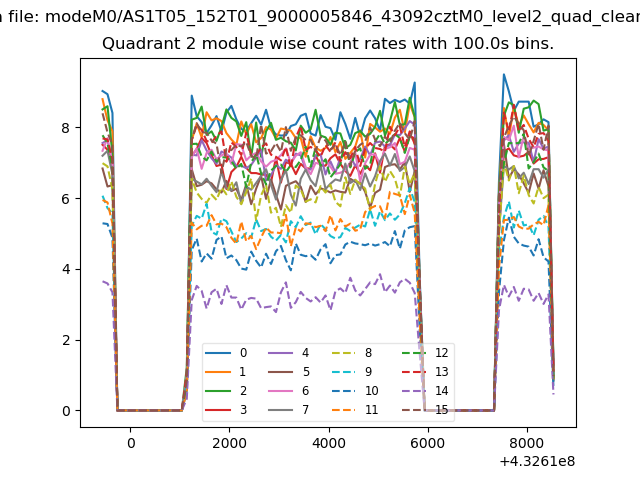
| Module-wise count rates for Quadrant B Data is divided into 100 sec bins |
 |
 |
| Module-wise count rates for Quadrant C Data is divided into 100 sec bins |
 |
 |
| Module-wise count rates for Quadrant D Data is divided into 100 sec bins |
 |
 |
| Parameter | Plot |
|---|---|
| CZT HV Monitor | 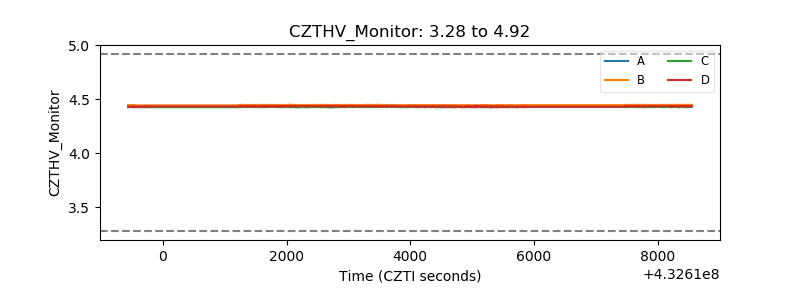 |
| D_VDD | 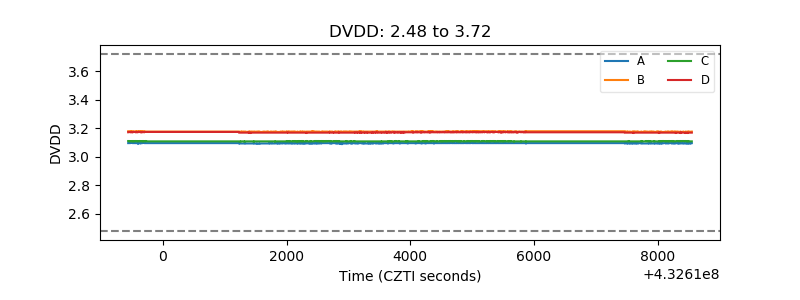 |
| Temperature 1 | 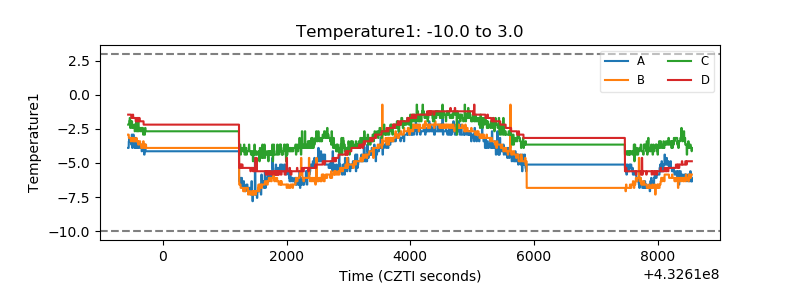 |
| Veto HV Monitor | 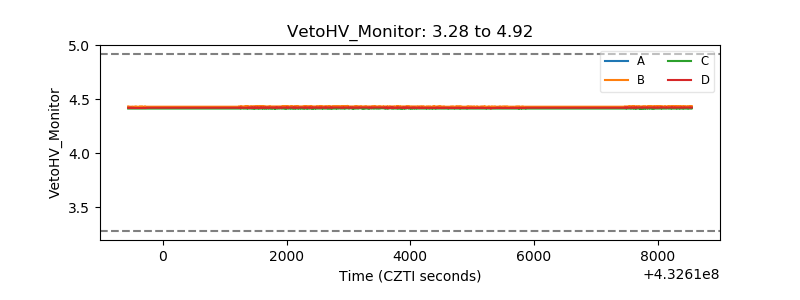 |
| Veto LLD | 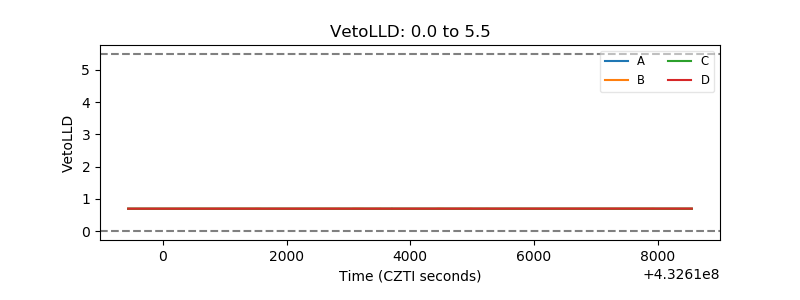 |
| Alpha Counter | 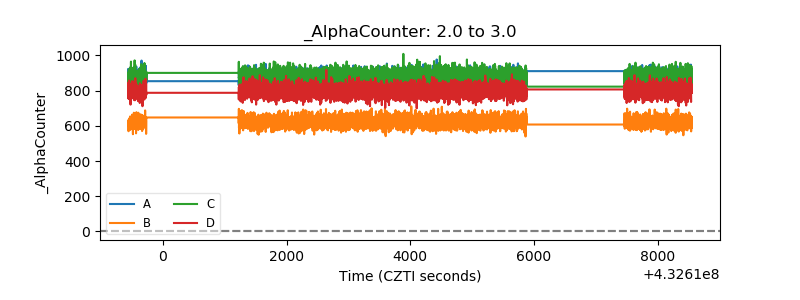 |
| _CPM_Rate | 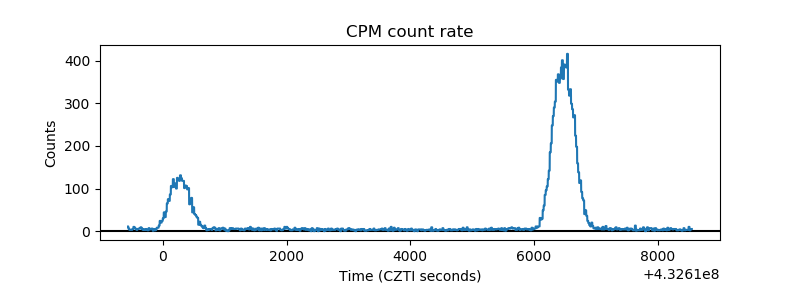 |
| CZT Counter | 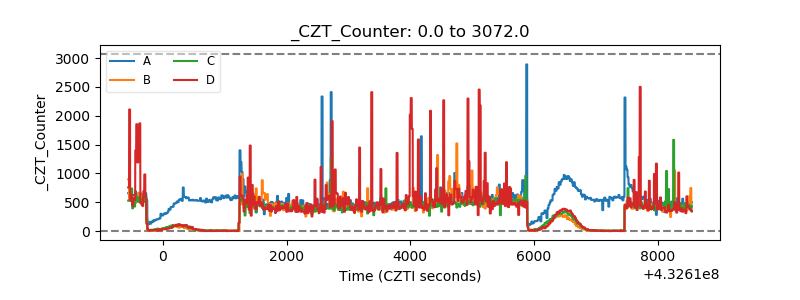 |
| +2.5 Volts monitor | 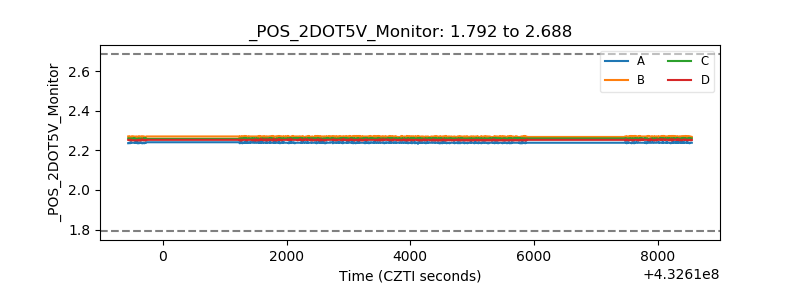 |
| +5 Volts monitor | 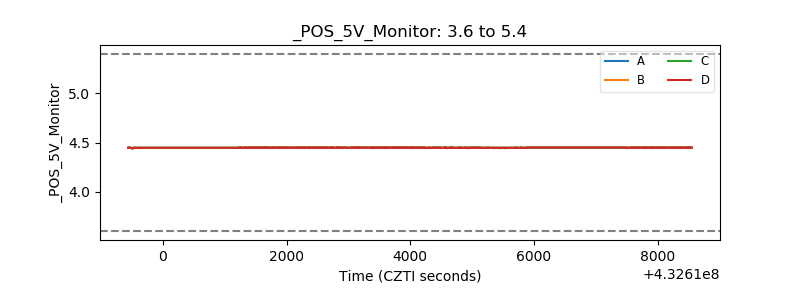 |
| _ROLL_ROT | 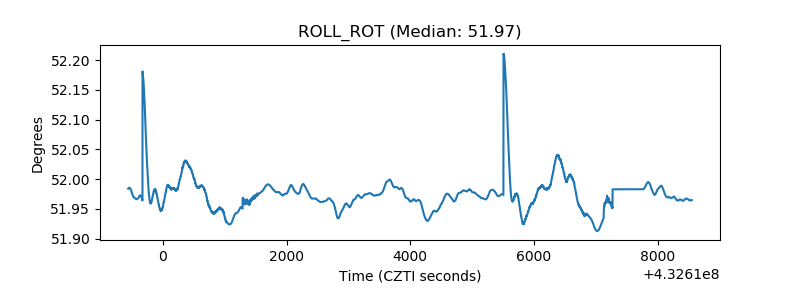 |
| _Roll_DEC | 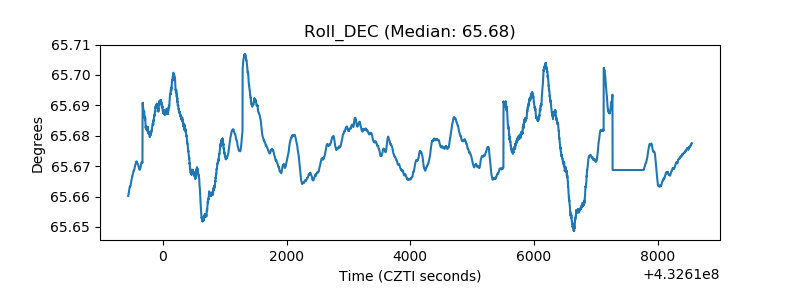 |
| _Roll_RA | 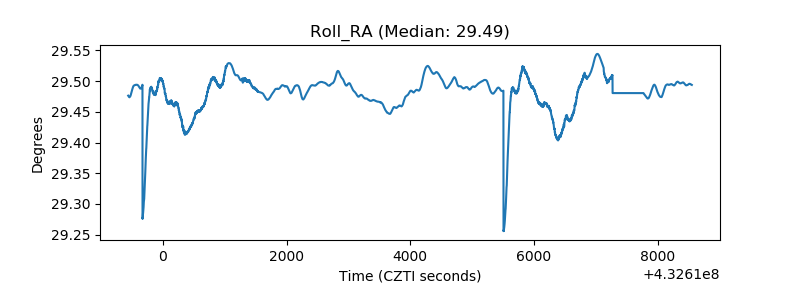 |
| Veto Counter |  |