| Param | Original file | Final file |
|---|---|---|
| Filename | modeM0/AS1T05_152T01_9000005846_43094cztM0_level2.fits | modeM0/AS1T05_152T01_9000005846_43094cztM0_level2_quad_clean.evt |
| Size (bytes) | 293,901,120 | 84,320,640 |
| Size | 280.3 MB | 80.4 MB |
| Events in quadrant A | 2,972,164 | 563,337 |
| Events in quadrant B | 2,543,023 | 573,819 |
| Events in quadrant C | 2,366,190 | 551,174 |
| Events in quadrant D | 2,596,308 | 504,357 |
| Mode M0 | |||
|---|---|---|---|
| Quadrant | BADHDUFLAG | Total packets | Discarded packets |
| A | 0 | 11951 | 1 |
| B | 0 | 11124 | 1 |
| C | 0 | 10458 | 1 |
| D | 0 | 11627 | 1 |
| Mode SS | |||
|---|---|---|---|
| Quadrant | BADHDUFLAG | Total packets | Discarded packets |
| A | 0 | 104 | 0 |
| B | 0 | 104 | 0 |
| C | 0 | 104 | 0 |
| D | 0 | 104 | 0 |
| Mode M9 | |||
|---|---|---|---|
| Quadrant | BADHDUFLAG | Total packets | Discarded packets |
| A | 0 | 18 | 0 |
| B | 0 | 18 | 0 |
| C | 0 | 18 | 0 |
| D | 0 | 18 | 0 |
| Quadrant | Total seconds | Saturated seconds | Saturation percentage |
|---|---|---|---|
| A | 5146 | 34 | 0.660707% |
| B | 5147 | 39 | 0.757723% |
| C | 5147 | 5 | 0.097144% |
| D | 5147 | 100 | 1.942879% |
Noise dominated data is calculated using 1-second bins in cleaned event files. If a bin has >2000 counts, and if more than 50% of those come from <1% of pixels, then it is considered to be noise-dominated and hence unusable.
| Quadrant | # 1 sec bins | Bins with >0 counts | Bins with >2000 counts | High rate bins dominated by noise | Noise dominated (total time) | Noise dominated (detector-on time) | Marked lightcurve |
|---|---|---|---|---|---|---|---|
| A | 6879 | 5147 | 17 | 17 | 0.25% | 0.33% | 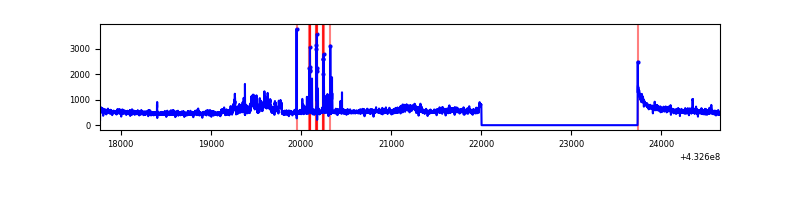 |
| B | 6880 | 5148 | 25 | 25 | 0.36% | 0.49% | 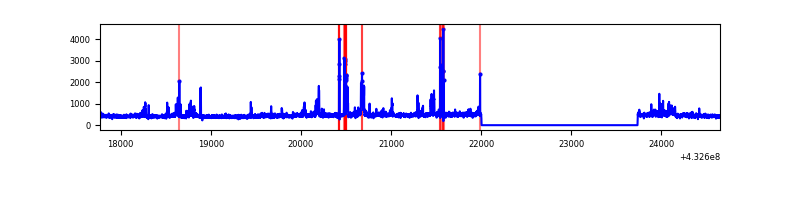 |
| C | 6880 | 5148 | 1 | 1 | 0.01% | 0.02% | 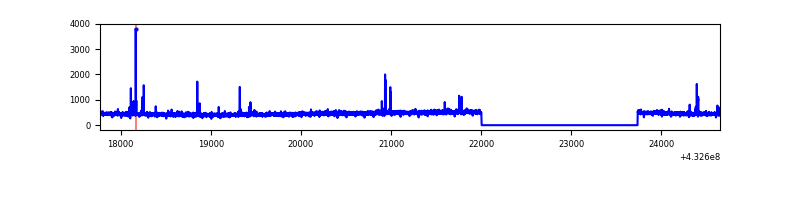 |
| D | 6880 | 5148 | 81 | 81 | 1.18% | 1.57% | 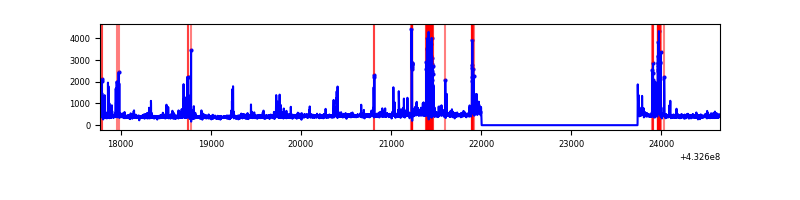 |
Top three noisy pixels from each quadrant. If the there are fewer than three noisy pixels in the level2.evt file, extra rows are filled as -1
| Pixel properties | Quadrant properties | ||||||
|---|---|---|---|---|---|---|---|
| Quadrant | DetID | PixID | Counts | Sigma | Mean | Median | Sigma |
| A | 10 | 83 | 477885 | 4124.77 | 555 | 544 | 115.7 |
| A | 12 | 189 | 260379 | 2245.27 | 555 | 544 | 115.7 |
| A | 15 | 237 | 86323 | 741.23 | 555 | 544 | 115.7 |
| B | 0 | 229 | 219621 | 2063.83 | 548 | 532 | 106.2 |
| B | 5 | 255 | 97421 | 912.7 | 548 | 532 | 106.2 |
| B | 0 | 189 | 40899 | 380.26 | 548 | 532 | 106.2 |
| C | 15 | 214 | 212052 | 1685.85 | 537 | 539 | 125.5 |
| C | 14 | 254 | 35586 | 279.34 | 537 | 539 | 125.5 |
| C | 0 | 207 | 22739 | 176.94 | 537 | 539 | 125.5 |
| D | 1 | 52 | 280436 | 2175.51 | 533 | 516 | 128.7 |
| D | 12 | 6 | 126369 | 978.12 | 533 | 516 | 128.7 |
| D | 12 | 218 | 54715 | 421.23 | 533 | 516 | 128.7 |
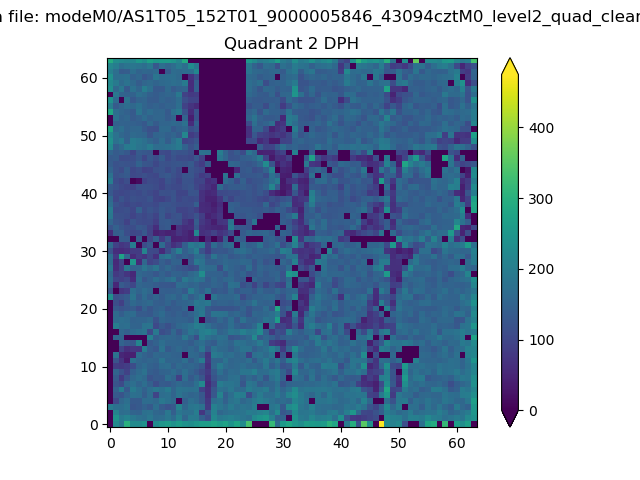
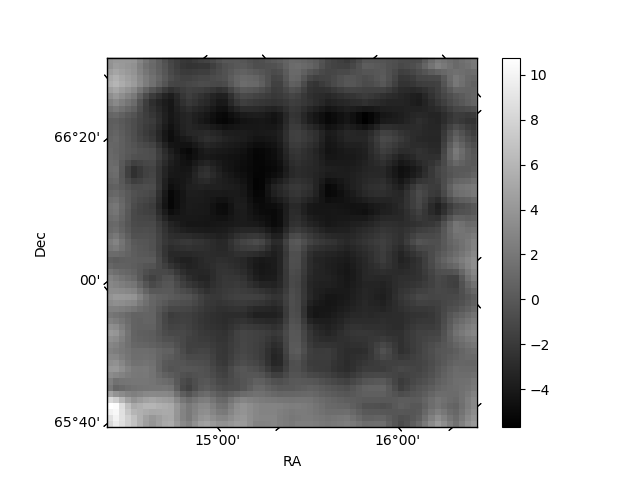
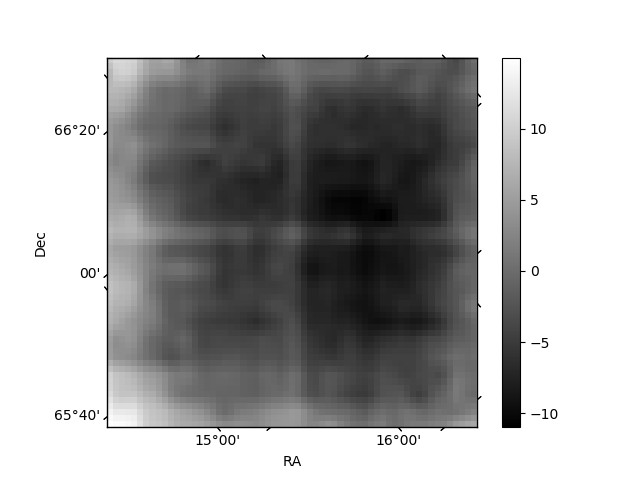
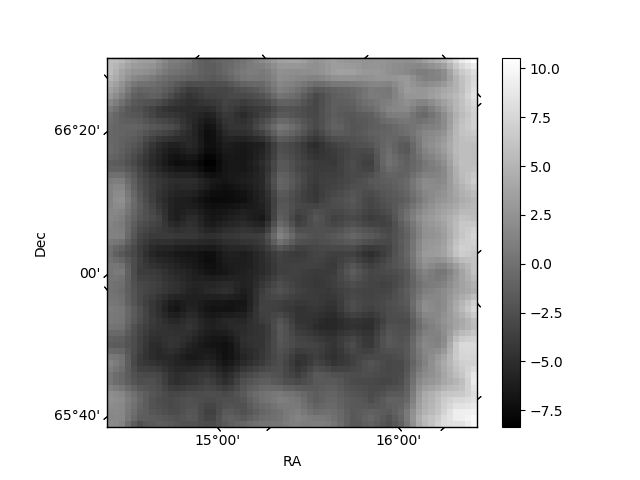
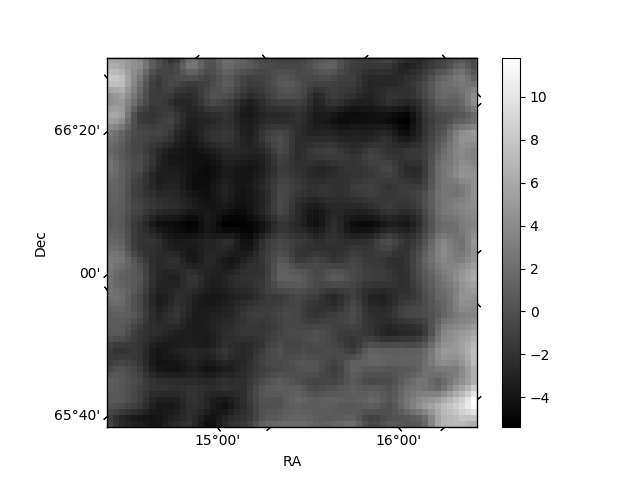
Histogram calculated using DETX and DETY for each event in the final _common_clean file
| Quadrant A |  |
 |
Quadrant B |
|---|---|---|---|
| Quadrant D | 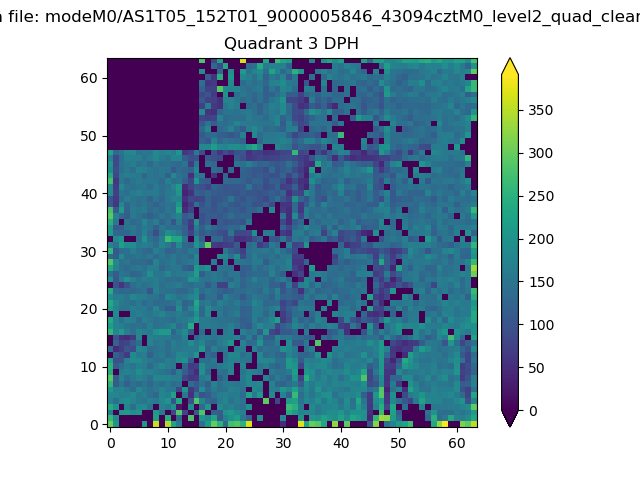 |
 |
Quadrant C |
| Plot type | Count rate plots | Images |
|---|---|---|
| Comparison with Poisson distribution Blue bars denote a histogram of data divided into 1 sec bins. Red curve is a Poisson curve with rate = median count rate of data. |
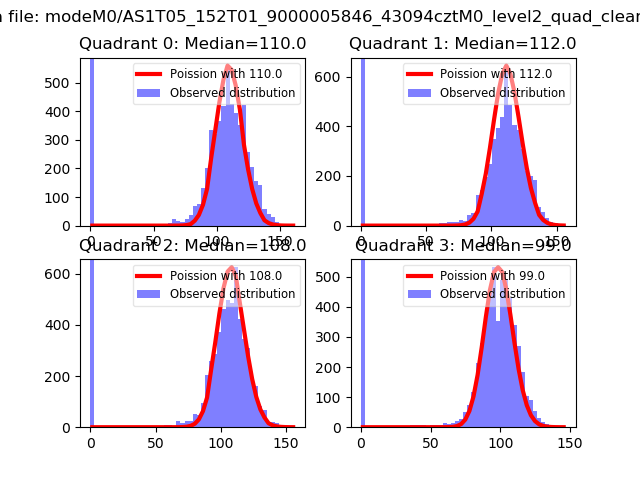 |
 |
| Quadrant-wise count rates Data is divided into 100 sec bins |
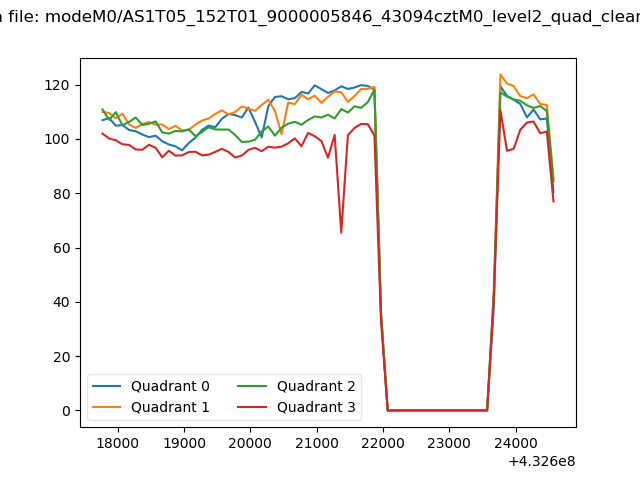 |
|
| Module-wise count rates for Quadrant A Data is divided into 100 sec bins |
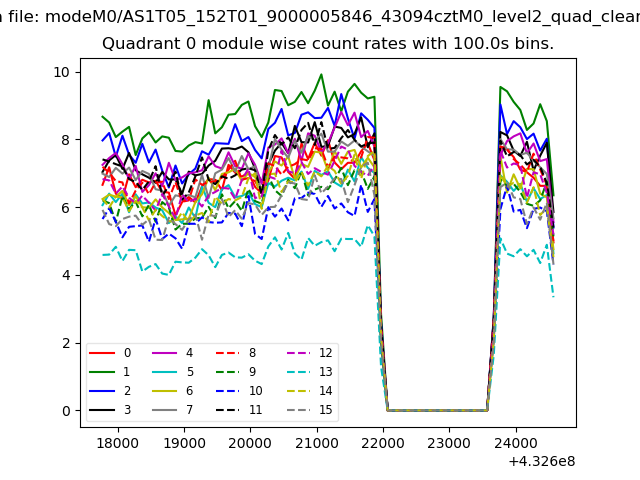 |
 |
| Module-wise count rates for Quadrant B Data is divided into 100 sec bins |
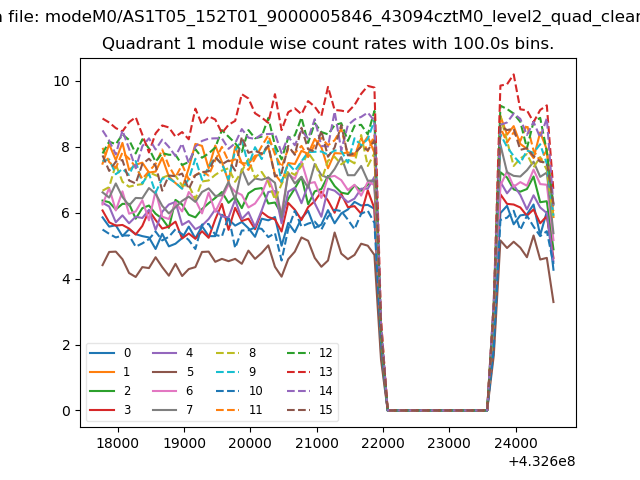 |
 |
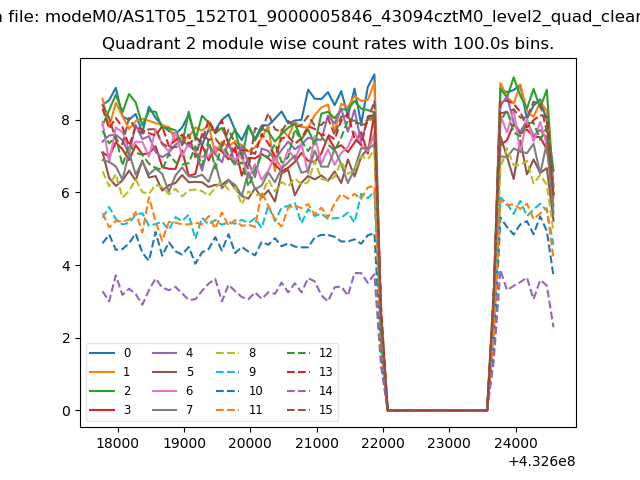
| Module-wise count rates for Quadrant C Data is divided into 100 sec bins |
 |
 |
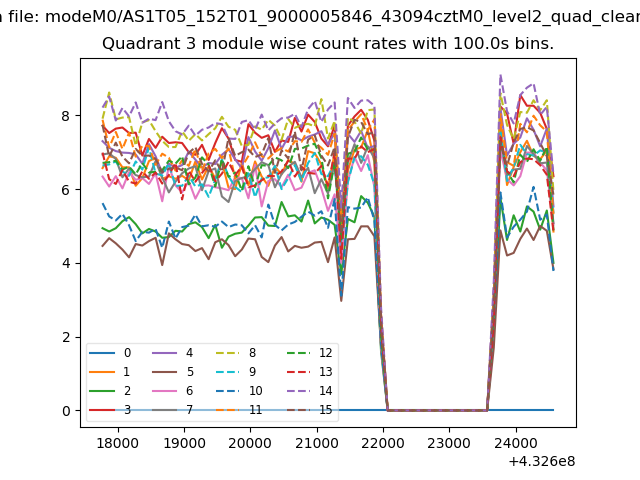
| Module-wise count rates for Quadrant D Data is divided into 100 sec bins |
 |
 |
| Parameter | Plot |
|---|---|
| CZT HV Monitor | 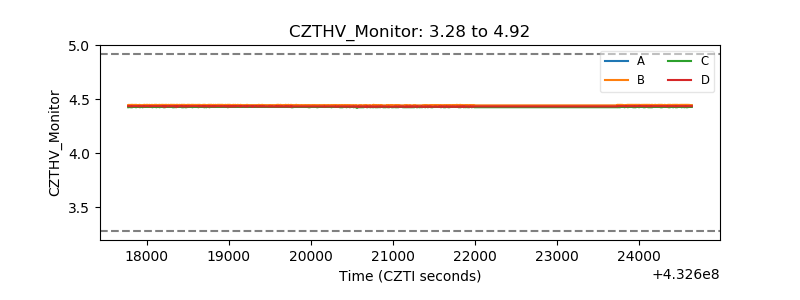 |
| D_VDD | 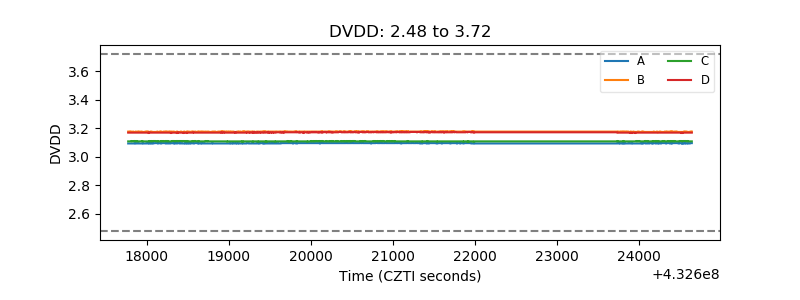 |
| Temperature 1 | 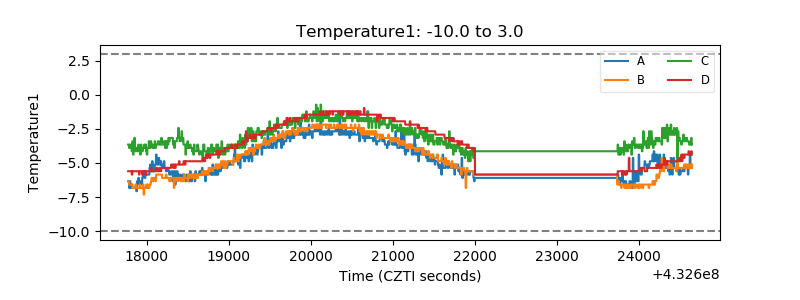 |
| Veto HV Monitor | 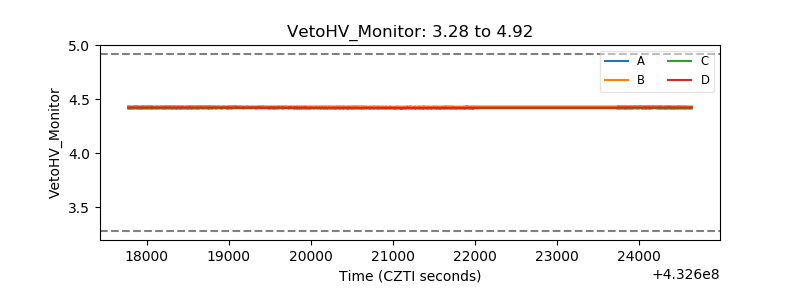 |
| Veto LLD | 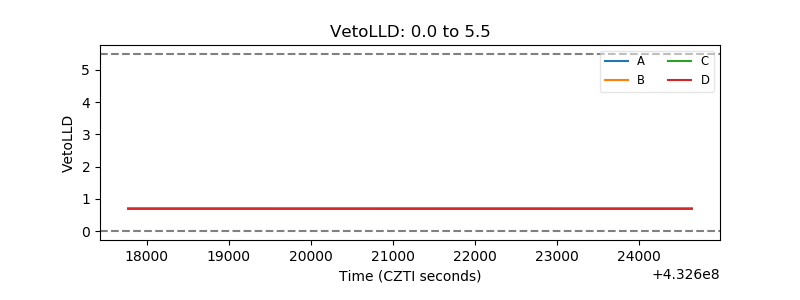 |
| Alpha Counter | 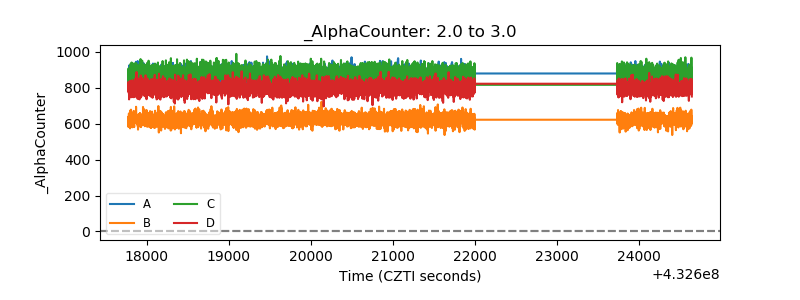 |
| _CPM_Rate | 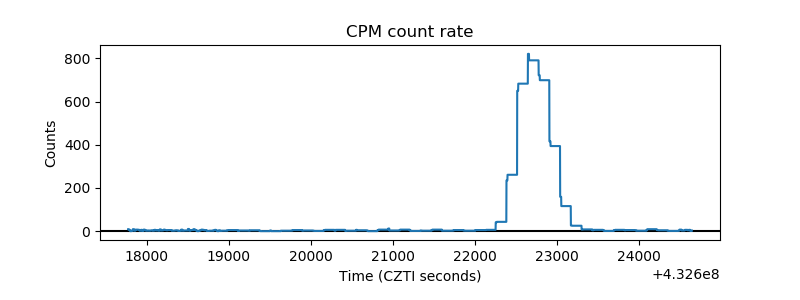 |
| CZT Counter | 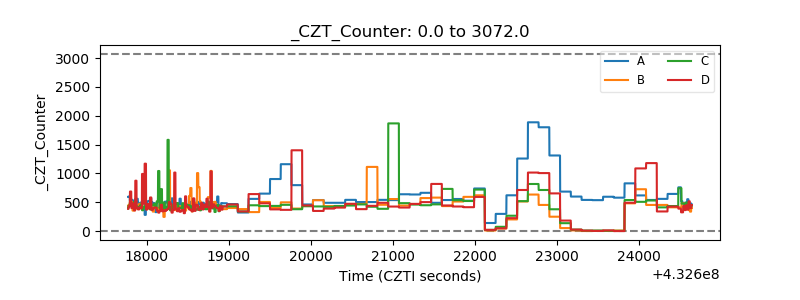 |
| +2.5 Volts monitor | 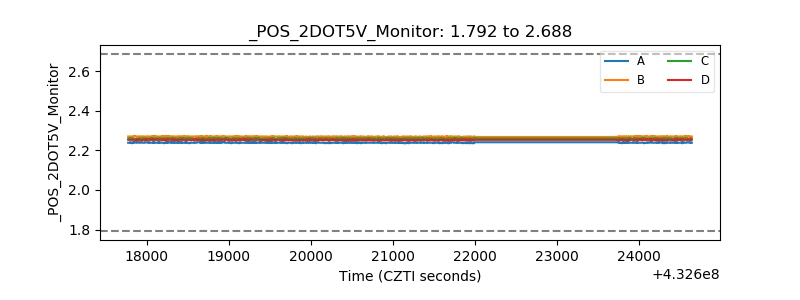 |
| +5 Volts monitor | 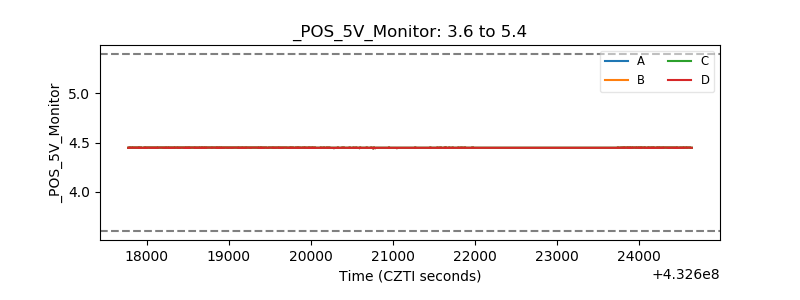 |
| _ROLL_ROT | 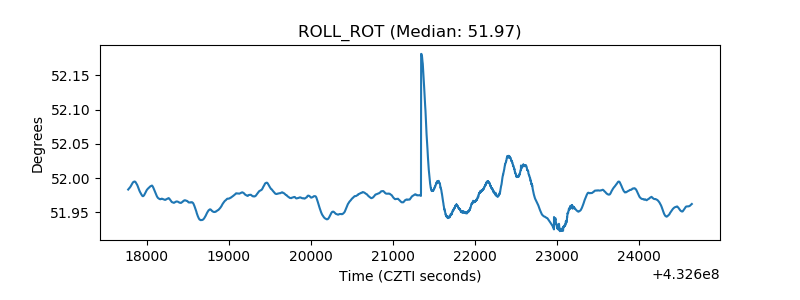 |
| _Roll_DEC | 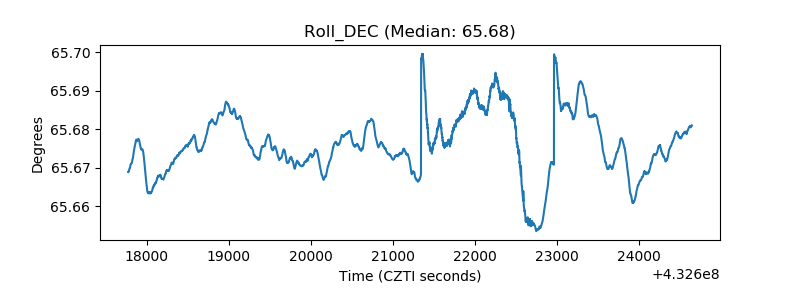 |
| _Roll_RA | 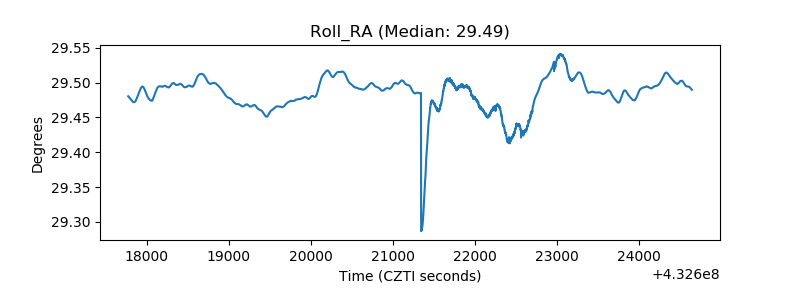 |
| Veto Counter | 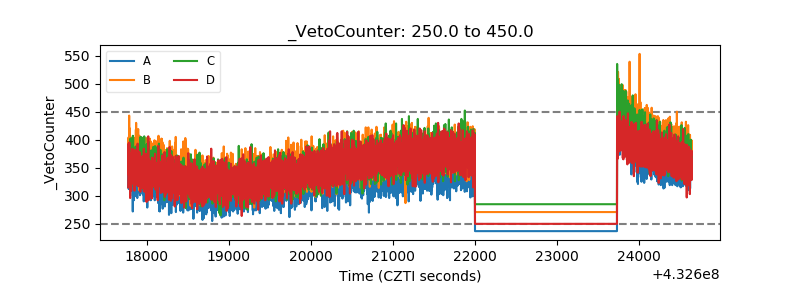 |