| Param | Original file | Final file |
|---|---|---|
| Filename | modeM0/AS1T05_152T01_9000005846_43095cztM0_level2.fits | modeM0/AS1T05_152T01_9000005846_43095cztM0_level2_quad_clean.evt |
| Size (bytes) | 257,906,880 | 72,567,360 |
| Size | 246.0 MB | 69.2 MB |
| Events in quadrant A | 2,681,662 | 478,032 |
| Events in quadrant B | 2,295,728 | 498,711 |
| Events in quadrant C | 2,124,740 | 474,675 |
| Events in quadrant D | 2,103,315 | 438,403 |
| Mode M0 | |||
|---|---|---|---|
| Quadrant | BADHDUFLAG | Total packets | Discarded packets |
| A | 0 | 10487 | 1 |
| B | 0 | 9797 | 1 |
| C | 0 | 9120 | 1 |
| D | 0 | 9487 | 1 |
| Mode SS | |||
|---|---|---|---|
| Quadrant | BADHDUFLAG | Total packets | Discarded packets |
| A | 0 | 90 | 0 |
| B | 0 | 90 | 0 |
| C | 0 | 90 | 0 |
| D | 0 | 90 | 0 |
| Mode M9 | |||
|---|---|---|---|
| Quadrant | BADHDUFLAG | Total packets | Discarded packets |
| A | 0 | 18 | 0 |
| B | 0 | 18 | 0 |
| C | 0 | 18 | 0 |
| D | 0 | 18 | 0 |
| Quadrant | Total seconds | Saturated seconds | Saturation percentage |
|---|---|---|---|
| A | 4369 | 205 | 4.692149% |
| B | 4370 | 65 | 1.487414% |
| C | 4370 | 15 | 0.343249% |
| D | 4370 | 52 | 1.189931% |
Noise dominated data is calculated using 1-second bins in cleaned event files. If a bin has >2000 counts, and if more than 50% of those come from <1% of pixels, then it is considered to be noise-dominated and hence unusable.
| Quadrant | # 1 sec bins | Bins with >0 counts | Bins with >2000 counts | High rate bins dominated by noise | Noise dominated (total time) | Noise dominated (detector-on time) | Marked lightcurve |
|---|---|---|---|---|---|---|---|
| A | 4369 | 4369 | 105 | 105 | 2.40% | 2.40% | 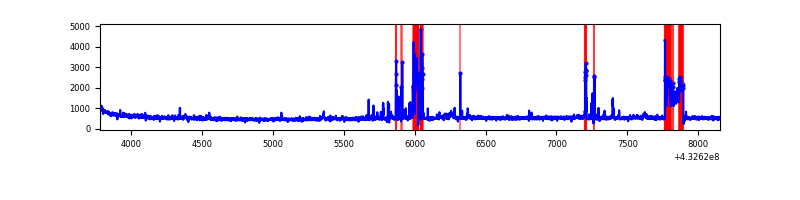 |
| B | 4370 | 4370 | 44 | 44 | 1.01% | 1.01% | 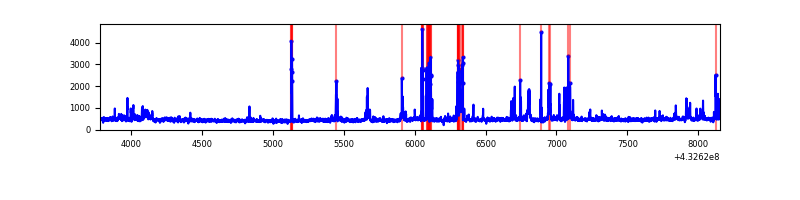 |
| C | 4370 | 4370 | 20 | 20 | 0.46% | 0.46% | 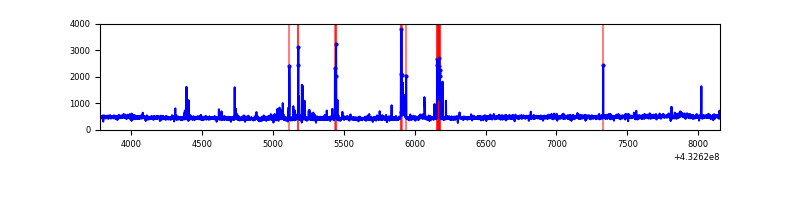 |
| D | 4370 | 4370 | 52 | 52 | 1.19% | 1.19% | 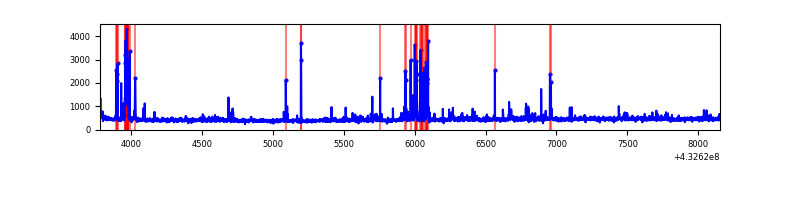 |
Top three noisy pixels from each quadrant. If the there are fewer than three noisy pixels in the level2.evt file, extra rows are filled as -1
| Pixel properties | Quadrant properties | ||||||
|---|---|---|---|---|---|---|---|
| Quadrant | DetID | PixID | Counts | Sigma | Mean | Median | Sigma |
| A | 15 | 237 | 455290 | 4764.86 | 460 | 451 | 95.5 |
| A | 10 | 83 | 376194 | 3936.26 | 460 | 451 | 95.5 |
| A | 12 | 189 | 63879 | 664.47 | 460 | 451 | 95.5 |
| B | 0 | 229 | 394229 | 4332.8 | 469 | 457 | 90.9 |
| B | 0 | 189 | 31927 | 346.27 | 469 | 457 | 90.9 |
| B | 12 | 111 | 11251 | 118.77 | 469 | 457 | 90.9 |
| C | 15 | 214 | 179928 | 1654.03 | 462 | 464 | 108.5 |
| C | 14 | 254 | 133990 | 1230.64 | 462 | 464 | 108.5 |
| C | 0 | 207 | 8966 | 78.36 | 462 | 464 | 108.5 |
| D | 12 | 6 | 89761 | 784.65 | 463 | 448 | 113.8 |
| D | 15 | 0 | 74813 | 653.33 | 463 | 448 | 113.8 |
| D | 1 | 52 | 70416 | 614.7 | 463 | 448 | 113.8 |
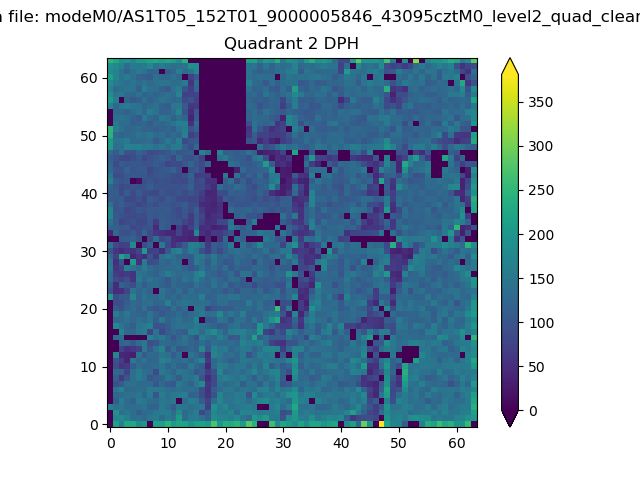
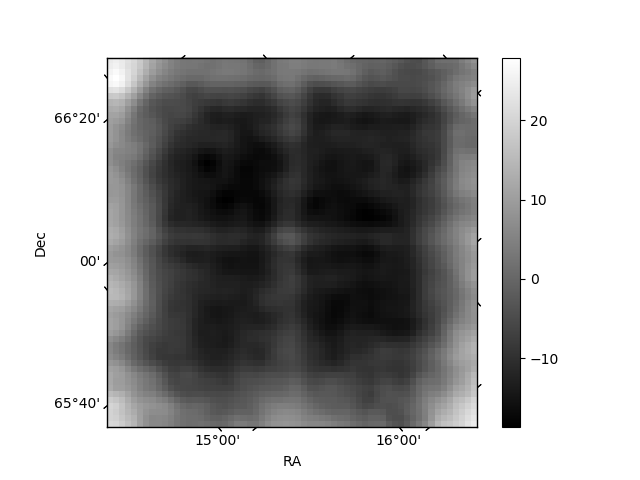
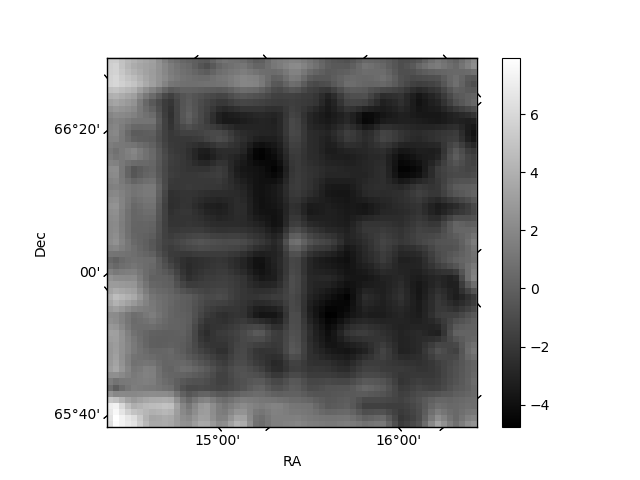
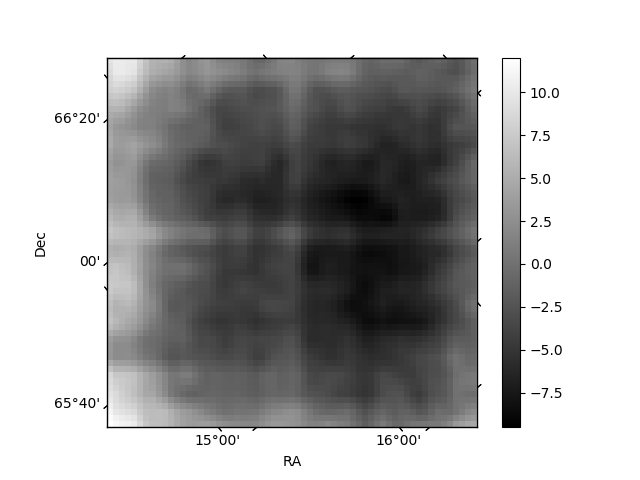
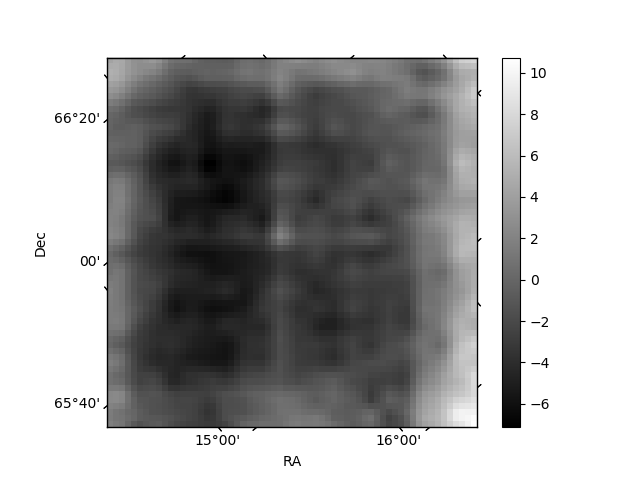
Histogram calculated using DETX and DETY for each event in the final _common_clean file
| Quadrant A | 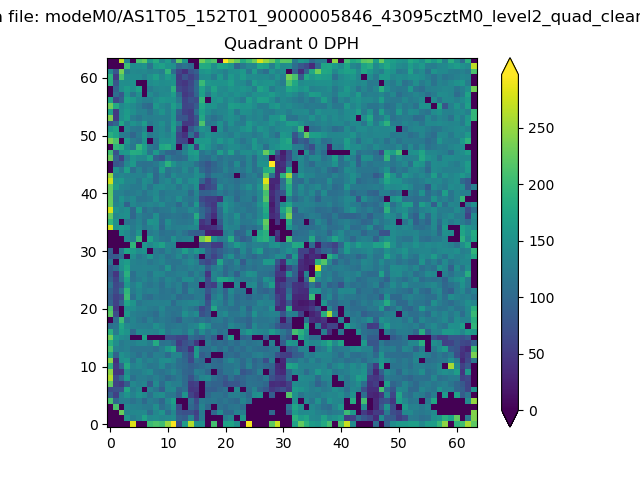 |
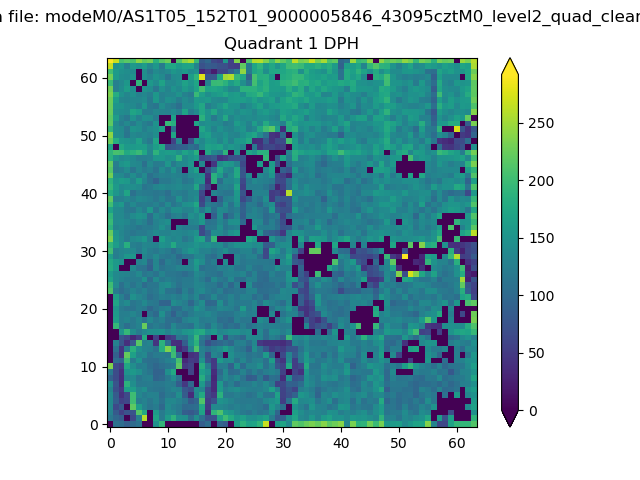 |
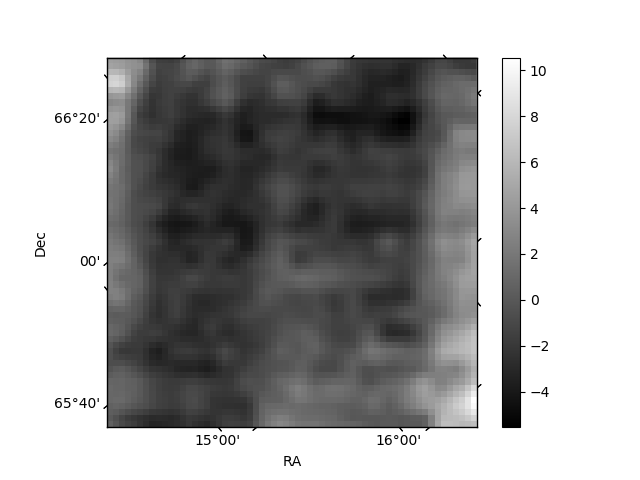
Quadrant B |
|---|---|---|---|
| Quadrant D | 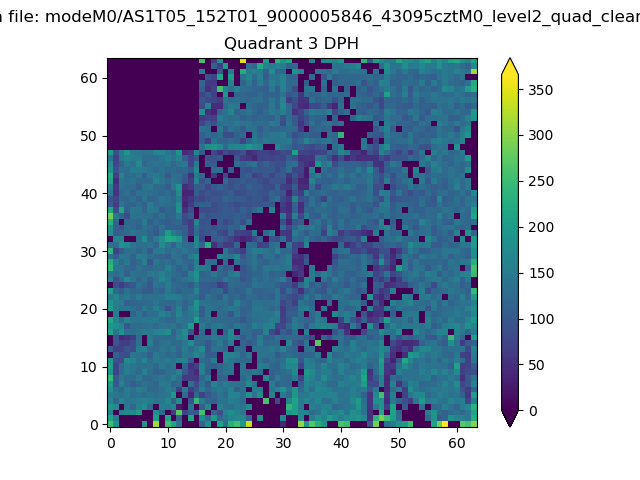 |
 |
Quadrant C |
| Plot type | Count rate plots | Images |
|---|---|---|
| Comparison with Poisson distribution Blue bars denote a histogram of data divided into 1 sec bins. Red curve is a Poisson curve with rate = median count rate of data. |
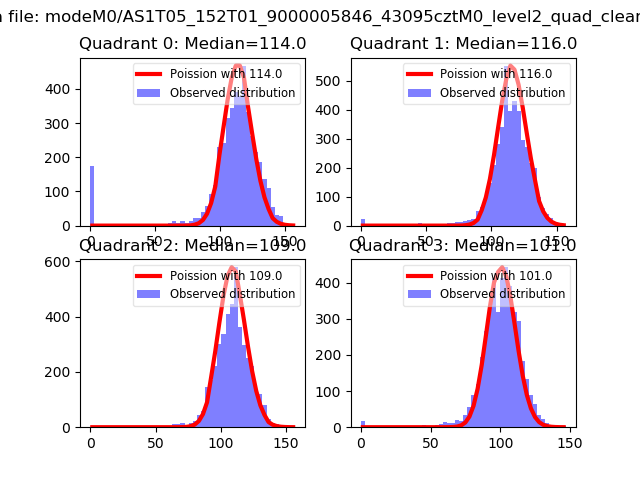 |
 |
| Quadrant-wise count rates Data is divided into 100 sec bins |
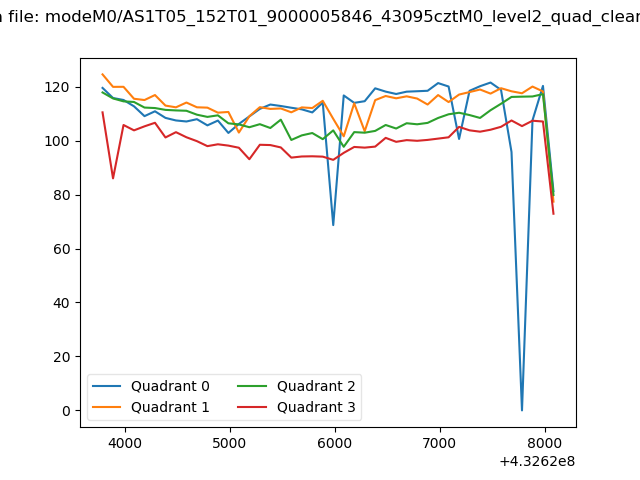 |
|
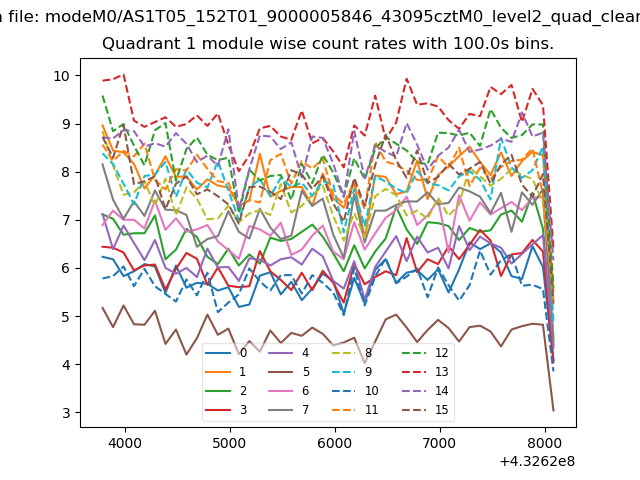
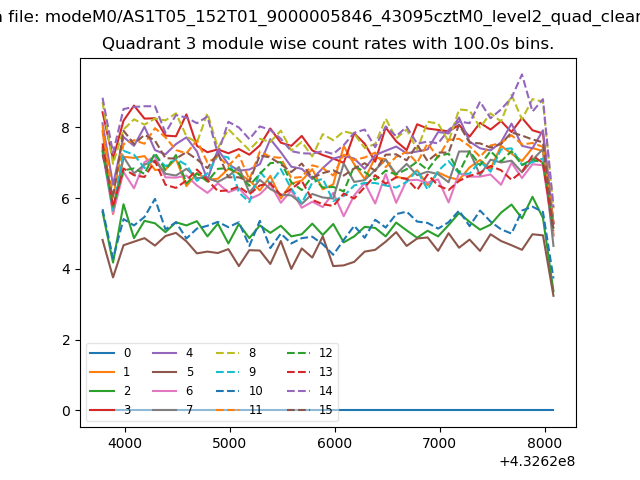
| Module-wise count rates for Quadrant A Data is divided into 100 sec bins |
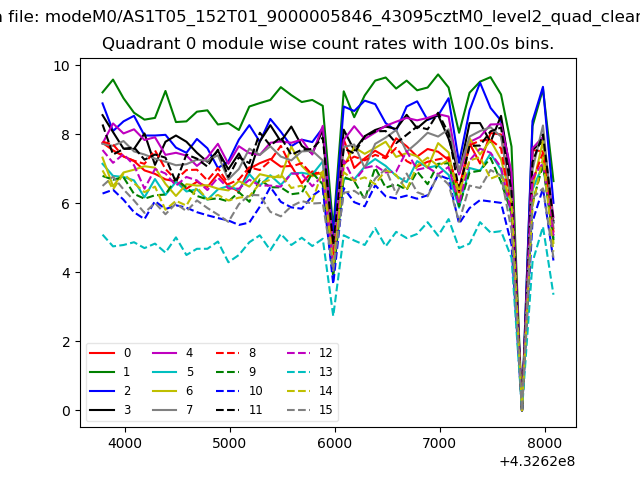 |
 |
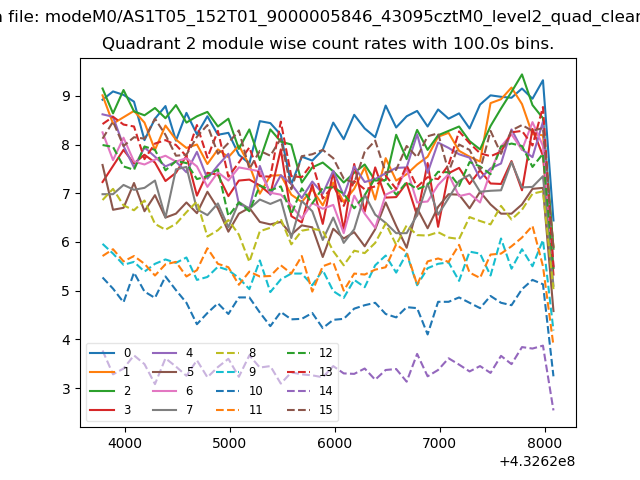
| Module-wise count rates for Quadrant B Data is divided into 100 sec bins |
 |
 |
| Module-wise count rates for Quadrant C Data is divided into 100 sec bins |
 |
 |
| Module-wise count rates for Quadrant D Data is divided into 100 sec bins |
 |
 |
| Parameter | Plot |
|---|---|
| CZT HV Monitor | 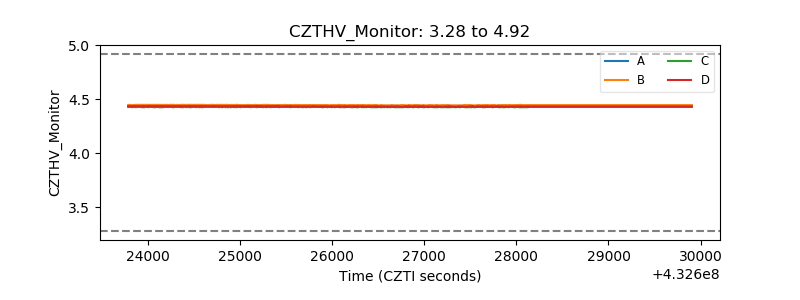 |
| D_VDD | 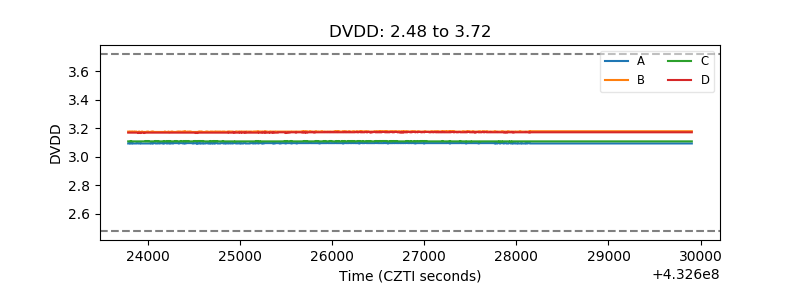 |
| Temperature 1 | 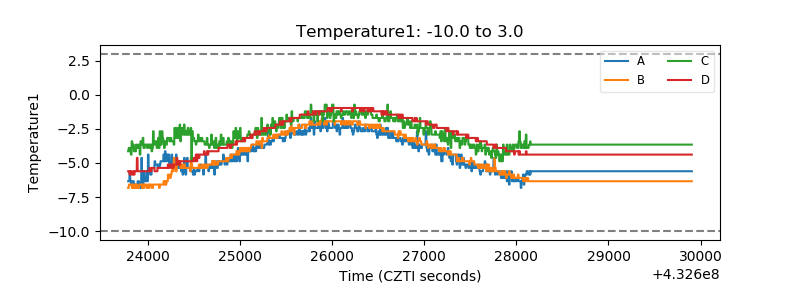 |
| Veto HV Monitor | 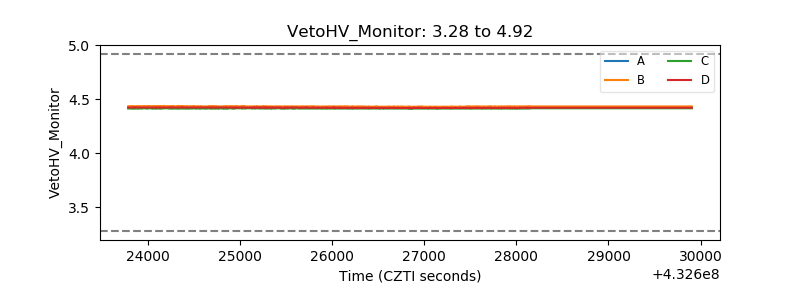 |
| Veto LLD | 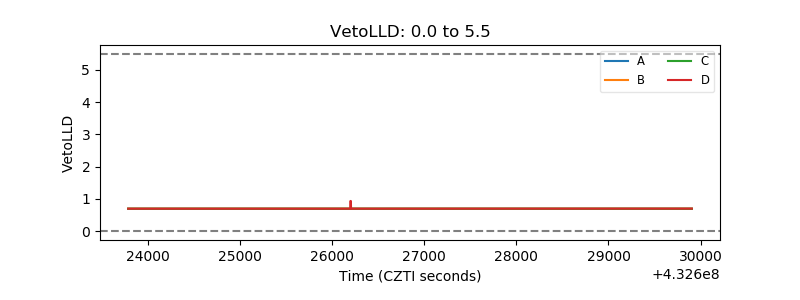 |
| Alpha Counter | 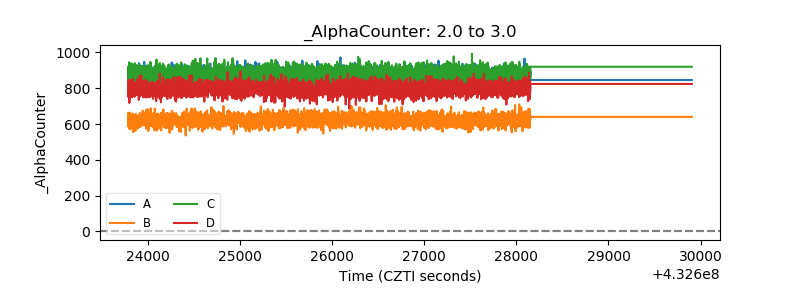 |
| _CPM_Rate | 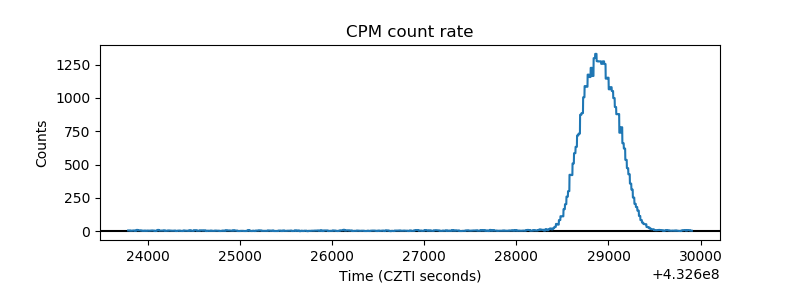 |
| CZT Counter | 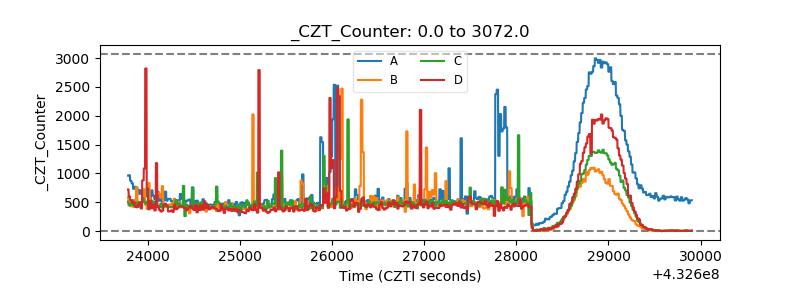 |
| +2.5 Volts monitor | 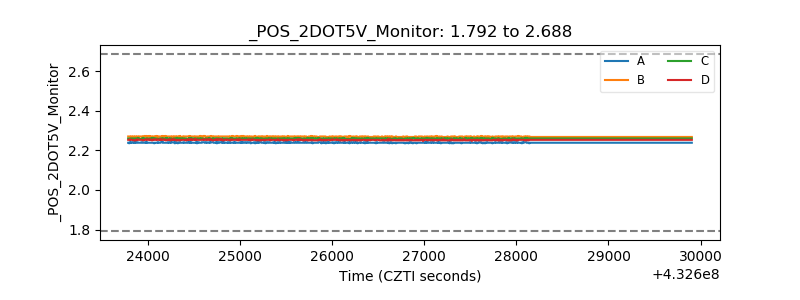 |
| +5 Volts monitor | 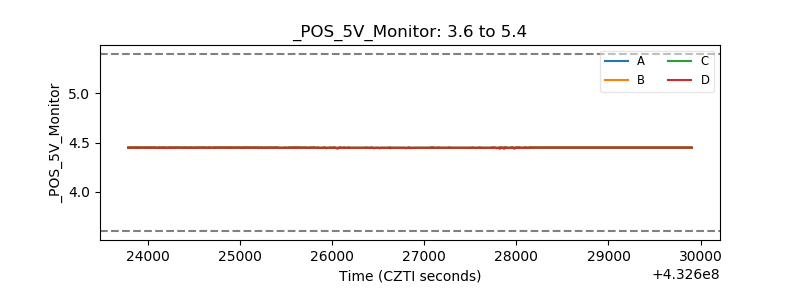 |
| _ROLL_ROT | 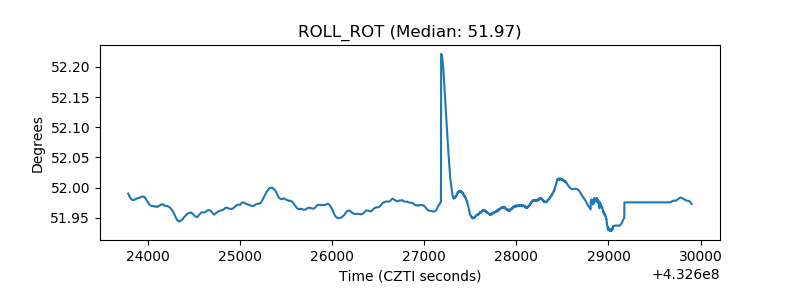 |
| _Roll_DEC | 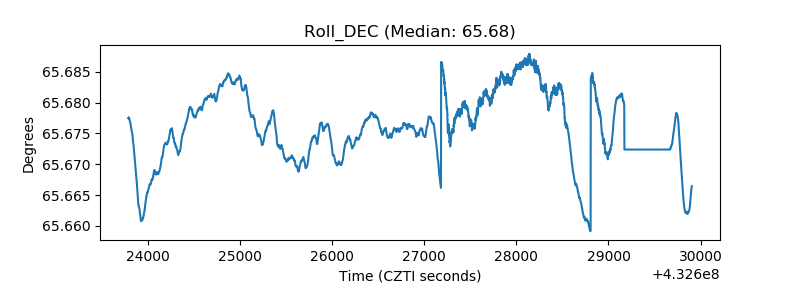 |
| _Roll_RA | 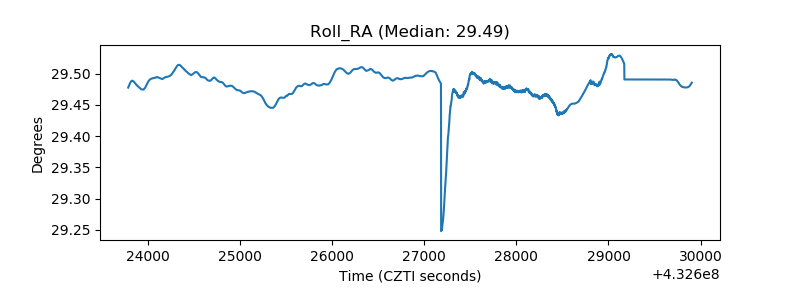 |
| Veto Counter | 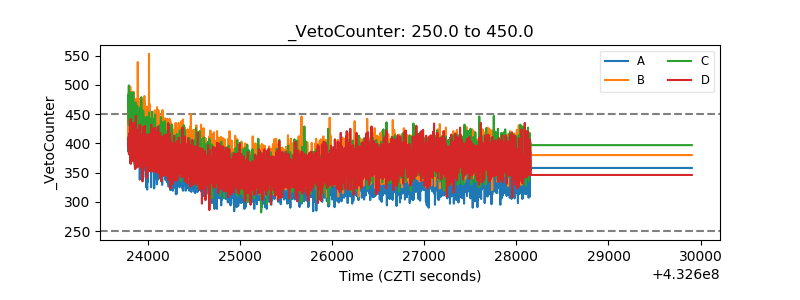 |