| Param | Original file | Final file |
|---|---|---|
| Filename | modeM0/AS1T05_153T01_9000005848_43095cztM0_level2.fits | modeM0/AS1T05_153T01_9000005848_43095cztM0_level2_quad_clean.evt |
| Size (bytes) | 45,984,960 | 10,523,520 |
| Size | 43.9 MB | 10.0 MB |
| Events in quadrant A | 760,517 | 55,159 |
| Events in quadrant B | 311,244 | 75,528 |
| Events in quadrant C | 283,522 | 72,214 |
| Events in quadrant D | 297,041 | 66,545 |
| Mode SS | |||
|---|---|---|---|
| Quadrant | BADHDUFLAG | Total packets | Discarded packets |
| A | 0 | 12 | 0 |
| B | 0 | 12 | 0 |
| C | 0 | 12 | 0 |
| D | 0 | 12 | 0 |
| Mode M0 | |||
|---|---|---|---|
| Quadrant | BADHDUFLAG | Total packets | Discarded packets |
| A | 0 | 2692 | 0 |
| B | 0 | 1307 | 0 |
| C | 0 | 1211 | 0 |
| D | 0 | 1301 | 0 |
| Quadrant | Total seconds | Saturated seconds | Saturation percentage |
|---|---|---|---|
| A | 598 | 165 | 27.591973% |
| B | 598 | 7 | 1.170569% |
| C | 598 | 0 | 0.000000% |
| D | 598 | 4 | 0.668896% |
Noise dominated data is calculated using 1-second bins in cleaned event files. If a bin has >2000 counts, and if more than 50% of those come from <1% of pixels, then it is considered to be noise-dominated and hence unusable.
| Quadrant | # 1 sec bins | Bins with >0 counts | Bins with >2000 counts | High rate bins dominated by noise | Noise dominated (total time) | Noise dominated (detector-on time) | Marked lightcurve |
|---|---|---|---|---|---|---|---|
| A | 598 | 598 | 140 | 140 | 23.41% | 23.41% | 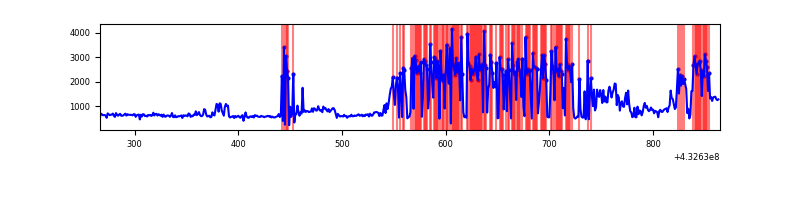 |
| B | 598 | 598 | 3 | 3 | 0.50% | 0.50% | 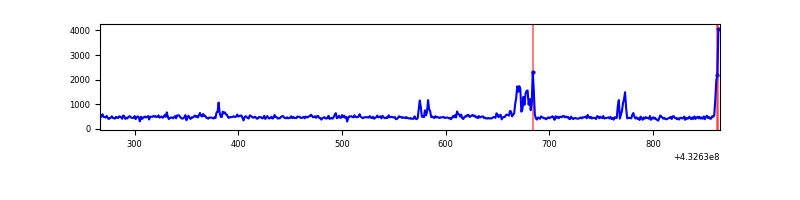 |
| C | 598 | 598 | 0 | 0 | 0.00% | 0.00% | 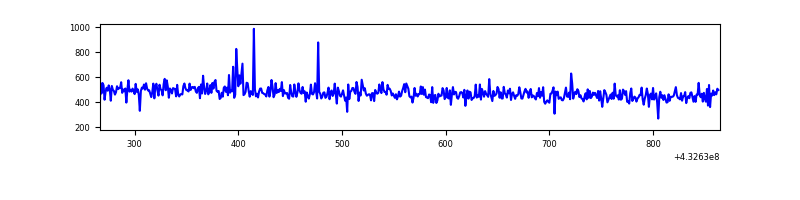 |
| D | 598 | 598 | 2 | 2 | 0.33% | 0.33% | 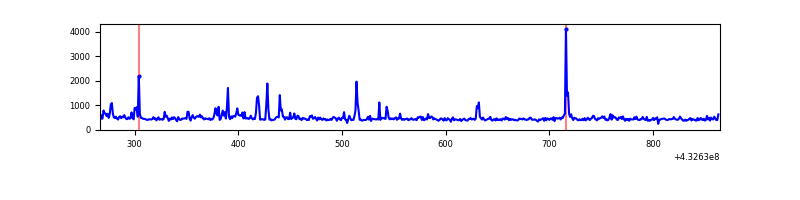 |
Top three noisy pixels from each quadrant. If the there are fewer than three noisy pixels in the level2.evt file, extra rows are filled as -1
| Pixel properties | Quadrant properties | ||||||
|---|---|---|---|---|---|---|---|
| Quadrant | DetID | PixID | Counts | Sigma | Mean | Median | Sigma |
| A | 15 | 237 | 465550 | 31990.62 | 61 | 60 | 14.6 |
| A | 10 | 83 | 56712 | 3893.39 | 61 | 60 | 14.6 |
| A | 12 | 189 | 940 | 60.48 | 61 | 60 | 14.6 |
| B | 0 | 229 | 37966 | 2435.72 | 68 | 66 | 15.6 |
| B | 3 | 112 | 4051 | 256.1 | 68 | 66 | 15.6 |
| B | 12 | 111 | 1755 | 108.55 | 68 | 66 | 15.6 |
| C | 15 | 214 | 26525 | 1582.12 | 65 | 65 | 16.7 |
| C | 14 | 254 | 2443 | 142.19 | 65 | 65 | 16.7 |
| C | 2 | 16 | 637 | 34.2 | 65 | 65 | 16.7 |
| D | 1 | 52 | 25804 | 1449.23 | 65 | 63 | 17.8 |
| D | 2 | 249 | 22425 | 1258.99 | 65 | 63 | 17.8 |
| D | 2 | 234 | 2721 | 149.65 | 65 | 63 | 17.8 |
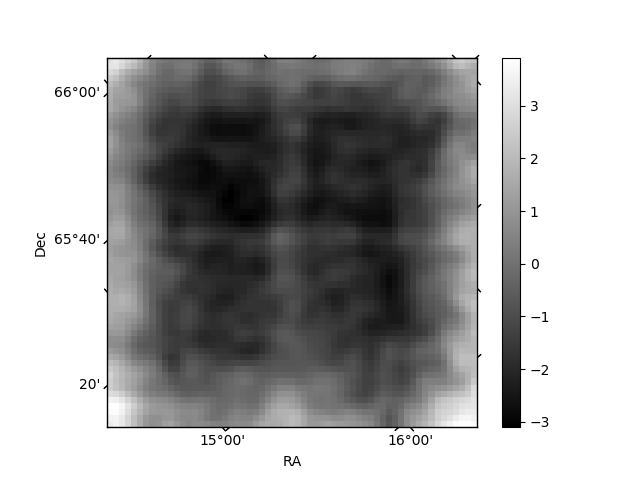
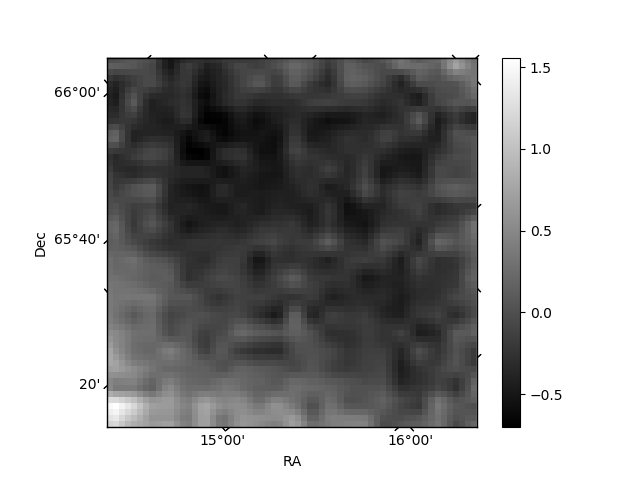
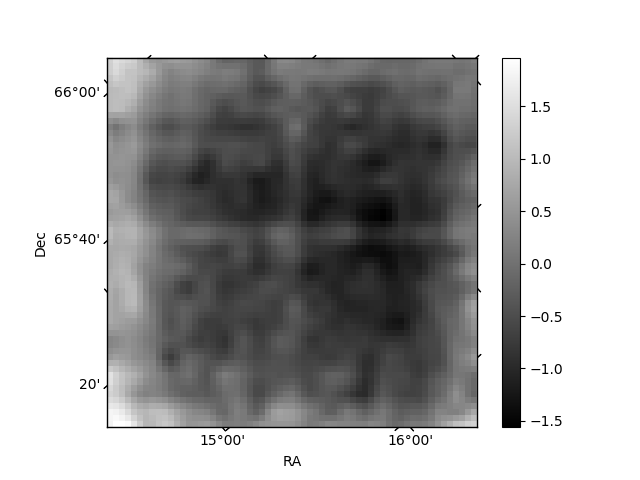
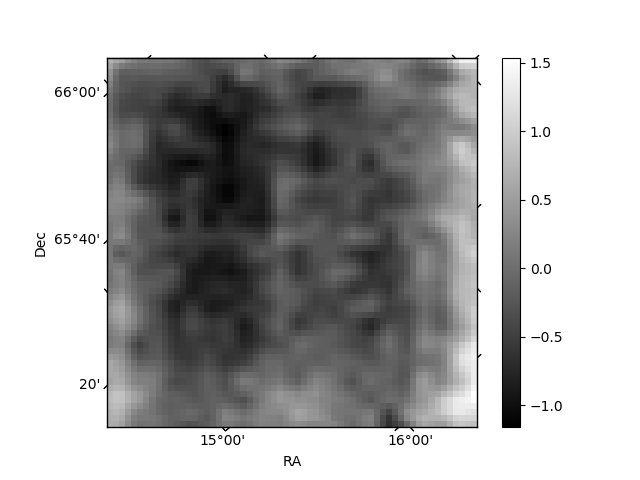
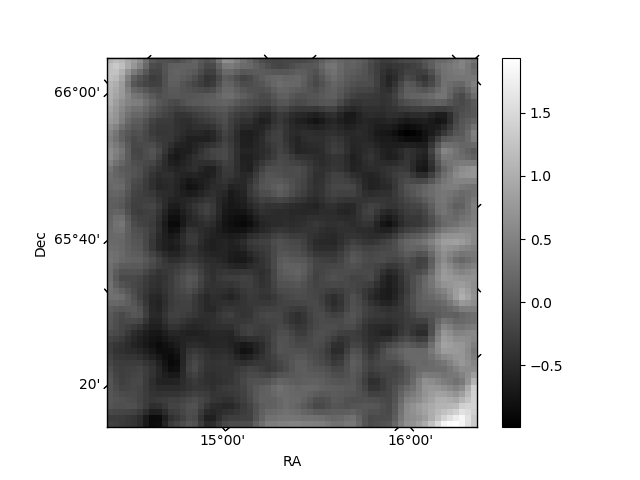
Histogram calculated using DETX and DETY for each event in the final _common_clean file
| Quadrant A | 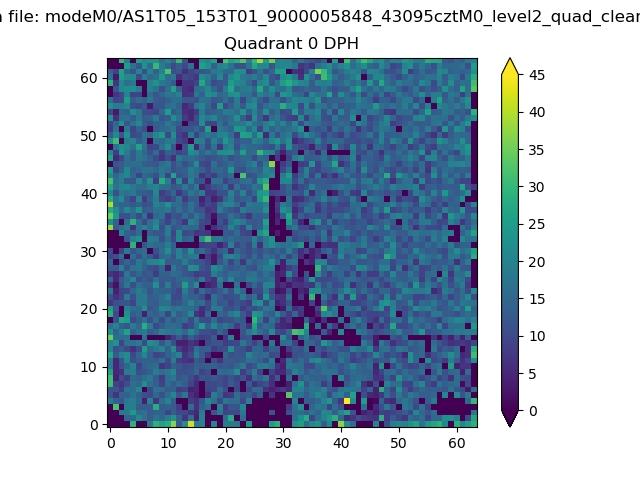 |
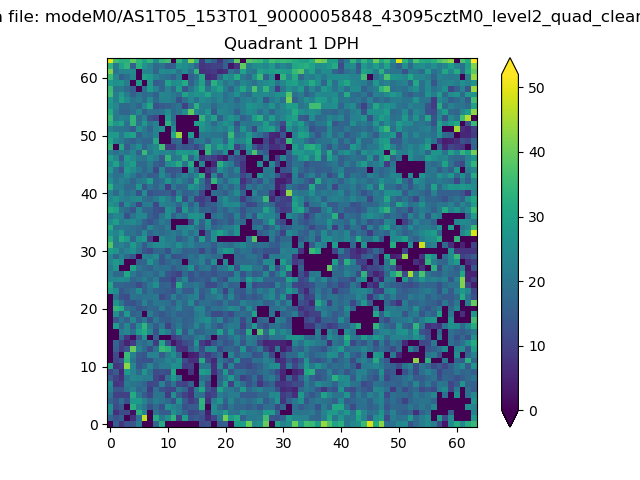 |
Quadrant B |
|---|---|---|---|
| Quadrant D | 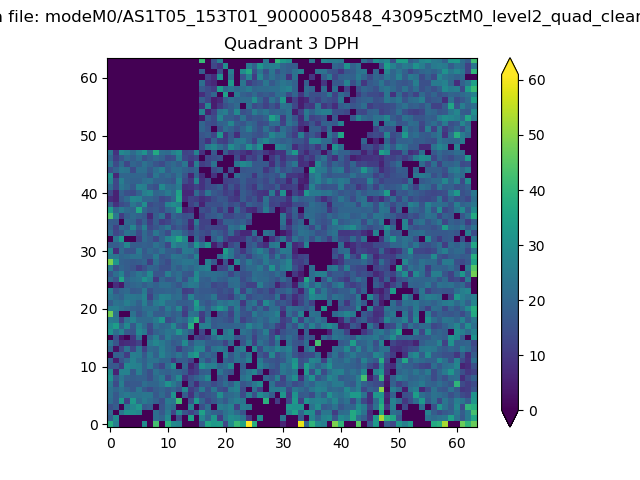 |
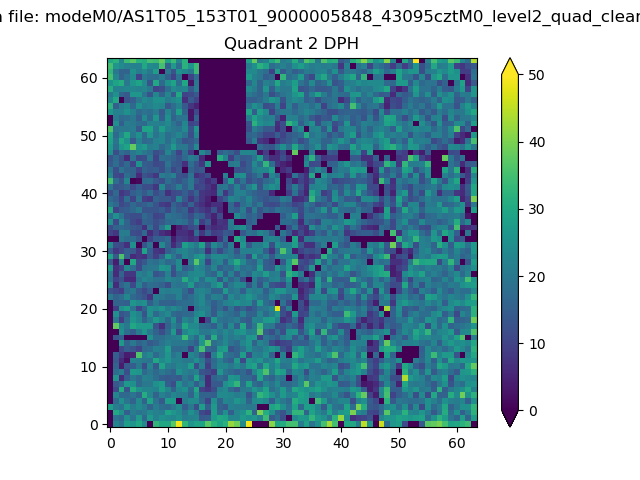 |
Quadrant C |
| Plot type | Count rate plots | Images |
|---|---|---|
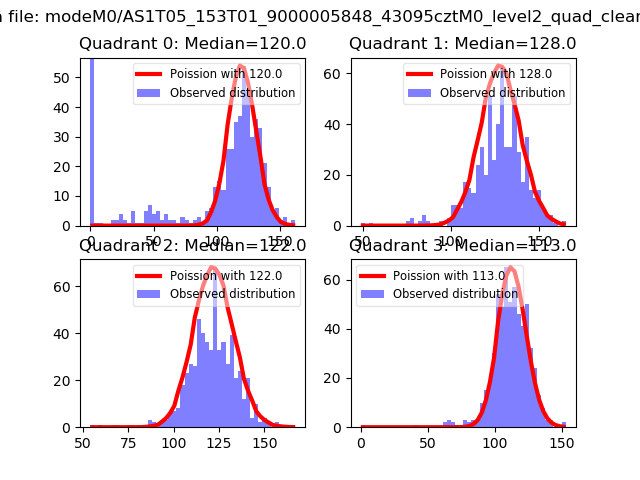
| Comparison with Poisson distribution Blue bars denote a histogram of data divided into 1 sec bins. Red curve is a Poisson curve with rate = median count rate of data. |
 |
 |
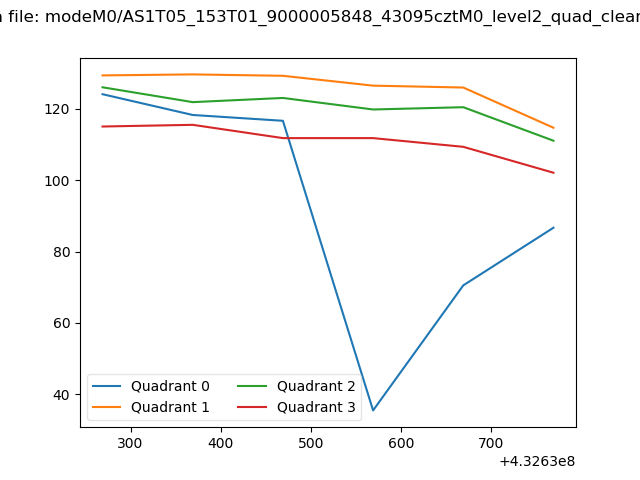
| Quadrant-wise count rates Data is divided into 100 sec bins |
 |
|
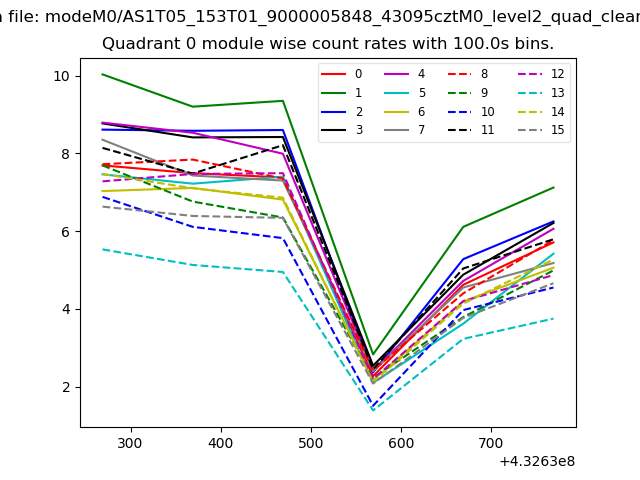
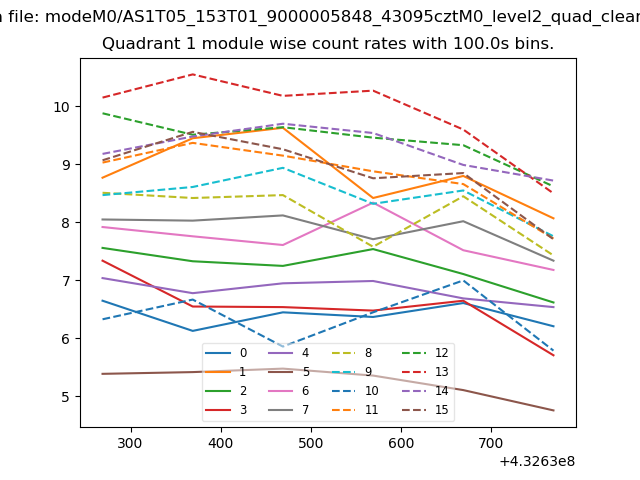
| Module-wise count rates for Quadrant A Data is divided into 100 sec bins |
 |
 |
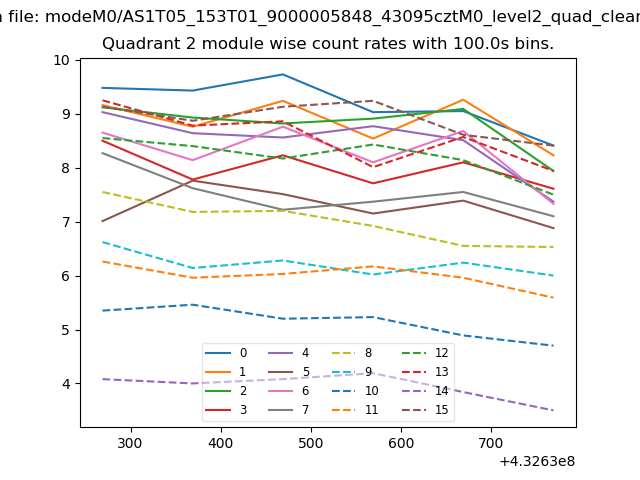
| Module-wise count rates for Quadrant B Data is divided into 100 sec bins |
 |
 |
| Module-wise count rates for Quadrant C Data is divided into 100 sec bins |
 |
 |
| Module-wise count rates for Quadrant D Data is divided into 100 sec bins |
 |
 |
| Parameter | Plot |
|---|---|
| CZT HV Monitor | 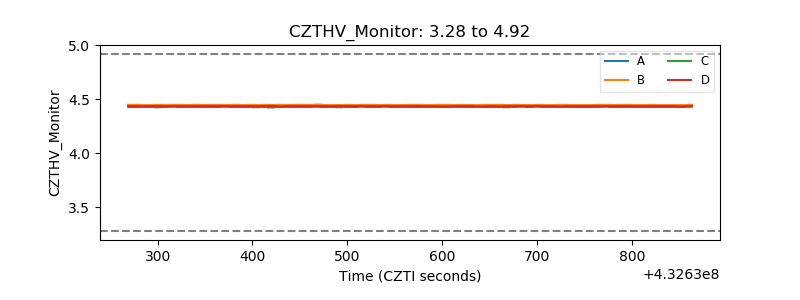 |
| D_VDD | 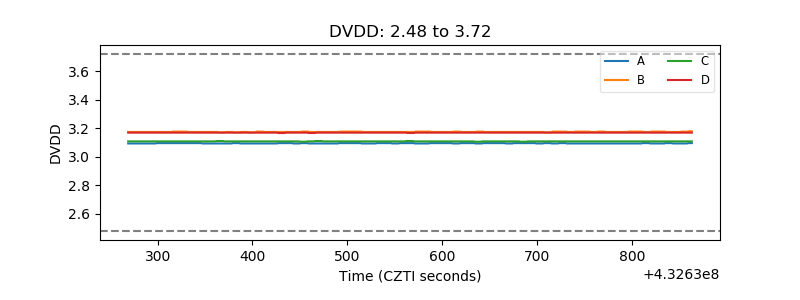 |
| Temperature 1 | 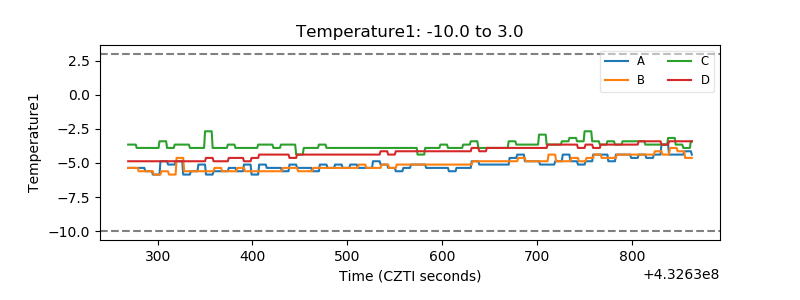 |
| Veto HV Monitor | 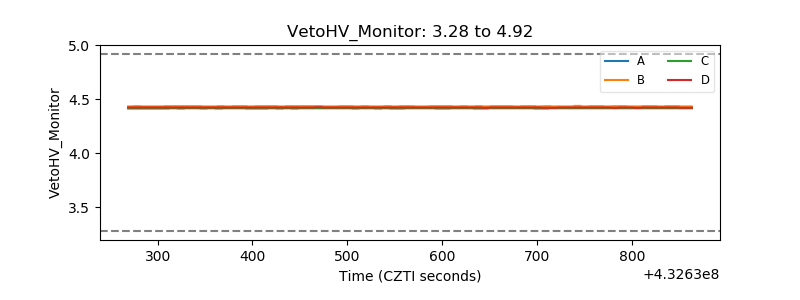 |
| Veto LLD | 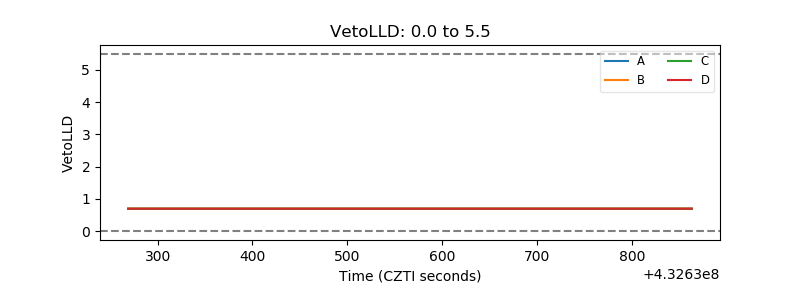 |
| Alpha Counter | 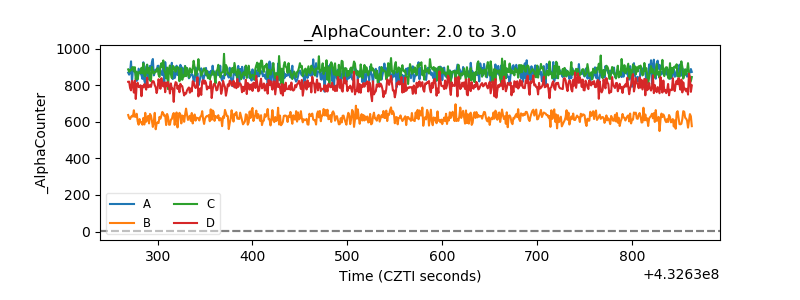 |
| _CPM_Rate | 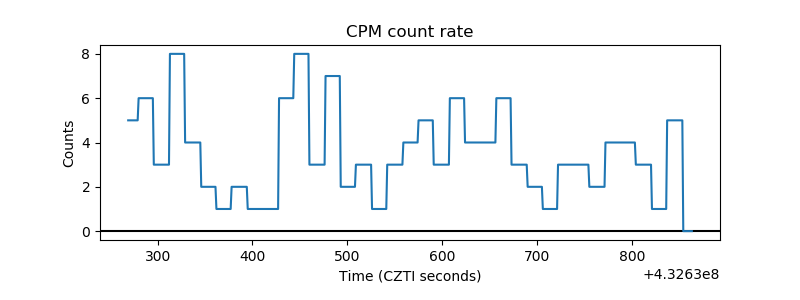 |
| CZT Counter | 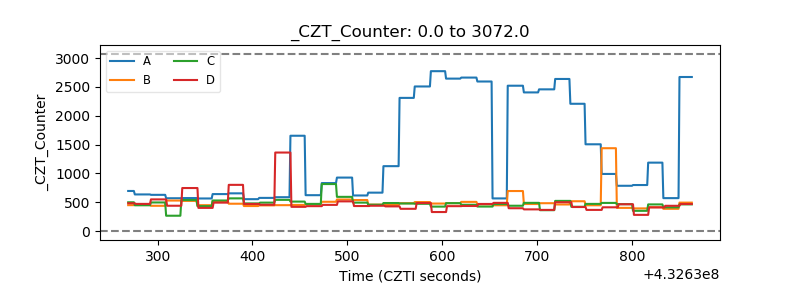 |
| +2.5 Volts monitor | 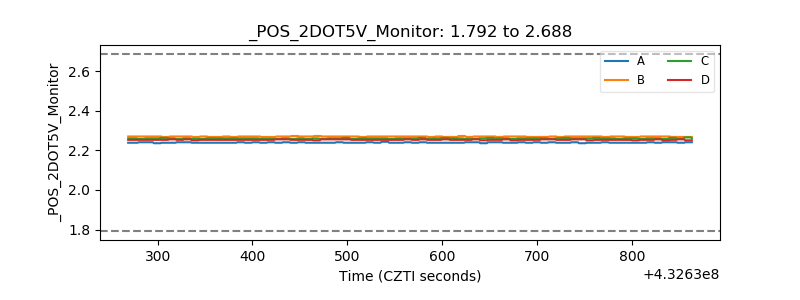 |
| +5 Volts monitor | 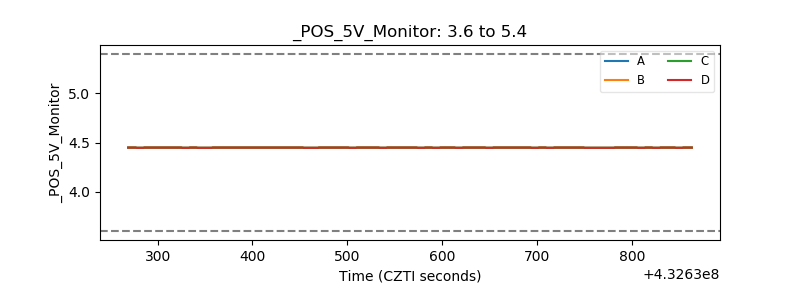 |
| _ROLL_ROT | 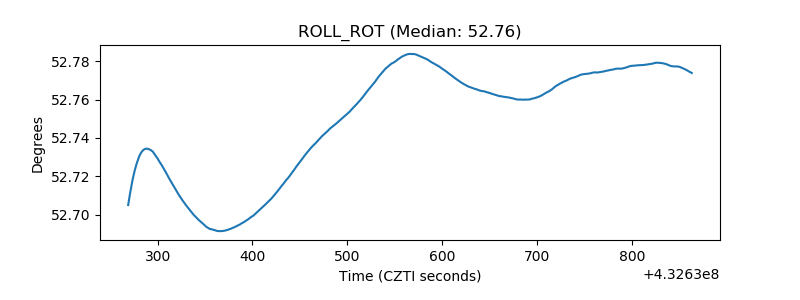 |
| _Roll_DEC | 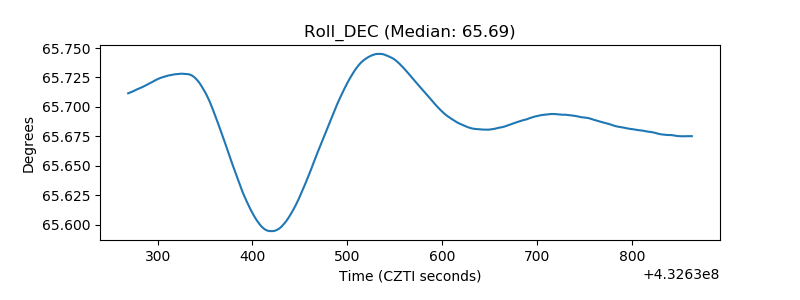 |
| _Roll_RA | 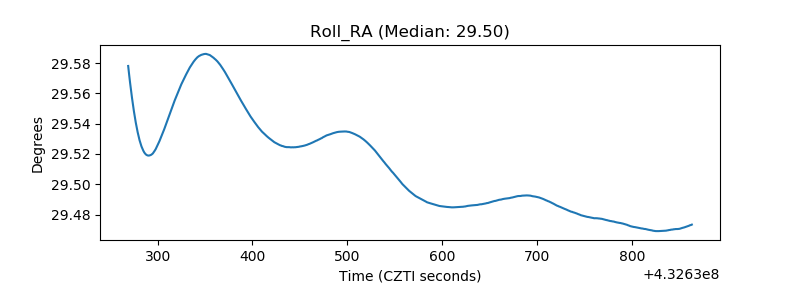 |
| Veto Counter | 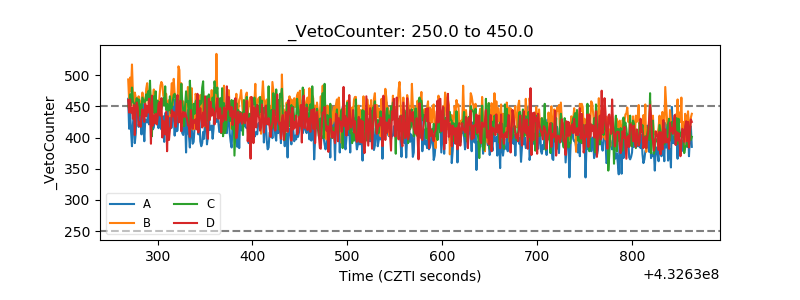 |