| Param | Original file | Final file |
|---|---|---|
| Filename | modeM0/AS1T05_153T01_9000005848_43096cztM0_level2.fits | modeM0/AS1T05_153T01_9000005848_43096cztM0_level2_quad_clean.evt |
| Size (bytes) | 334,512,000 | 84,064,320 |
| Size | 319.0 MB | 80.2 MB |
| Events in quadrant A | 3,647,445 | 554,852 |
| Events in quadrant B | 3,108,703 | 583,168 |
| Events in quadrant C | 2,452,317 | 557,042 |
| Events in quadrant D | 2,797,140 | 511,261 |
| Mode SS | |||
|---|---|---|---|
| Quadrant | BADHDUFLAG | Total packets | Discarded packets |
| A | 0 | 98 | 0 |
| B | 0 | 98 | 0 |
| C | 0 | 98 | 0 |
| D | 0 | 98 | 0 |
| Mode M9 | |||
|---|---|---|---|
| Quadrant | BADHDUFLAG | Total packets | Discarded packets |
| A | 0 | 20 | 0 |
| B | 0 | 20 | 0 |
| C | 0 | 20 | 0 |
| D | 0 | 20 | 0 |
| Mode M0 | |||
|---|---|---|---|
| Quadrant | BADHDUFLAG | Total packets | Discarded packets |
| A | 0 | 13823 | 1 |
| B | 0 | 12350 | 1 |
| C | 0 | 10252 | 1 |
| D | 0 | 11625 | 1 |
| Quadrant | Total seconds | Saturated seconds | Saturation percentage |
|---|---|---|---|
| A | 4836 | 337 | 6.968569% |
| B | 4836 | 171 | 3.535980% |
| C | 4836 | 13 | 0.268817% |
| D | 4836 | 115 | 2.377998% |
Noise dominated data is calculated using 1-second bins in cleaned event files. If a bin has >2000 counts, and if more than 50% of those come from <1% of pixels, then it is considered to be noise-dominated and hence unusable.
| Quadrant | # 1 sec bins | Bins with >0 counts | Bins with >2000 counts | High rate bins dominated by noise | Noise dominated (total time) | Noise dominated (detector-on time) | Marked lightcurve |
|---|---|---|---|---|---|---|---|
| A | 6839 | 4837 | 269 | 269 | 3.93% | 5.56% | 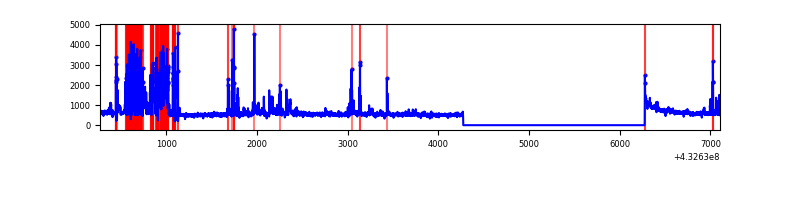 |
| B | 6839 | 4837 | 118 | 118 | 1.73% | 2.44% | 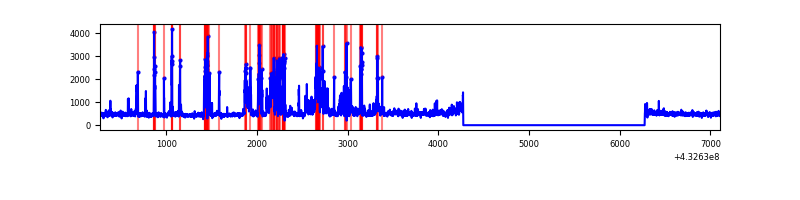 |
| C | 6839 | 4837 | 14 | 14 | 0.20% | 0.29% | 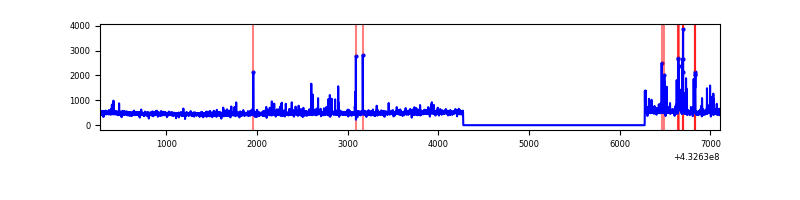 |
| D | 6839 | 4837 | 92 | 92 | 1.35% | 1.90% | 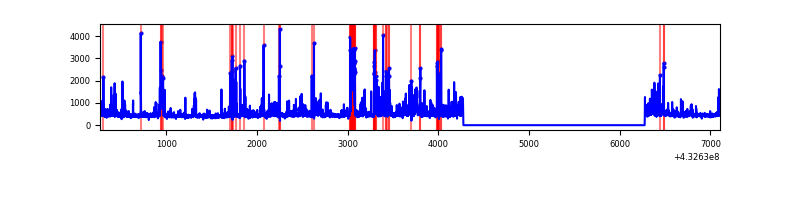 |
Top three noisy pixels from each quadrant. If the there are fewer than three noisy pixels in the level2.evt file, extra rows are filled as -1
| Pixel properties | Quadrant properties | ||||||
|---|---|---|---|---|---|---|---|
| Quadrant | DetID | PixID | Counts | Sigma | Mean | Median | Sigma |
| A | 15 | 237 | 959581 | 8716.03 | 536 | 525 | 110.0 |
| A | 10 | 83 | 458016 | 4157.74 | 536 | 525 | 110.0 |
| A | 12 | 189 | 155782 | 1411.0 | 536 | 525 | 110.0 |
| B | 0 | 229 | 829505 | 8074.84 | 538 | 523 | 102.7 |
| B | 0 | 189 | 55444 | 534.96 | 538 | 523 | 102.7 |
| B | 0 | 245 | 43359 | 417.25 | 538 | 523 | 102.7 |
| C | 15 | 214 | 200268 | 1634.66 | 528 | 532 | 122.2 |
| C | 2 | 16 | 92764 | 754.84 | 528 | 532 | 122.2 |
| C | 14 | 254 | 80183 | 651.87 | 528 | 532 | 122.2 |
| D | 1 | 52 | 345033 | 2715.39 | 528 | 514 | 126.9 |
| D | 5 | 32 | 192843 | 1515.88 | 528 | 514 | 126.9 |
| D | 13 | 249 | 75241 | 588.97 | 528 | 514 | 126.9 |
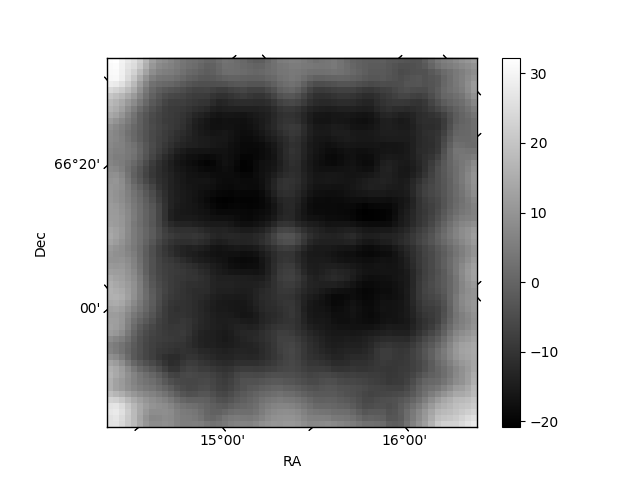
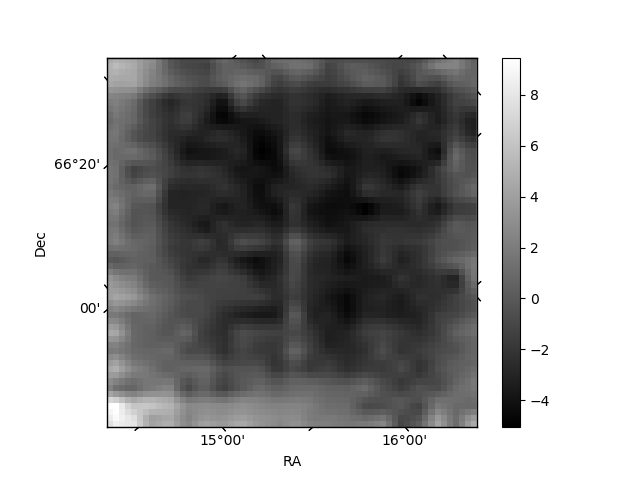
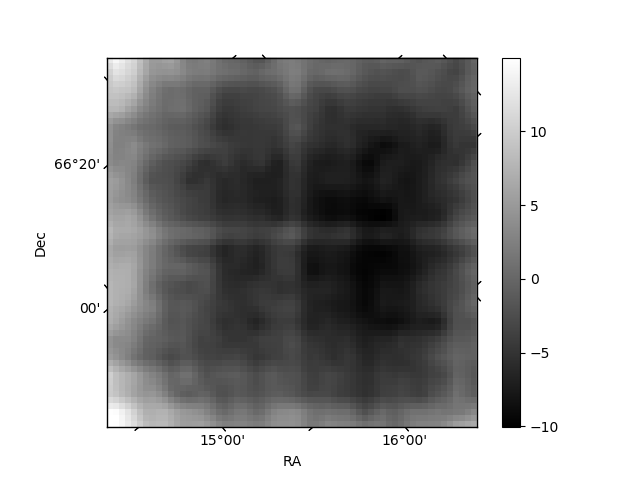
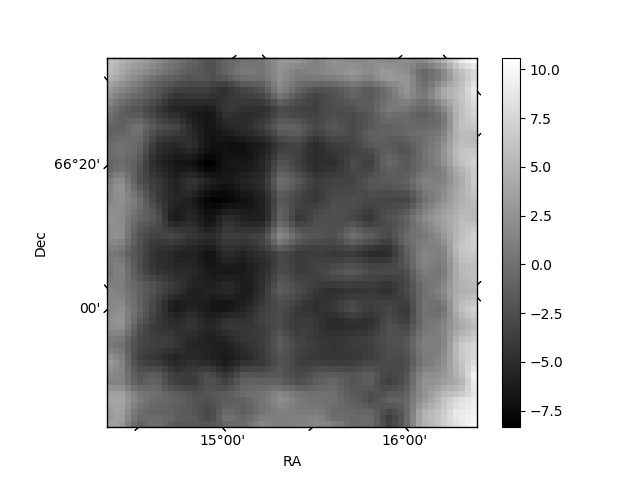
Histogram calculated using DETX and DETY for each event in the final _common_clean file
| Quadrant A | 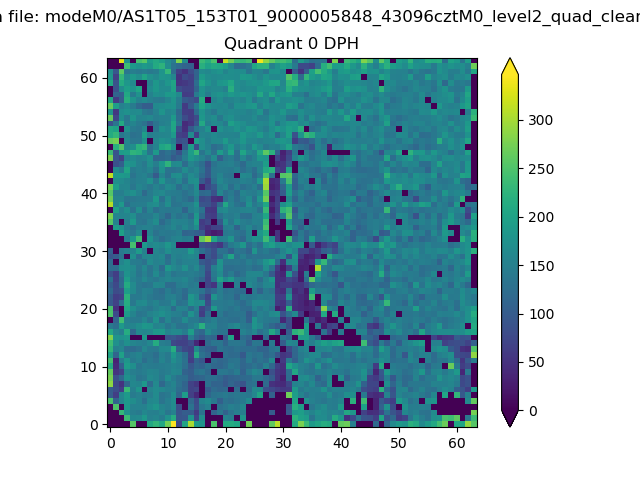 |
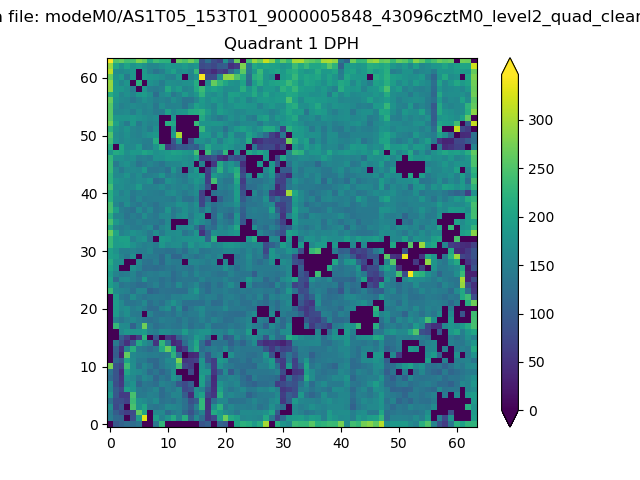 |
Quadrant B |
|---|---|---|---|
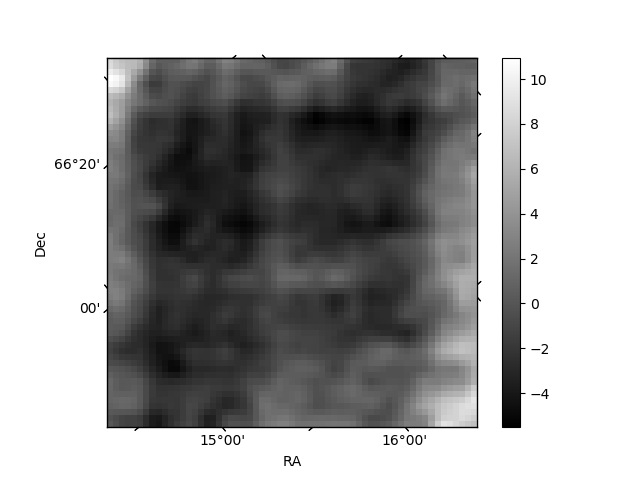
| Quadrant D | 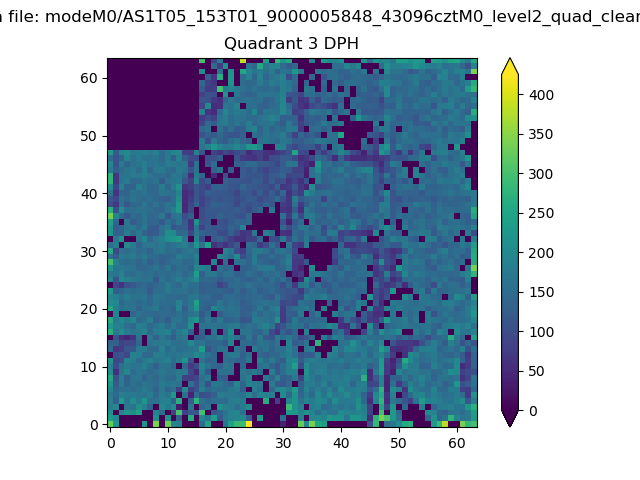 |
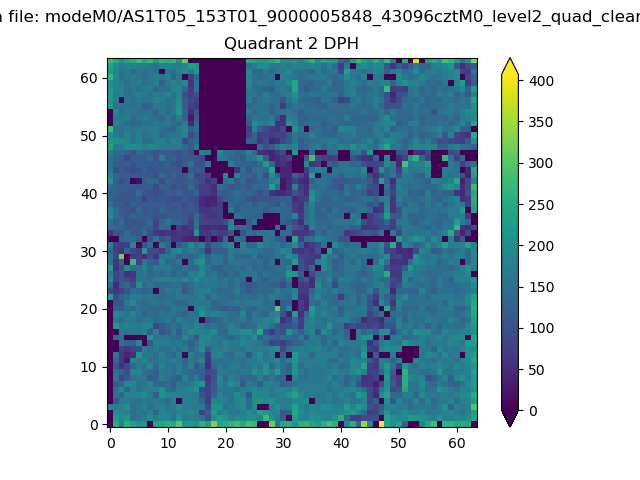 |
Quadrant C |
| Plot type | Count rate plots | Images |
|---|---|---|
| Comparison with Poisson distribution Blue bars denote a histogram of data divided into 1 sec bins. Red curve is a Poisson curve with rate = median count rate of data. |
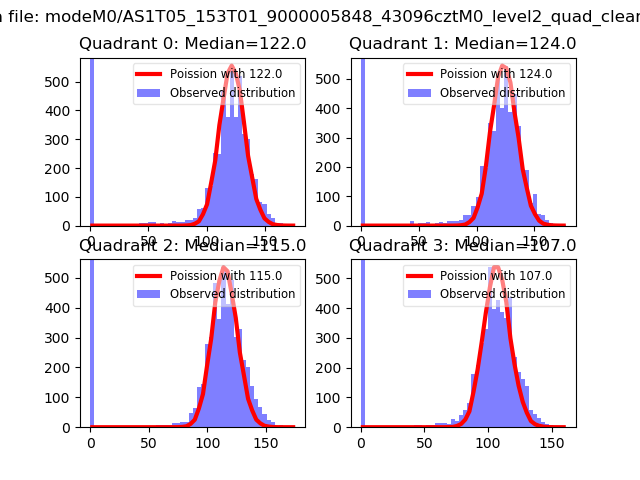 |
 |
| Quadrant-wise count rates Data is divided into 100 sec bins |
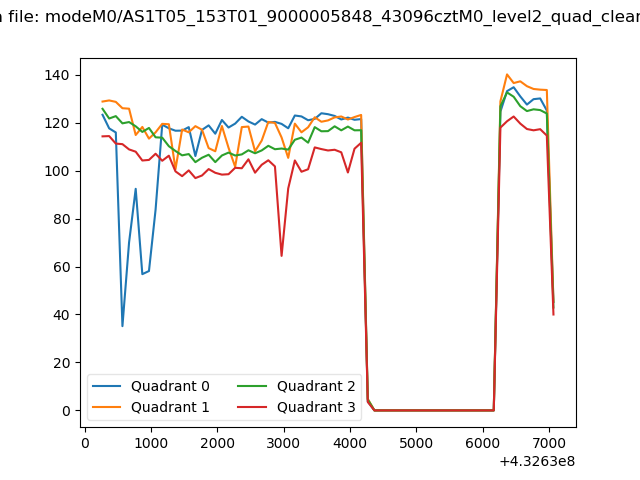 |
|
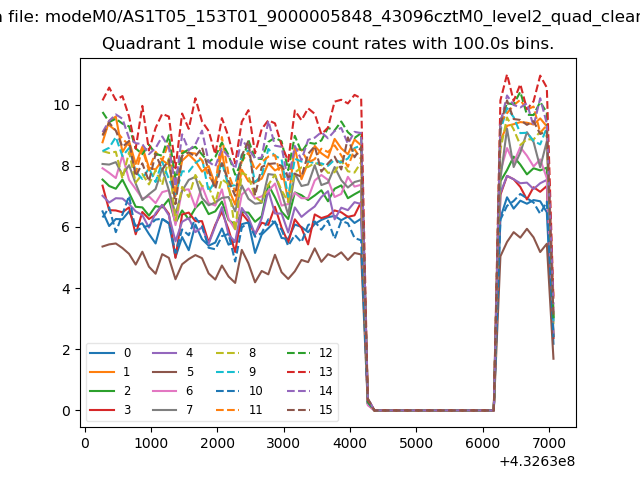
| Module-wise count rates for Quadrant A Data is divided into 100 sec bins |
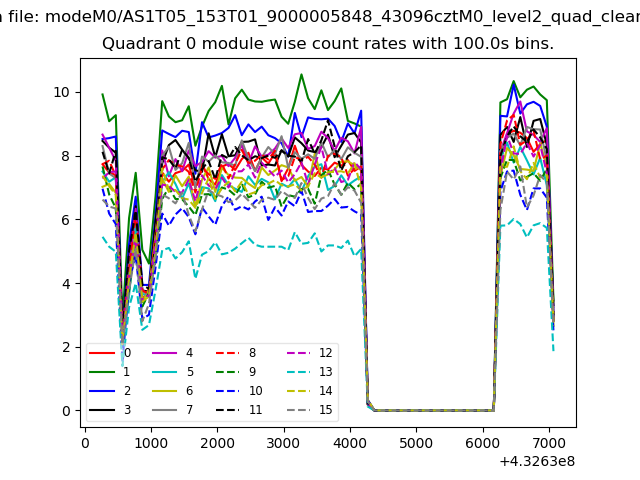 |
 |
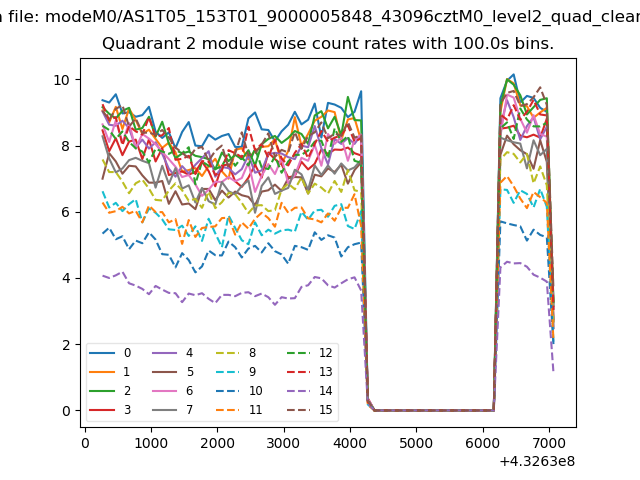
| Module-wise count rates for Quadrant B Data is divided into 100 sec bins |
 |
 |
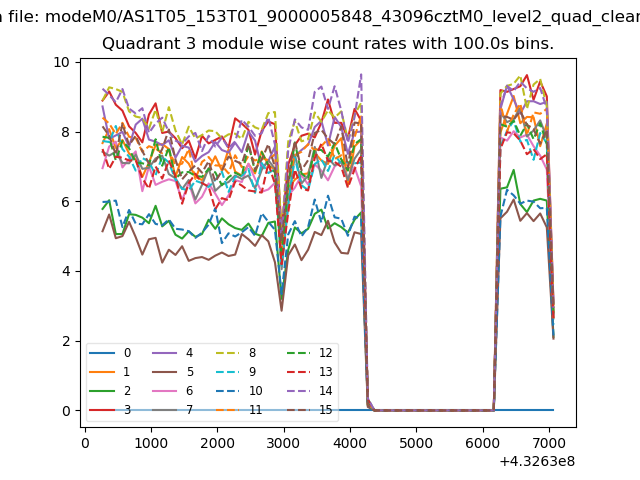
| Module-wise count rates for Quadrant C Data is divided into 100 sec bins |
 |
 |
| Module-wise count rates for Quadrant D Data is divided into 100 sec bins |
 |
 |
| Parameter | Plot |
|---|---|
| CZT HV Monitor | 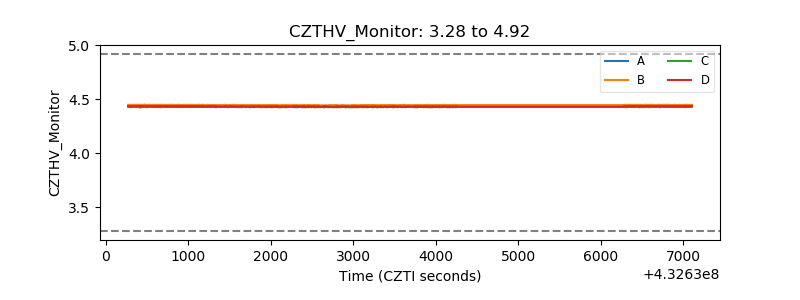 |
| D_VDD | 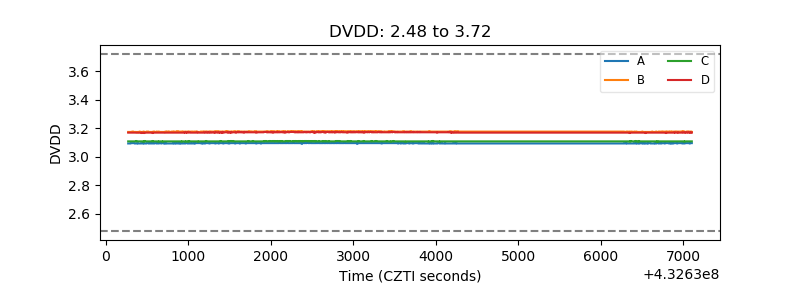 |
| Temperature 1 | 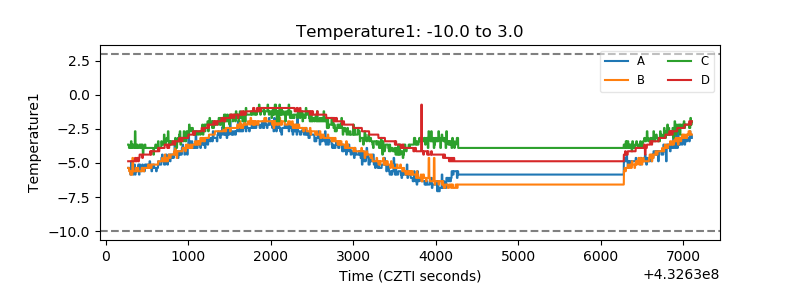 |
| Veto HV Monitor | 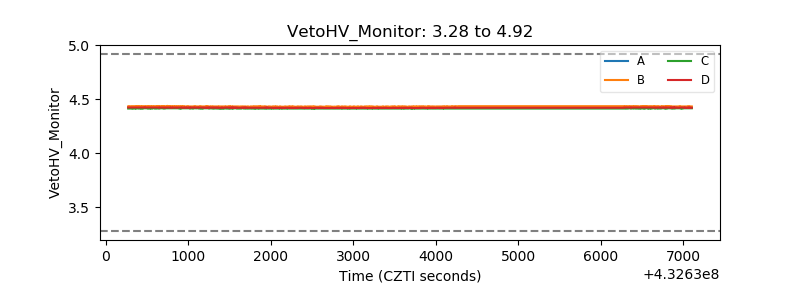 |
| Veto LLD | 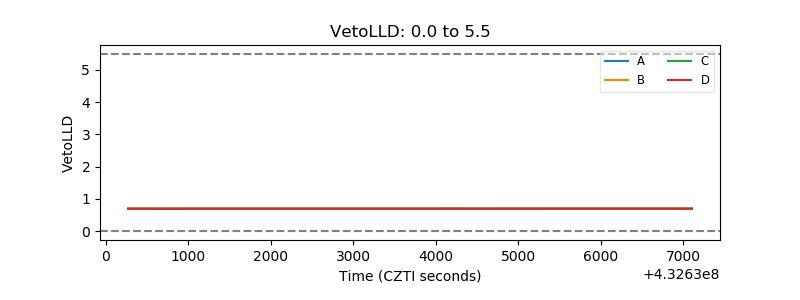 |
| Alpha Counter | 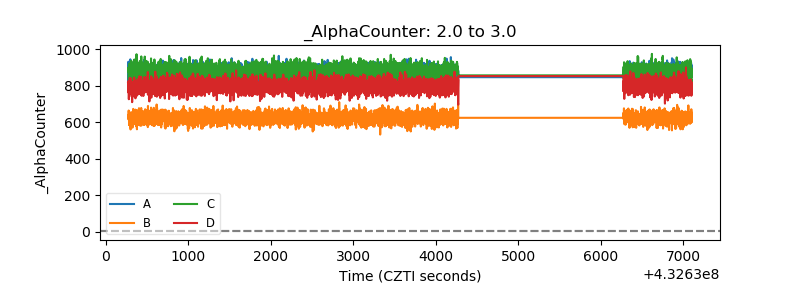 |
| _CPM_Rate | 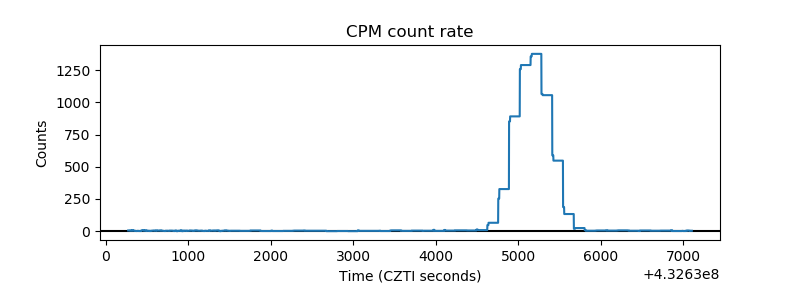 |
| CZT Counter | 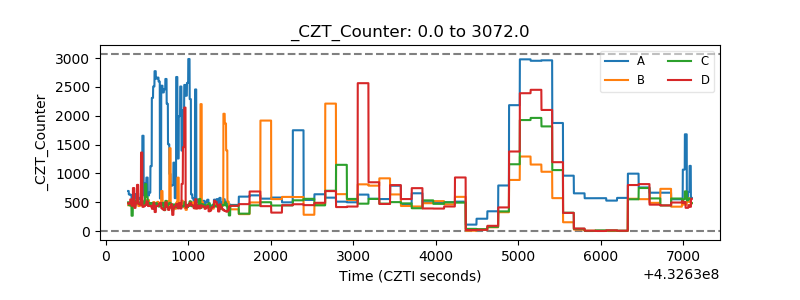 |
| +2.5 Volts monitor |  |
| +5 Volts monitor | 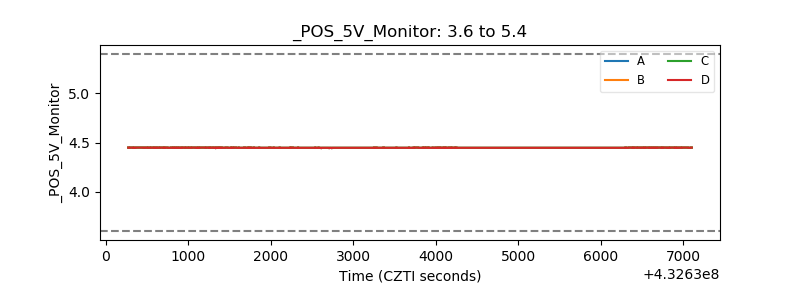 |
| _ROLL_ROT | 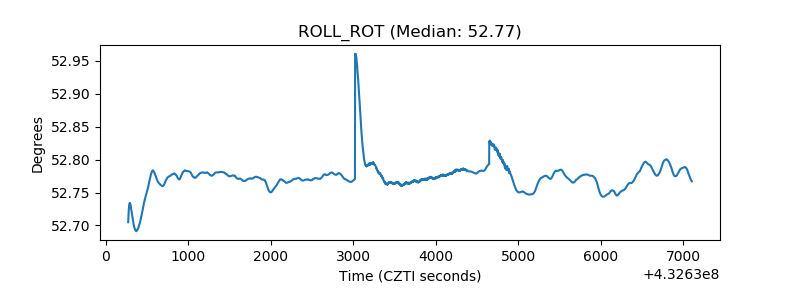 |
| _Roll_DEC | 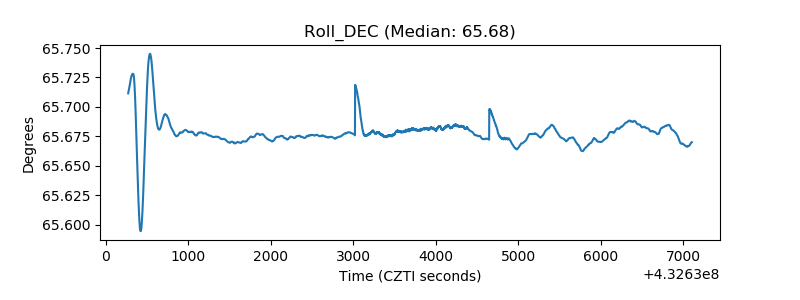 |
| _Roll_RA | 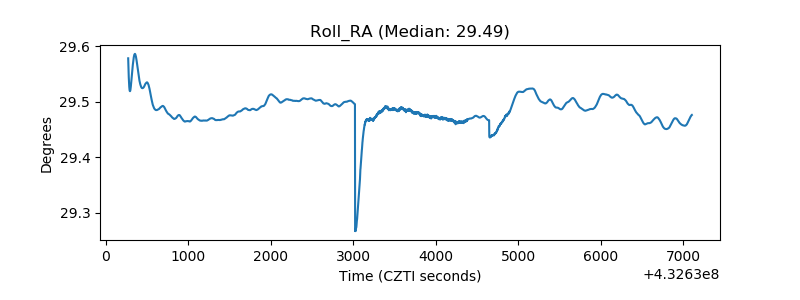 |
| Veto Counter |  |