| Param | Original file | Final file |
|---|---|---|
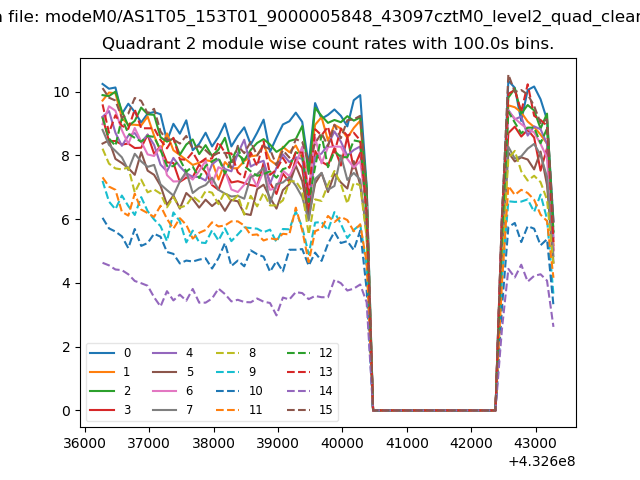
| Filename | modeM0/AS1T05_153T01_9000005848_43097cztM0_level2.fits | modeM0/AS1T05_153T01_9000005848_43097cztM0_level2_quad_clean.evt |
| Size (bytes) | 339,050,880 | 90,440,640 |
| Size | 323.3 MB | 86.3 MB |
| Events in quadrant A | 3,340,586 | 629,736 |
| Events in quadrant B | 2,503,300 | 637,413 |
| Events in quadrant C | 2,873,769 | 591,040 |
| Events in quadrant D | 3,443,371 | 529,672 |
| Mode SS | |||
|---|---|---|---|
| Quadrant | BADHDUFLAG | Total packets | Discarded packets |
| A | 0 | 102 | 0 |
| B | 0 | 102 | 0 |
| C | 0 | 102 | 0 |
| D | 0 | 102 | 0 |
| Mode M9 | |||
|---|---|---|---|
| Quadrant | BADHDUFLAG | Total packets | Discarded packets |
| A | 0 | 26 | 0 |
| B | 0 | 27 | 0 |
| C | 0 | 27 | 0 |
| D | 0 | 27 | 0 |
| Mode M0 | |||
|---|---|---|---|
| Quadrant | BADHDUFLAG | Total packets | Discarded packets |
| A | 0 | 13075 | 2 |
| B | 0 | 10570 | 2 |
| C | 0 | 11496 | 2 |
| D | 0 | 13519 | 4 |
| Quadrant | Total seconds | Saturated seconds | Saturation percentage |
|---|---|---|---|
| A | 5003 | 99 | 1.978813% |
| B | 5003 | 16 | 0.319808% |
| C | 5003 | 78 | 1.559065% |
| D | 5002 | 314 | 6.277489% |
Noise dominated data is calculated using 1-second bins in cleaned event files. If a bin has >2000 counts, and if more than 50% of those come from <1% of pixels, then it is considered to be noise-dominated and hence unusable.
| Quadrant | # 1 sec bins | Bins with >0 counts | Bins with >2000 counts | High rate bins dominated by noise | Noise dominated (total time) | Noise dominated (detector-on time) | Marked lightcurve |
|---|---|---|---|---|---|---|---|
| A | 7066 | 5004 | 72 | 72 | 1.02% | 1.44% | 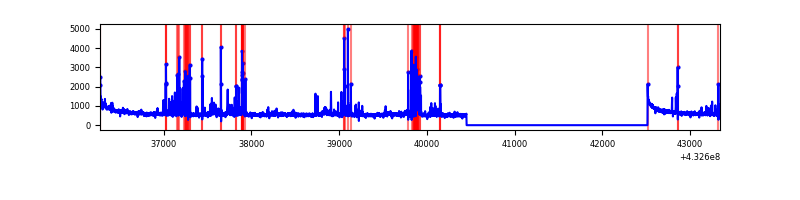 |
| B | 7066 | 5004 | 7 | 7 | 0.10% | 0.14% |  |
| C | 7066 | 5004 | 60 | 60 | 0.85% | 1.20% | 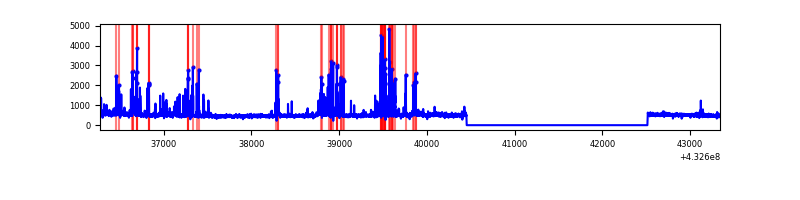 |
| D | 7065 | 5003 | 244 | 244 | 3.45% | 4.88% | 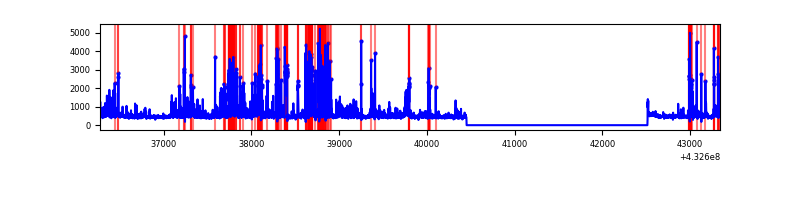 |
Top three noisy pixels from each quadrant. If the there are fewer than three noisy pixels in the level2.evt file, extra rows are filled as -1
| Pixel properties | Quadrant properties | ||||||
|---|---|---|---|---|---|---|---|
| Quadrant | DetID | PixID | Counts | Sigma | Mean | Median | Sigma |
| A | 10 | 83 | 562716 | 4771.19 | 583 | 573 | 117.8 |
| A | 12 | 189 | 251431 | 2129.16 | 583 | 573 | 117.8 |
| A | 15 | 237 | 250085 | 2117.73 | 583 | 573 | 117.8 |
| B | 0 | 229 | 127842 | 1170.29 | 575 | 560 | 108.8 |
| B | 0 | 245 | 63741 | 580.92 | 575 | 560 | 108.8 |
| B | 5 | 255 | 29041 | 261.87 | 575 | 560 | 108.8 |
| C | 14 | 254 | 389332 | 3022.86 | 556 | 560 | 128.6 |
| C | 15 | 214 | 212603 | 1648.72 | 556 | 560 | 128.6 |
| C | 2 | 16 | 89307 | 690.04 | 556 | 560 | 128.6 |
| D | 1 | 52 | 664448 | 5047.01 | 546 | 531 | 131.5 |
| D | 12 | 233 | 287320 | 2180.13 | 546 | 531 | 131.5 |
| D | 5 | 32 | 113185 | 856.38 | 546 | 531 | 131.5 |
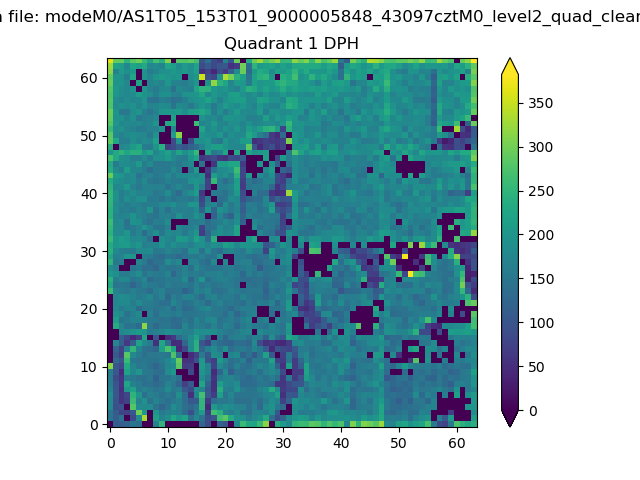
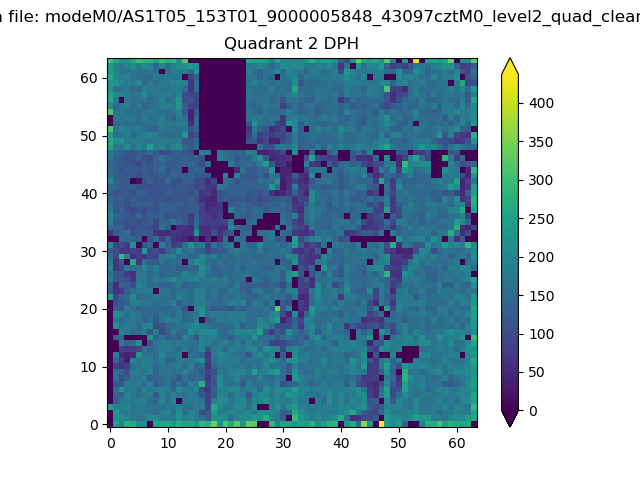
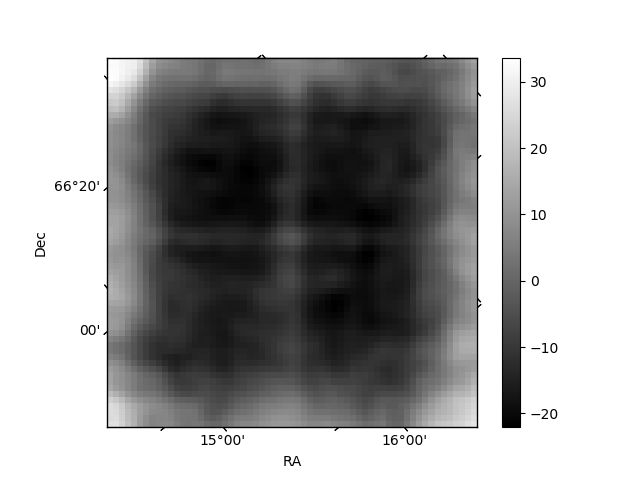
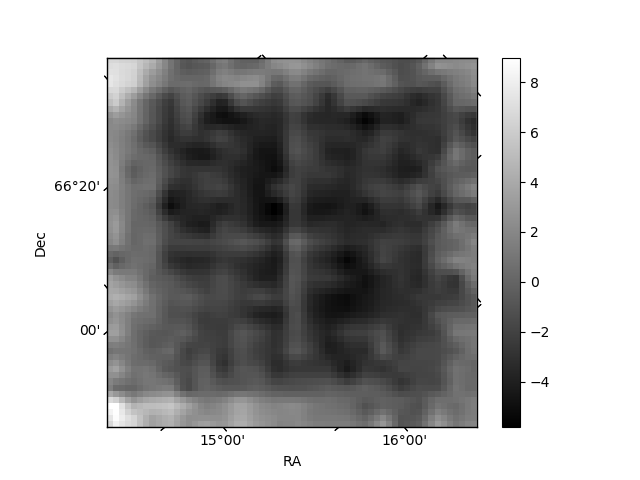
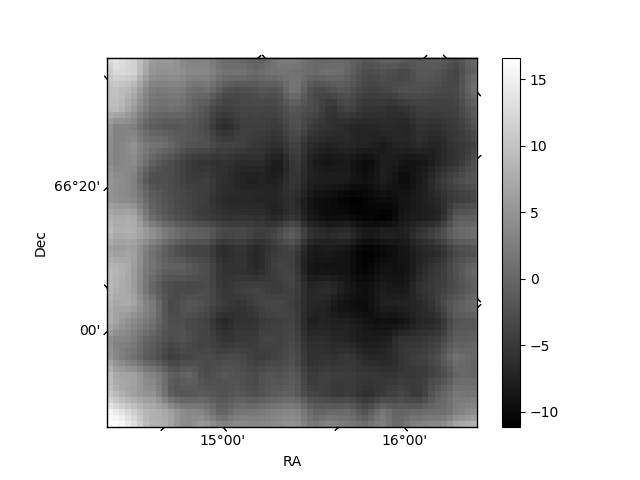
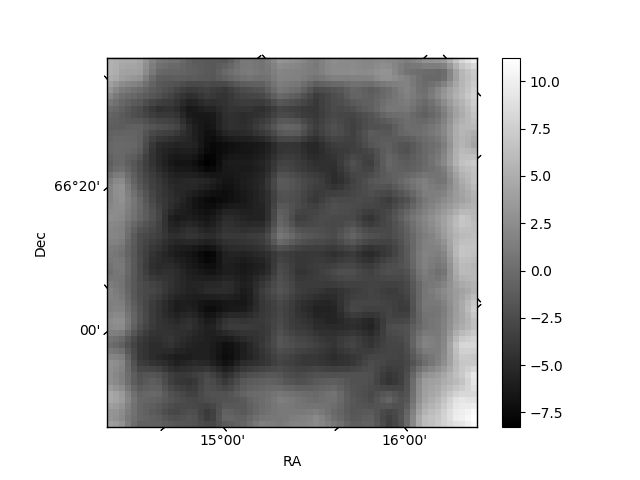
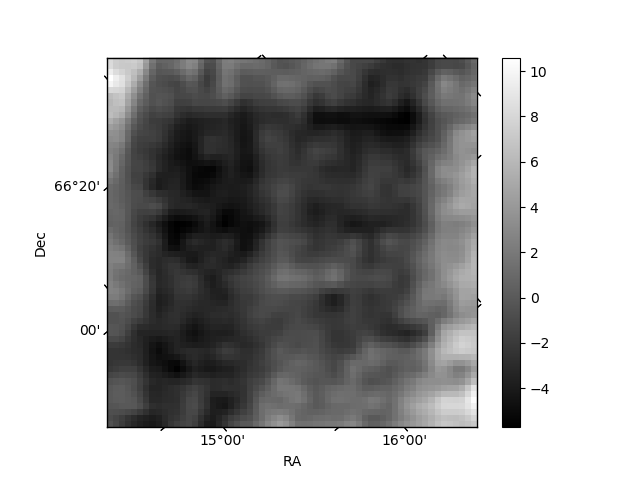
Histogram calculated using DETX and DETY for each event in the final _common_clean file
| Quadrant A | 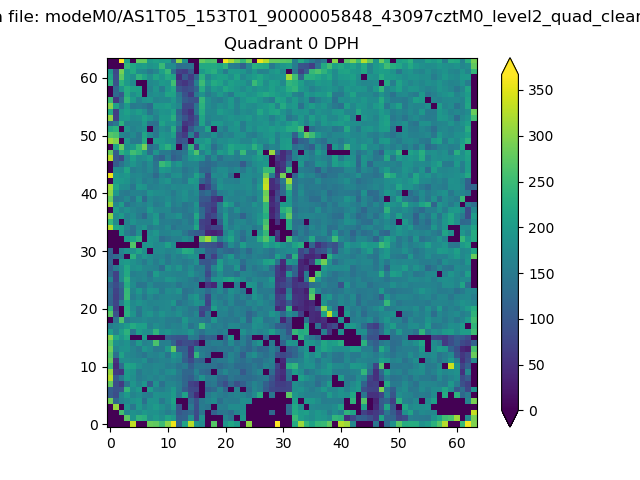 |
 |
Quadrant B |
|---|---|---|---|
| Quadrant D | 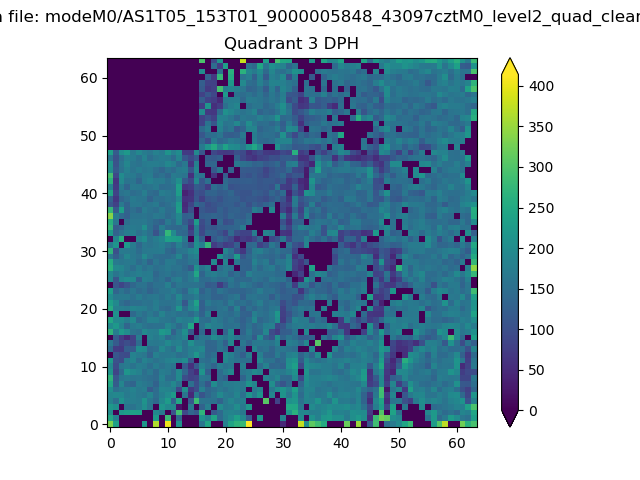 |
 |
Quadrant C |
| Plot type | Count rate plots | Images |
|---|---|---|
| Comparison with Poisson distribution Blue bars denote a histogram of data divided into 1 sec bins. Red curve is a Poisson curve with rate = median count rate of data. |
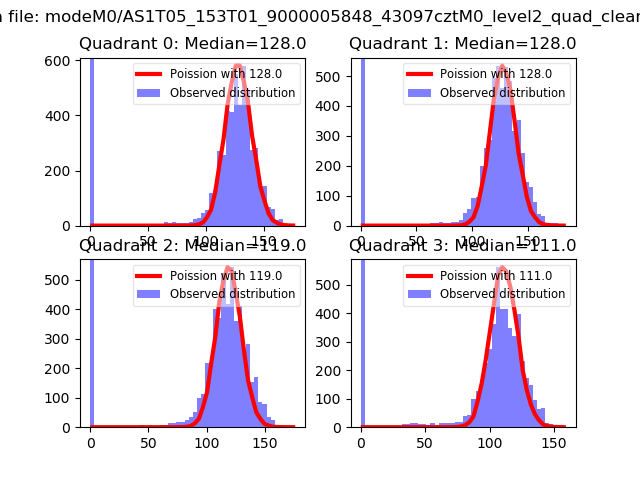 |
 |
| Quadrant-wise count rates Data is divided into 100 sec bins |
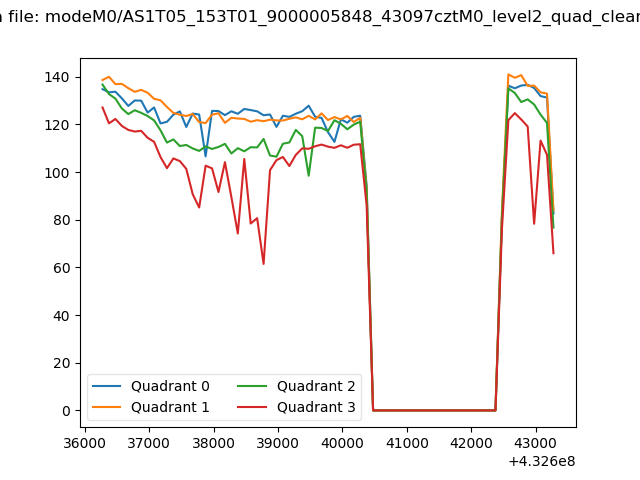 |
|
| Module-wise count rates for Quadrant A Data is divided into 100 sec bins |
 |
 |
| Module-wise count rates for Quadrant B Data is divided into 100 sec bins |
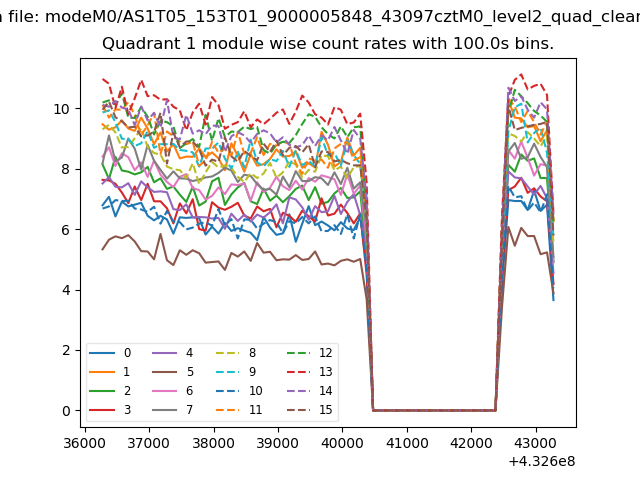 |
 |
| Module-wise count rates for Quadrant C Data is divided into 100 sec bins |
 |
 |
| Module-wise count rates for Quadrant D Data is divided into 100 sec bins |
 |
 |
| Parameter | Plot |
|---|---|
| CZT HV Monitor |  |
| D_VDD | 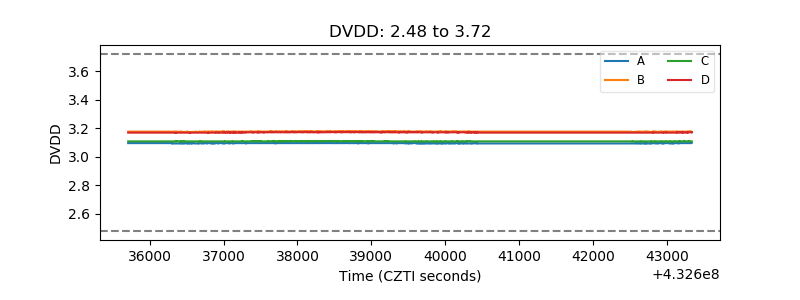 |
| Temperature 1 | 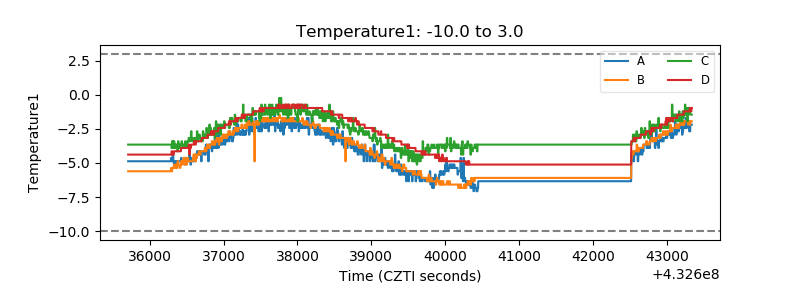 |
| Veto HV Monitor | 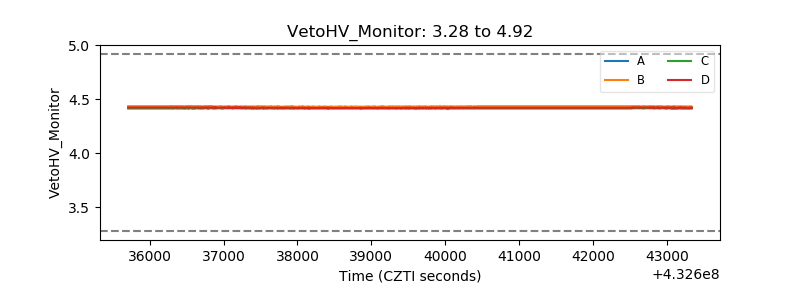 |
| Veto LLD | 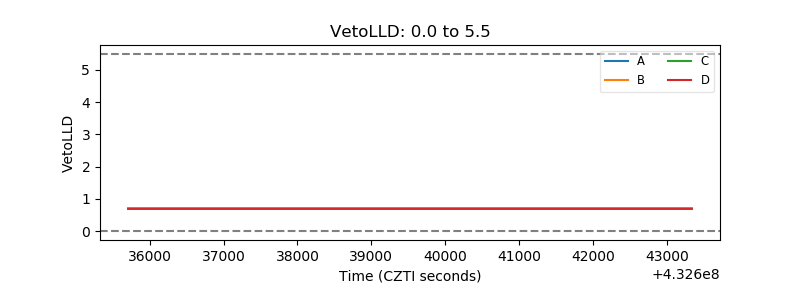 |
| Alpha Counter | 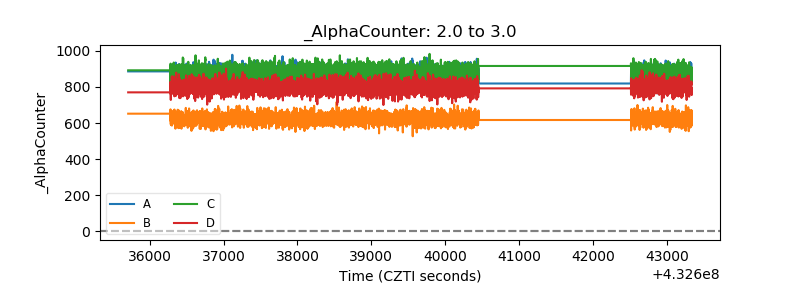 |
| _CPM_Rate | 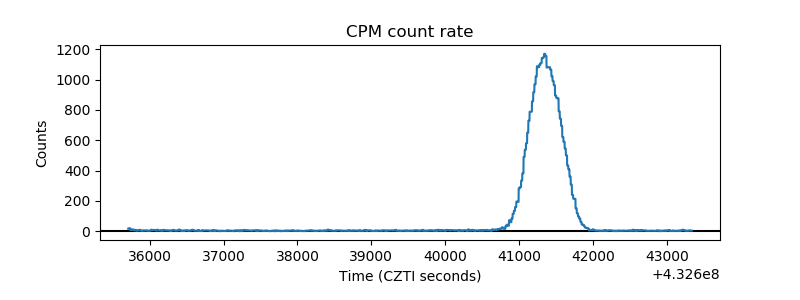 |
| CZT Counter | 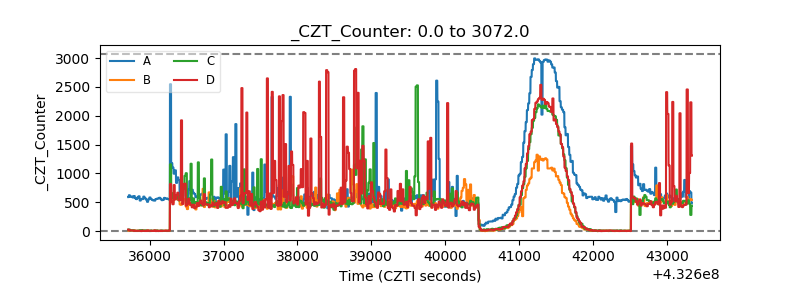 |
| +2.5 Volts monitor | 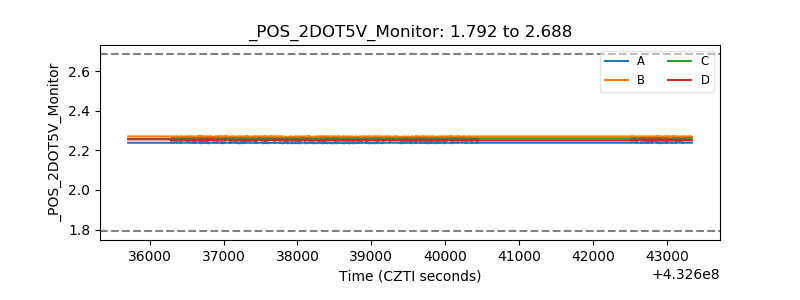 |
| +5 Volts monitor | 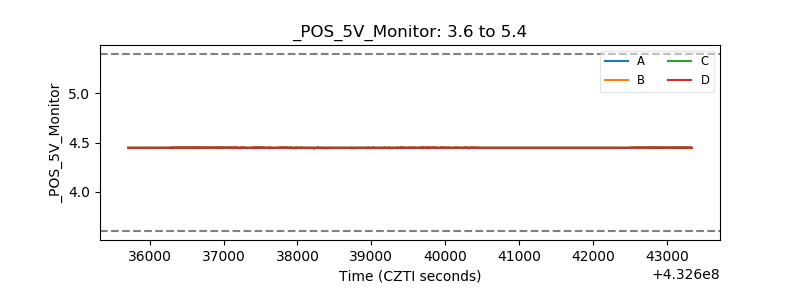 |
| _ROLL_ROT | 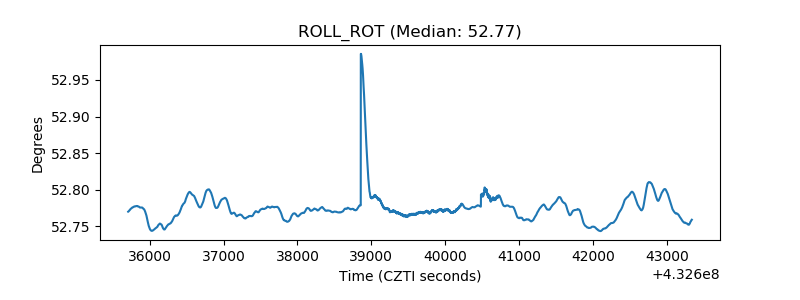 |
| _Roll_DEC | 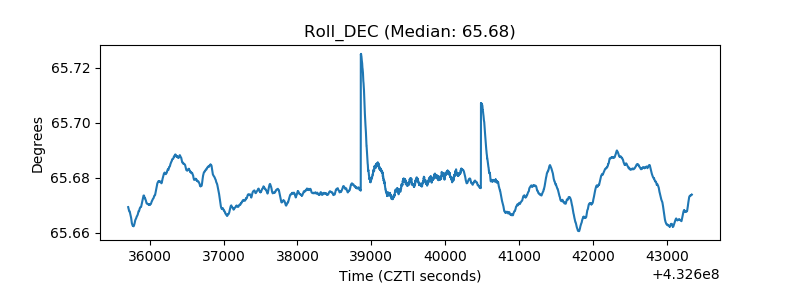 |
| _Roll_RA | 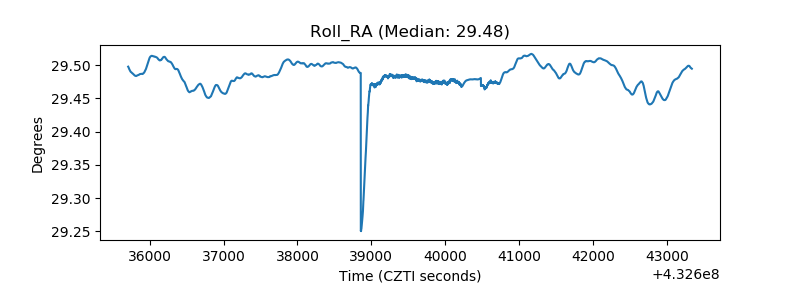 |
| Veto Counter | 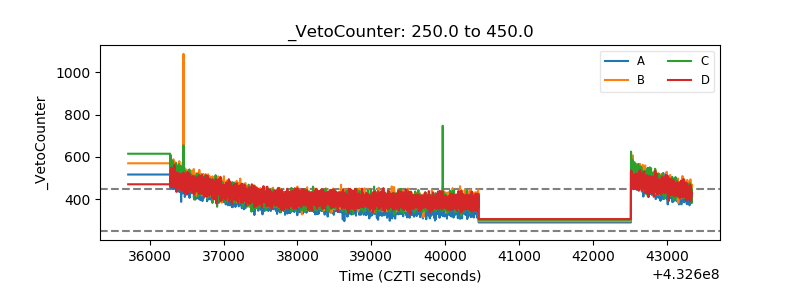 |