| Param | Original file | Final file |
|---|---|---|
| Filename | modeM0/AS1T05_153T01_9000005848_43098cztM0_level2.fits | modeM0/AS1T05_153T01_9000005848_43098cztM0_level2_quad_clean.evt |
| Size (bytes) | 313,833,600 | 93,136,320 |
| Size | 299.3 MB | 88.8 MB |
| Events in quadrant A | 3,255,998 | 646,248 |
| Events in quadrant B | 2,573,789 | 647,961 |
| Events in quadrant C | 2,505,716 | 607,644 |
| Events in quadrant D | 2,879,965 | 557,746 |
| Mode SS | |||
|---|---|---|---|
| Quadrant | BADHDUFLAG | Total packets | Discarded packets |
| A | 0 | 104 | 0 |
| B | 0 | 104 | 0 |
| C | 0 | 104 | 0 |
| D | 0 | 104 | 0 |
| Mode M9 | |||
|---|---|---|---|
| Quadrant | BADHDUFLAG | Total packets | Discarded packets |
| A | 0 | 27 | 0 |
| B | 0 | 28 | 0 |
| C | 0 | 28 | 0 |
| D | 0 | 28 | 0 |
| Mode M0 | |||
|---|---|---|---|
| Quadrant | BADHDUFLAG | Total packets | Discarded packets |
| A | 0 | 12790 | 2 |
| B | 0 | 10936 | 2 |
| C | 0 | 10480 | 2 |
| D | 0 | 12043 | 2 |
| Quadrant | Total seconds | Saturated seconds | Saturation percentage |
|---|---|---|---|
| A | 5154 | 84 | 1.629802% |
| B | 5154 | 25 | 0.485060% |
| C | 5154 | 10 | 0.194024% |
| D | 5154 | 118 | 2.289484% |
Noise dominated data is calculated using 1-second bins in cleaned event files. If a bin has >2000 counts, and if more than 50% of those come from <1% of pixels, then it is considered to be noise-dominated and hence unusable.
| Quadrant | # 1 sec bins | Bins with >0 counts | Bins with >2000 counts | High rate bins dominated by noise | Noise dominated (total time) | Noise dominated (detector-on time) | Marked lightcurve |
|---|---|---|---|---|---|---|---|
| A | 7278 | 5155 | 48 | 48 | 0.66% | 0.93% | 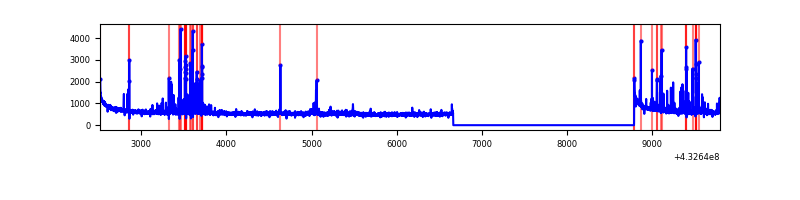 |
| B | 7278 | 5155 | 8 | 8 | 0.11% | 0.16% | 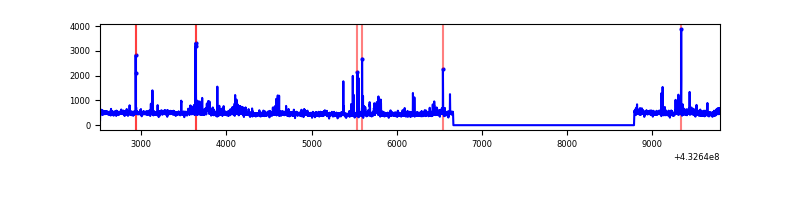 |
| C | 7278 | 5155 | 5 | 5 | 0.07% | 0.10% | 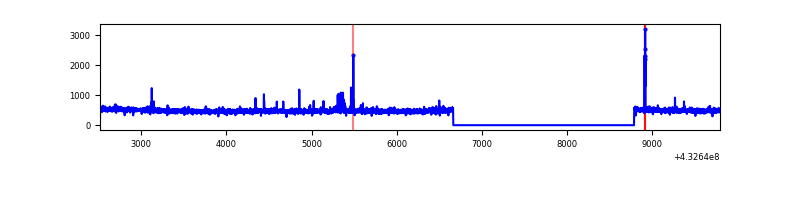 |
| D | 7278 | 5155 | 82 | 82 | 1.13% | 1.59% | 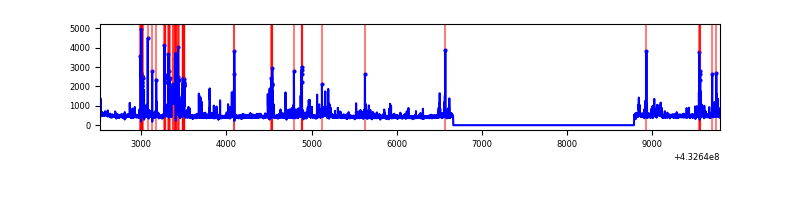 |
Top three noisy pixels from each quadrant. If the there are fewer than three noisy pixels in the level2.evt file, extra rows are filled as -1
| Pixel properties | Quadrant properties | ||||||
|---|---|---|---|---|---|---|---|
| Quadrant | DetID | PixID | Counts | Sigma | Mean | Median | Sigma |
| A | 10 | 83 | 580822 | 4833.55 | 595 | 582 | 120.0 |
| A | 15 | 237 | 321159 | 2670.49 | 595 | 582 | 120.0 |
| A | 12 | 189 | 36271 | 297.29 | 595 | 582 | 120.0 |
| B | 0 | 229 | 126832 | 1126.93 | 586 | 570 | 112.0 |
| B | 0 | 245 | 93461 | 829.08 | 586 | 570 | 112.0 |
| B | 3 | 112 | 26550 | 231.88 | 586 | 570 | 112.0 |
| C | 15 | 214 | 219256 | 1660.79 | 572 | 576 | 131.7 |
| C | 14 | 254 | 34864 | 260.4 | 572 | 576 | 131.7 |
| C | 1 | 16 | 8645 | 61.28 | 572 | 576 | 131.7 |
| D | 1 | 52 | 323586 | 2322.19 | 572 | 556 | 139.1 |
| D | 12 | 233 | 161901 | 1159.87 | 572 | 556 | 139.1 |
| D | 13 | 249 | 105400 | 753.7 | 572 | 556 | 139.1 |
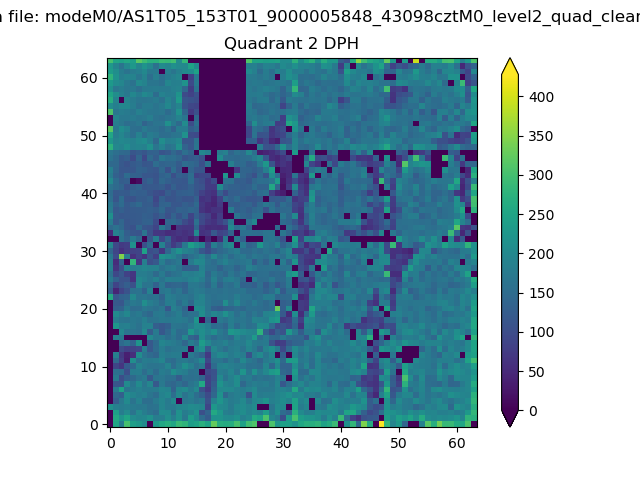
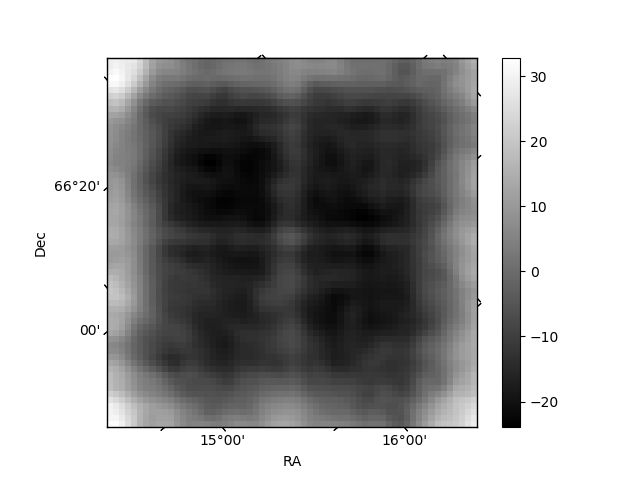
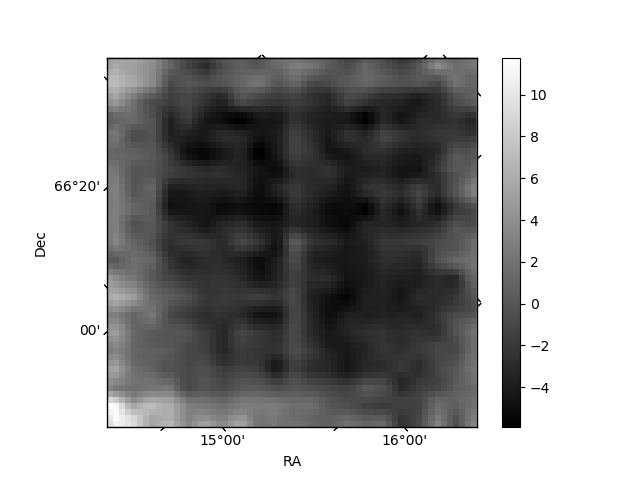
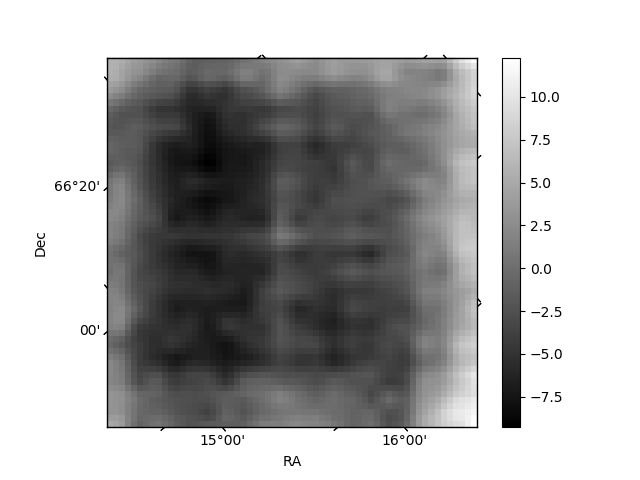
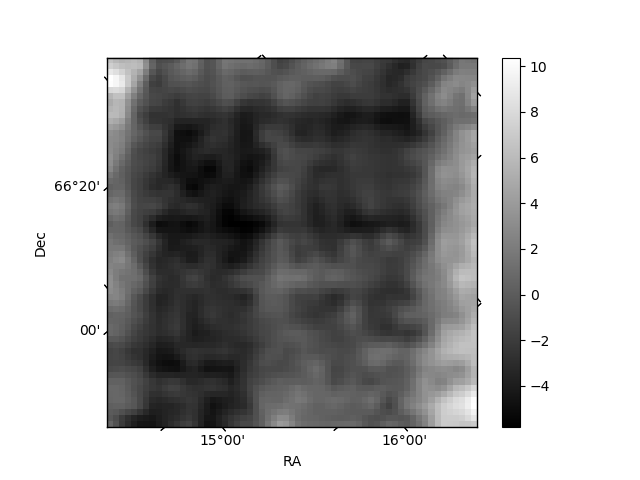
Histogram calculated using DETX and DETY for each event in the final _common_clean file
| Quadrant A | 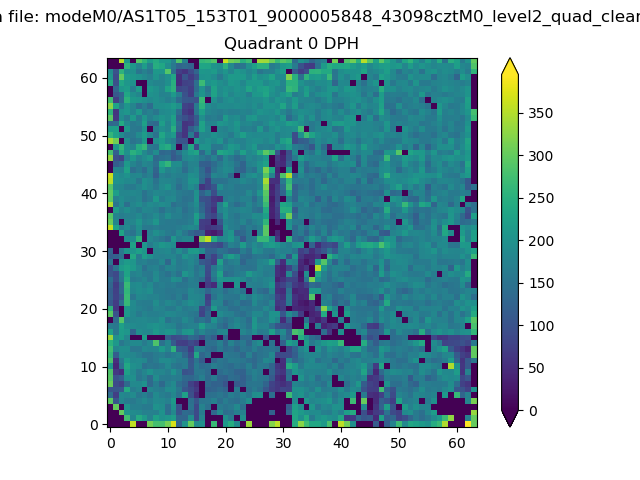 |
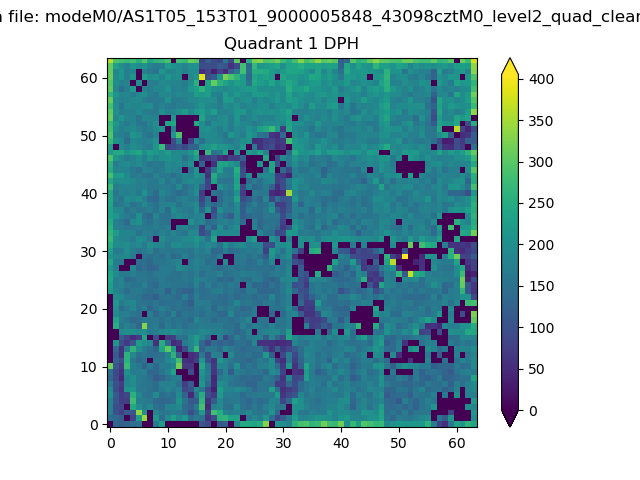 |
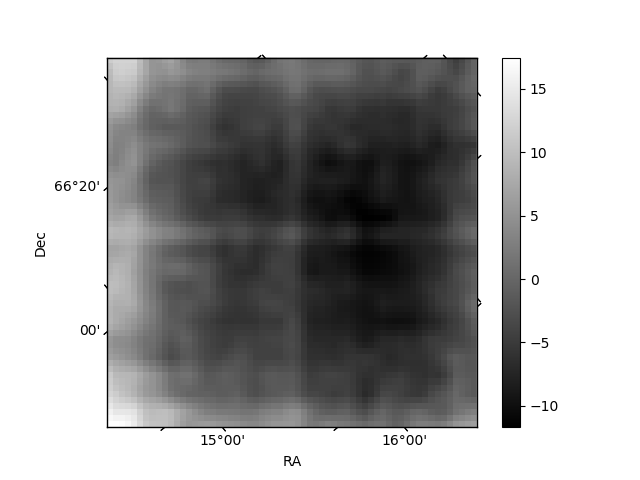
Quadrant B |
|---|---|---|---|
| Quadrant D | 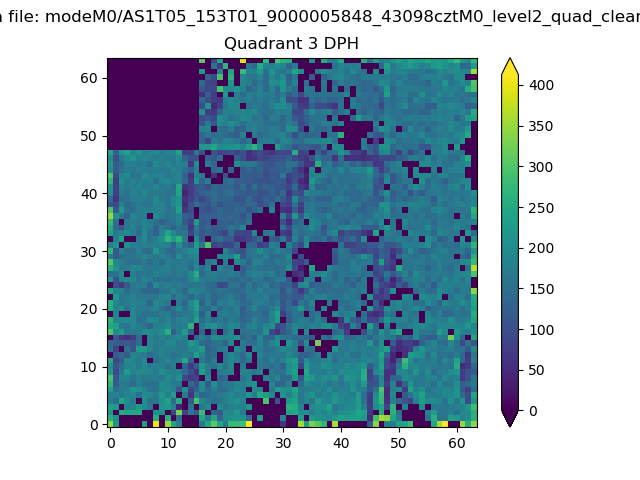 |
 |
Quadrant C |
| Plot type | Count rate plots | Images |
|---|---|---|
| Comparison with Poisson distribution Blue bars denote a histogram of data divided into 1 sec bins. Red curve is a Poisson curve with rate = median count rate of data. |
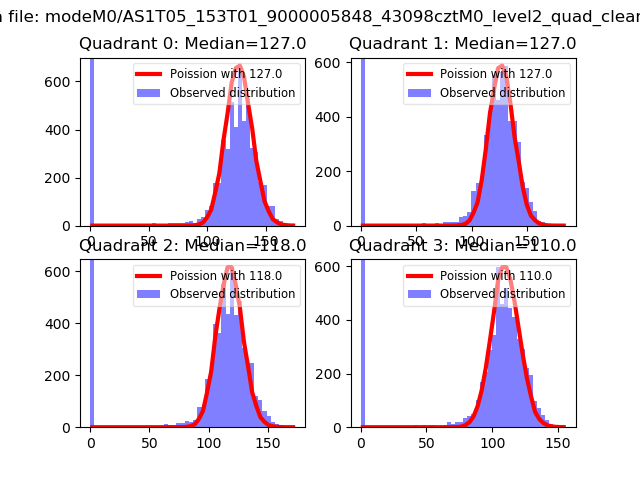 |
 |
| Quadrant-wise count rates Data is divided into 100 sec bins |
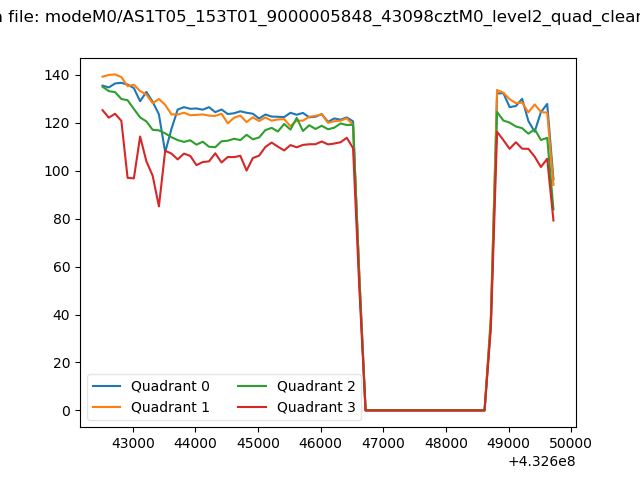 |
|
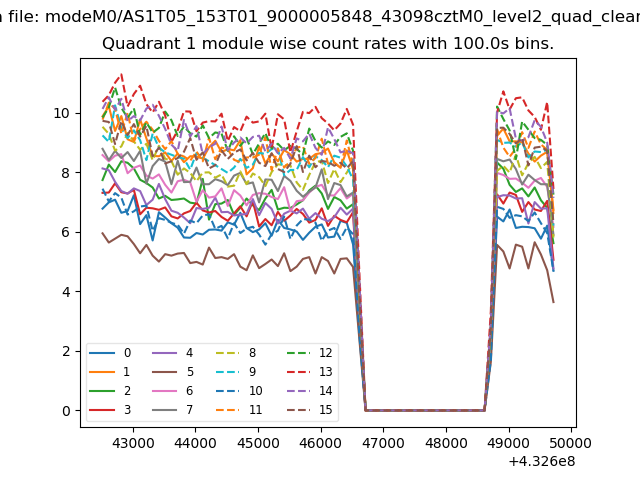
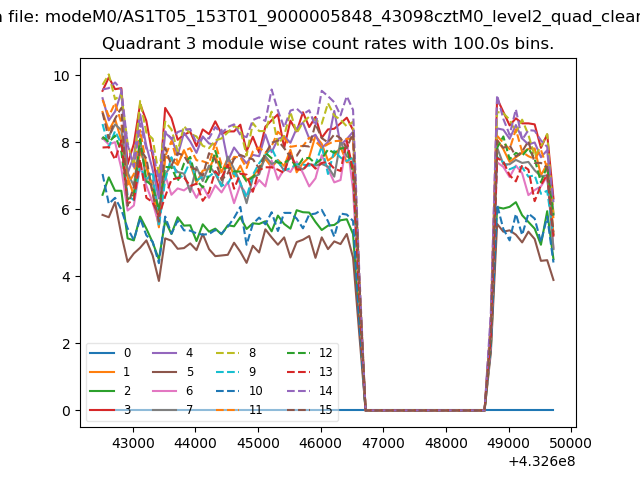
| Module-wise count rates for Quadrant A Data is divided into 100 sec bins |
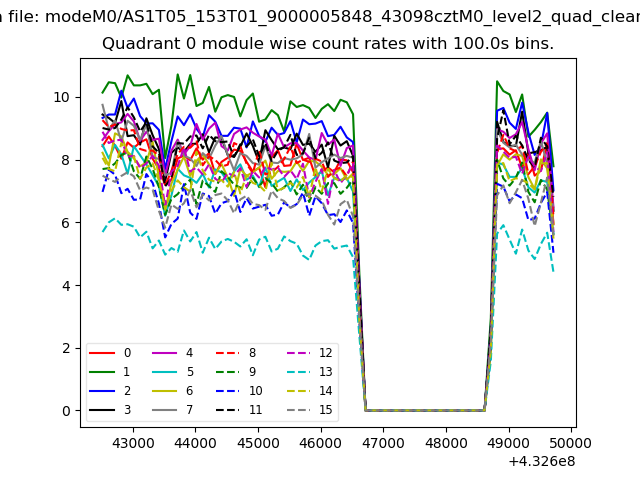 |
 |
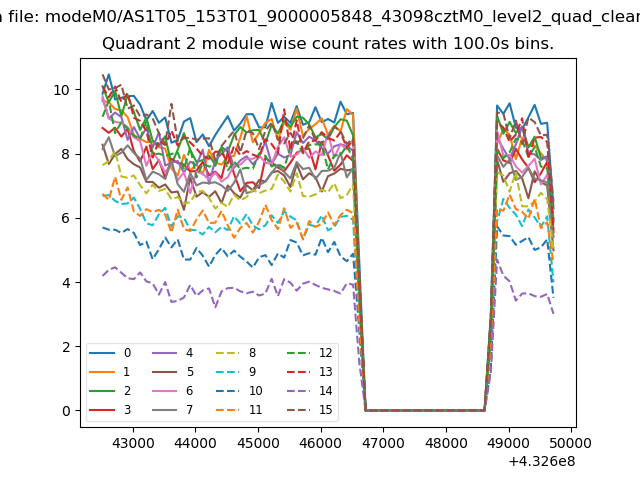
| Module-wise count rates for Quadrant B Data is divided into 100 sec bins |
 |
 |
| Module-wise count rates for Quadrant C Data is divided into 100 sec bins |
 |
 |
| Module-wise count rates for Quadrant D Data is divided into 100 sec bins |
 |
 |
| Parameter | Plot |
|---|---|
| CZT HV Monitor | 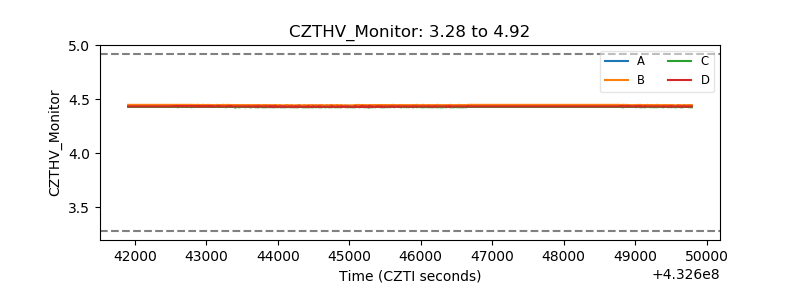 |
| D_VDD | 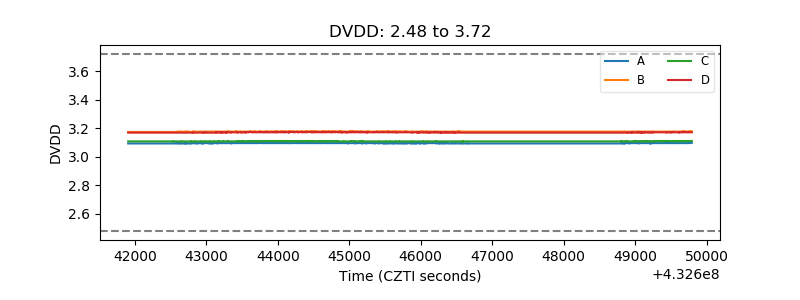 |
| Temperature 1 | 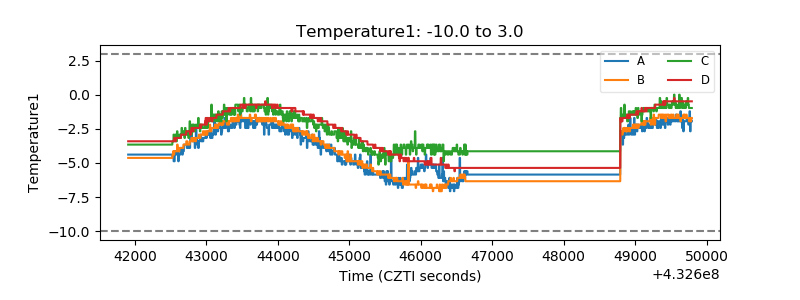 |
| Veto HV Monitor | 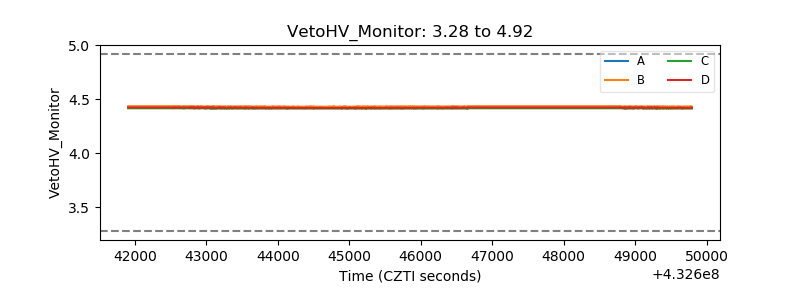 |
| Veto LLD | 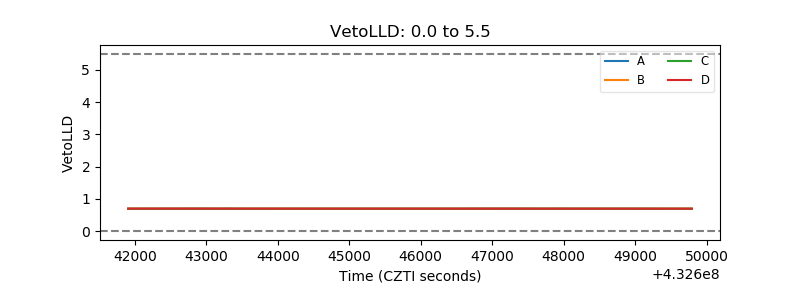 |
| Alpha Counter | 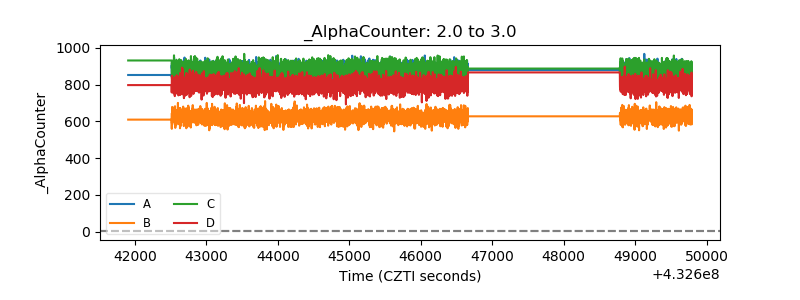 |
| _CPM_Rate | 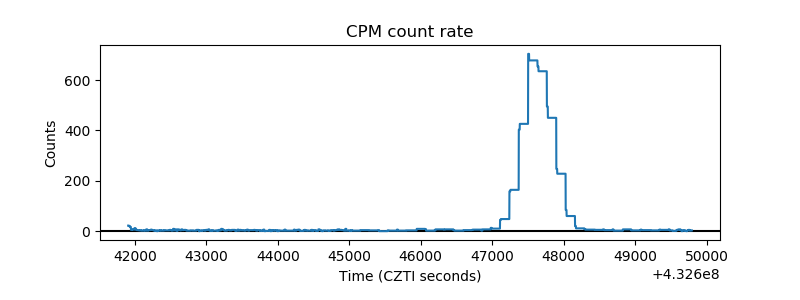 |
| CZT Counter | 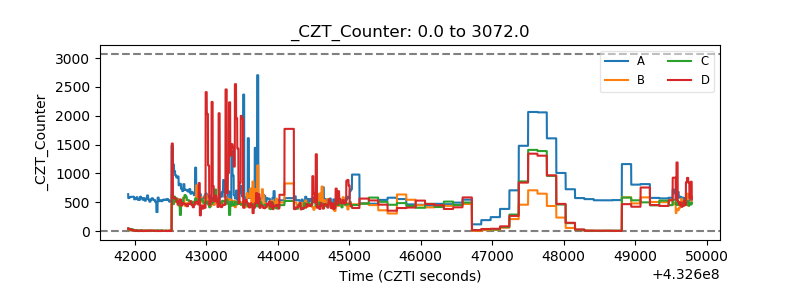 |
| +2.5 Volts monitor | 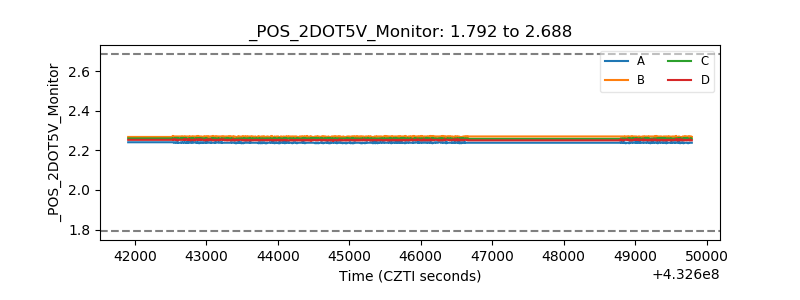 |
| +5 Volts monitor | 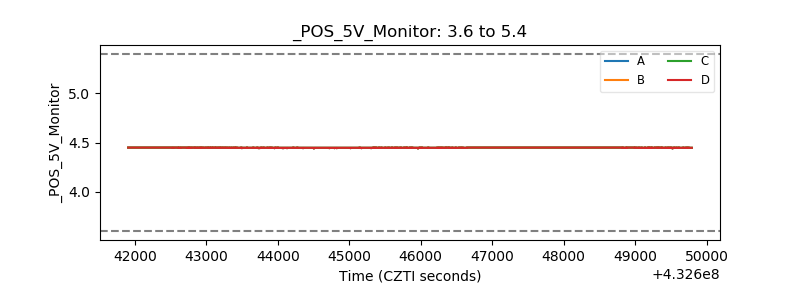 |
| _ROLL_ROT | 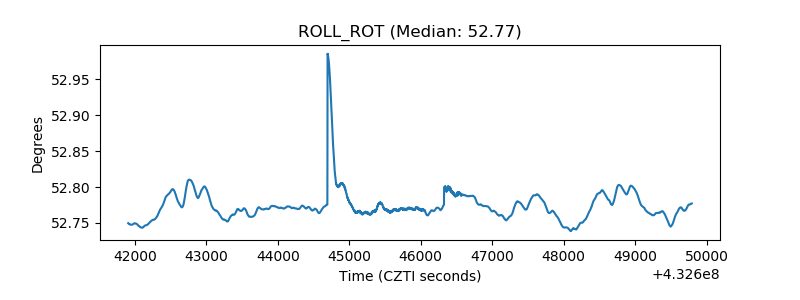 |
| _Roll_DEC | 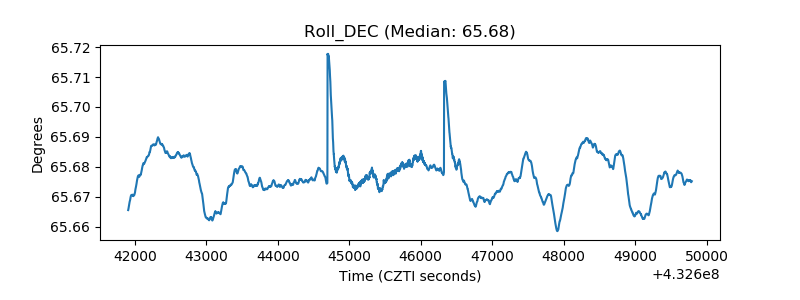 |
| _Roll_RA | 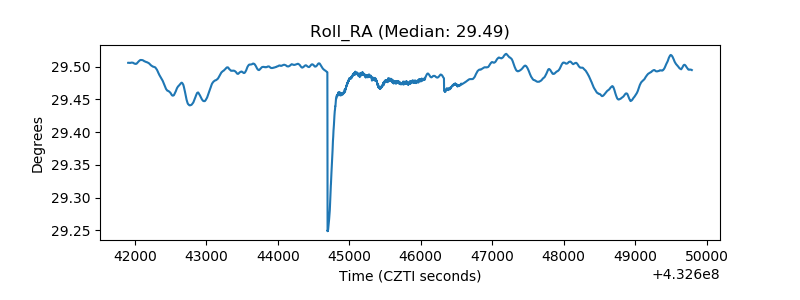 |
| Veto Counter |  |