| Param | Original file | Final file |
|---|---|---|
| Filename | modeM0/AS1T05_153T01_9000005848_43099cztM0_level2.fits | modeM0/AS1T05_153T01_9000005848_43099cztM0_level2_quad_clean.evt |
| Size (bytes) | 318,317,760 | 90,066,240 |
| Size | 303.6 MB | 85.9 MB |
| Events in quadrant A | 3,119,080 | 623,525 |
| Events in quadrant B | 2,635,688 | 619,590 |
| Events in quadrant C | 2,536,429 | 582,307 |
| Events in quadrant D | 3,089,759 | 540,147 |
| Mode SS | |||
|---|---|---|---|
| Quadrant | BADHDUFLAG | Total packets | Discarded packets |
| A | 0 | 106 | 0 |
| B | 0 | 106 | 0 |
| C | 0 | 106 | 0 |
| D | 0 | 106 | 0 |
| Mode M9 | |||
|---|---|---|---|
| Quadrant | BADHDUFLAG | Total packets | Discarded packets |
| A | 0 | 25 | 0 |
| B | 0 | 26 | 0 |
| C | 0 | 26 | 0 |
| D | 0 | 26 | 0 |
| Mode M0 | |||
|---|---|---|---|
| Quadrant | BADHDUFLAG | Total packets | Discarded packets |
| A | 0 | 12371 | 2 |
| B | 0 | 11221 | 2 |
| C | 0 | 10691 | 2 |
| D | 0 | 12797 | 2 |
| Quadrant | Total seconds | Saturated seconds | Saturation percentage |
|---|---|---|---|
| A | 5160 | 53 | 1.027132% |
| B | 5160 | 44 | 0.852713% |
| C | 5160 | 23 | 0.445736% |
| D | 5160 | 122 | 2.364341% |
Noise dominated data is calculated using 1-second bins in cleaned event files. If a bin has >2000 counts, and if more than 50% of those come from <1% of pixels, then it is considered to be noise-dominated and hence unusable.
| Quadrant | # 1 sec bins | Bins with >0 counts | Bins with >2000 counts | High rate bins dominated by noise | Noise dominated (total time) | Noise dominated (detector-on time) | Marked lightcurve |
|---|---|---|---|---|---|---|---|
| A | 7283 | 5161 | 35 | 35 | 0.48% | 0.68% | 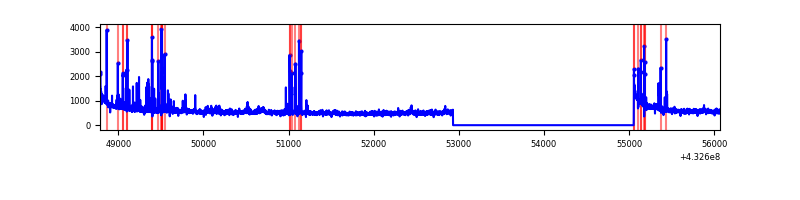 |
| B | 7283 | 5161 | 24 | 24 | 0.33% | 0.47% | 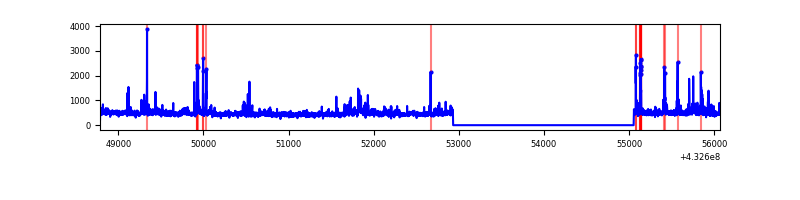 |
| C | 7283 | 5161 | 21 | 21 | 0.29% | 0.41% | 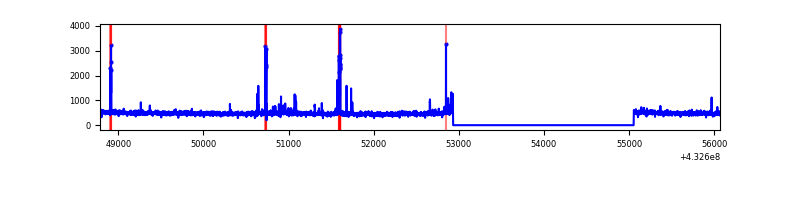 |
| D | 7283 | 5161 | 89 | 89 | 1.22% | 1.72% | 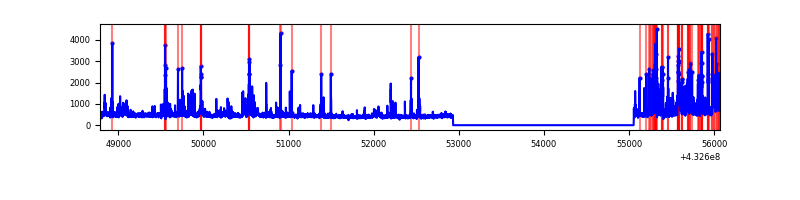 |
Top three noisy pixels from each quadrant. If the there are fewer than three noisy pixels in the level2.evt file, extra rows are filled as -1
| Pixel properties | Quadrant properties | ||||||
|---|---|---|---|---|---|---|---|
| Quadrant | DetID | PixID | Counts | Sigma | Mean | Median | Sigma |
| A | 10 | 83 | 597477 | 5045.45 | 579 | 567 | 118.3 |
| A | 15 | 237 | 197736 | 1666.59 | 579 | 567 | 118.3 |
| A | 12 | 189 | 56437 | 472.25 | 579 | 567 | 118.3 |
| B | 0 | 229 | 135277 | 1235.96 | 571 | 554 | 109.0 |
| B | 5 | 255 | 86486 | 788.34 | 571 | 554 | 109.0 |
| B | 0 | 245 | 67929 | 618.1 | 571 | 554 | 109.0 |
| C | 15 | 214 | 217584 | 1672.88 | 561 | 563 | 129.7 |
| C | 14 | 254 | 111755 | 857.11 | 561 | 563 | 129.7 |
| C | 1 | 16 | 8828 | 63.71 | 561 | 563 | 129.7 |
| D | 12 | 233 | 511635 | 3769.22 | 561 | 546 | 135.6 |
| D | 1 | 52 | 248357 | 1827.58 | 561 | 546 | 135.6 |
| D | 5 | 32 | 46429 | 338.38 | 561 | 546 | 135.6 |
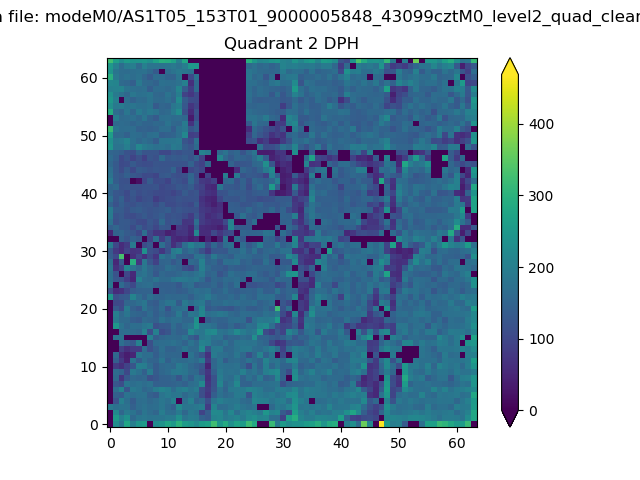
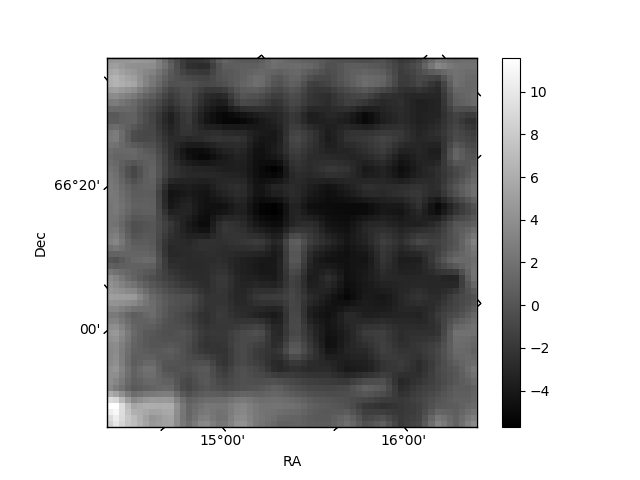
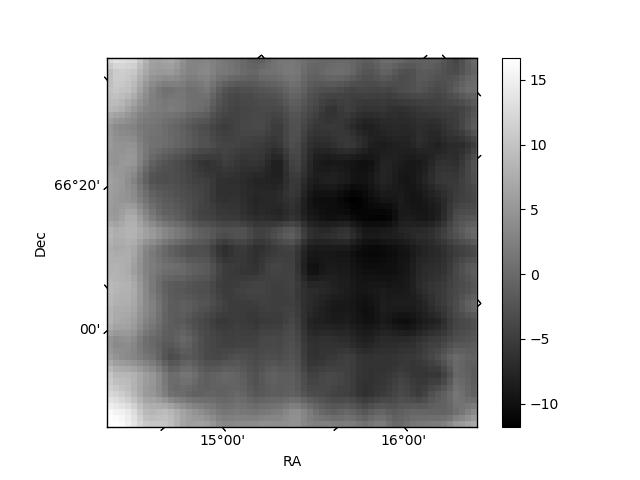
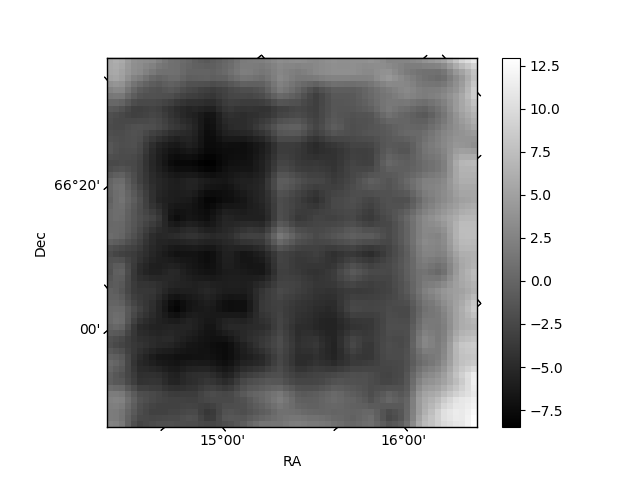
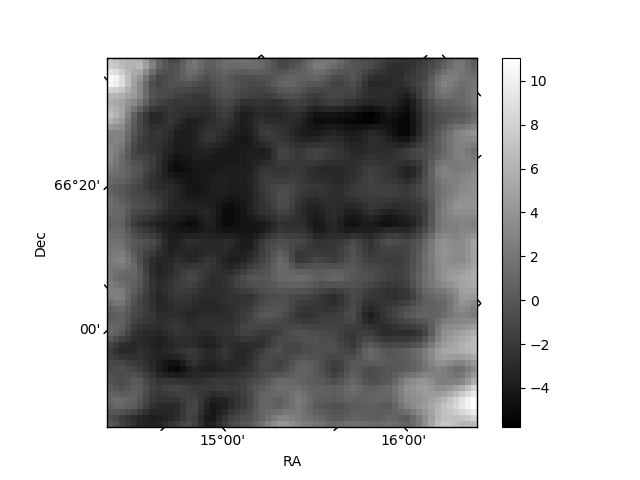
Histogram calculated using DETX and DETY for each event in the final _common_clean file
| Quadrant A | 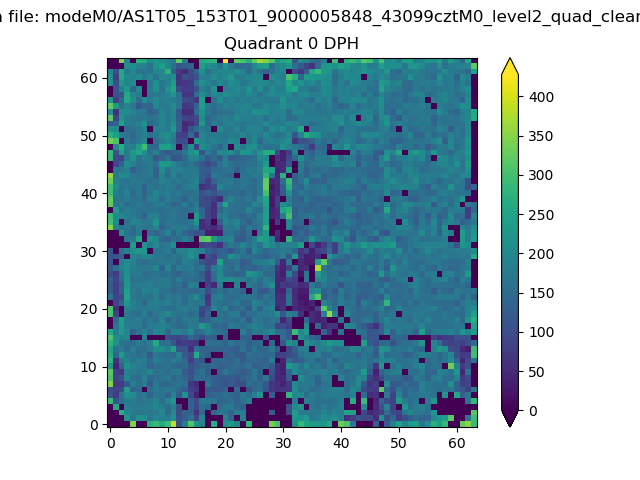 |
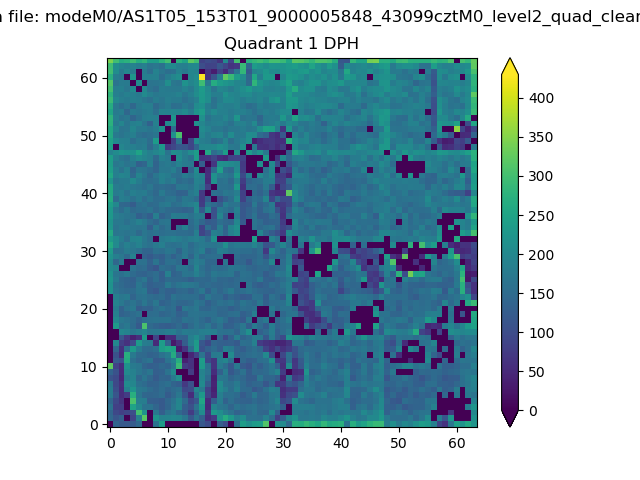 |
Quadrant B |
|---|---|---|---|
| Quadrant D | 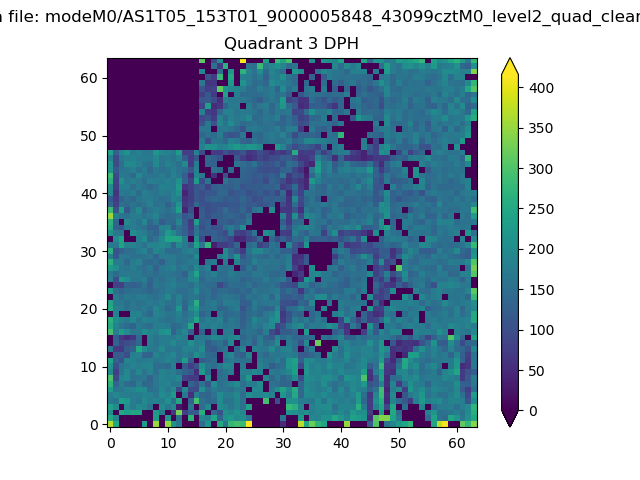 |
 |
Quadrant C |
| Plot type | Count rate plots | Images |
|---|---|---|
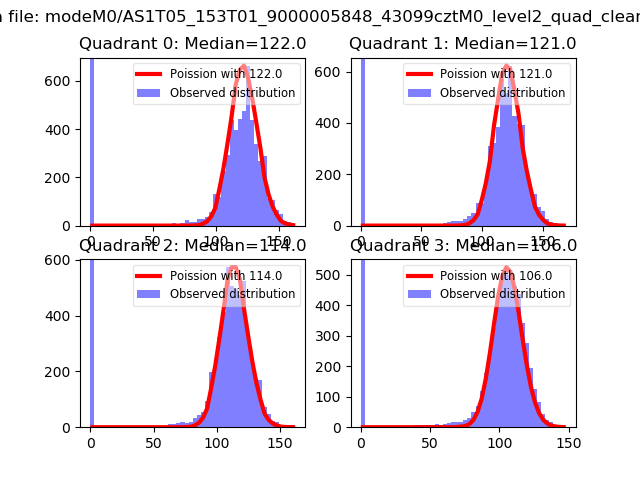
| Comparison with Poisson distribution Blue bars denote a histogram of data divided into 1 sec bins. Red curve is a Poisson curve with rate = median count rate of data. |
 |
 |
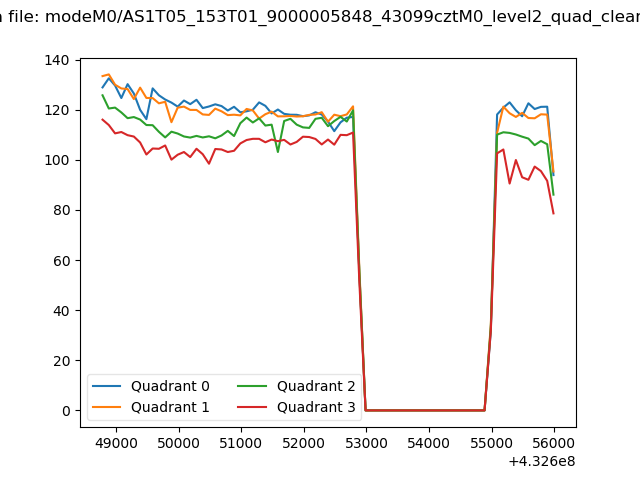
| Quadrant-wise count rates Data is divided into 100 sec bins |
 |
|
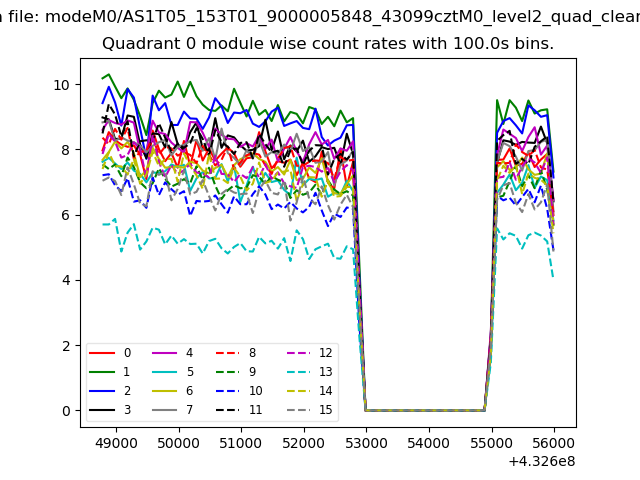
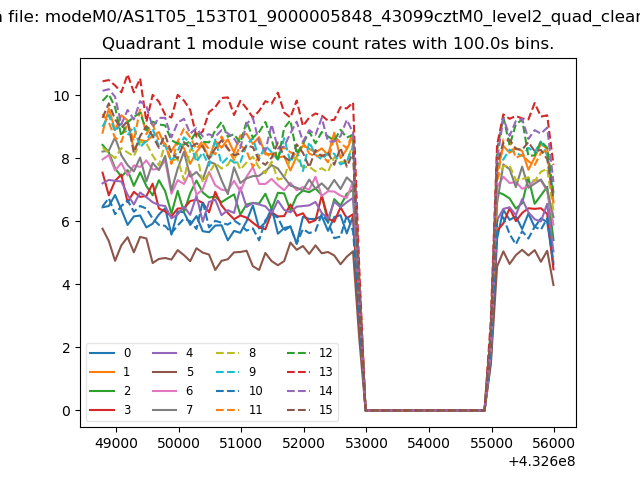
| Module-wise count rates for Quadrant A Data is divided into 100 sec bins |
 |
 |
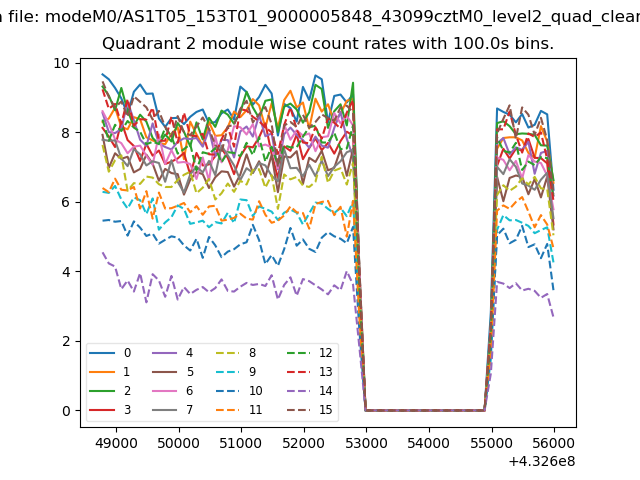
| Module-wise count rates for Quadrant B Data is divided into 100 sec bins |
 |
 |
| Module-wise count rates for Quadrant C Data is divided into 100 sec bins |
 |
 |
| Module-wise count rates for Quadrant D Data is divided into 100 sec bins |
 |
 |
| Parameter | Plot |
|---|---|
| CZT HV Monitor | 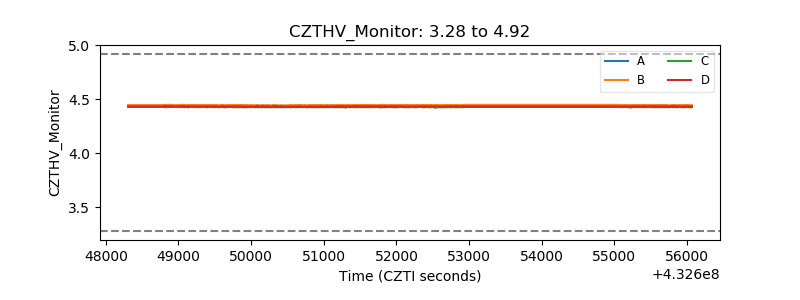 |
| D_VDD | 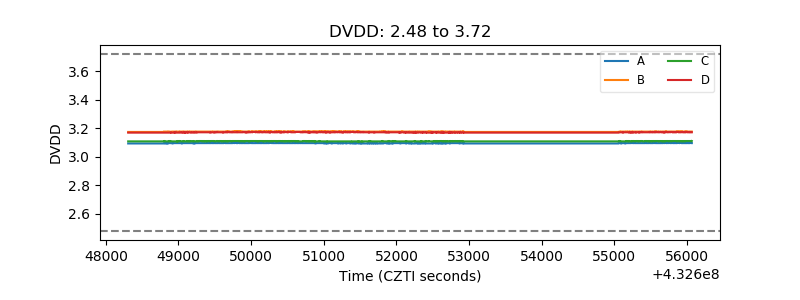 |
| Temperature 1 | 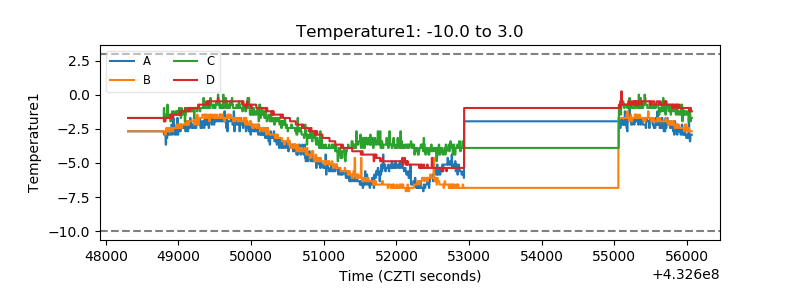 |
| Veto HV Monitor | 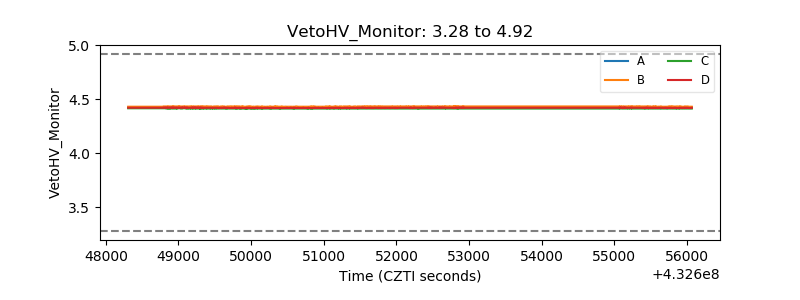 |
| Veto LLD | 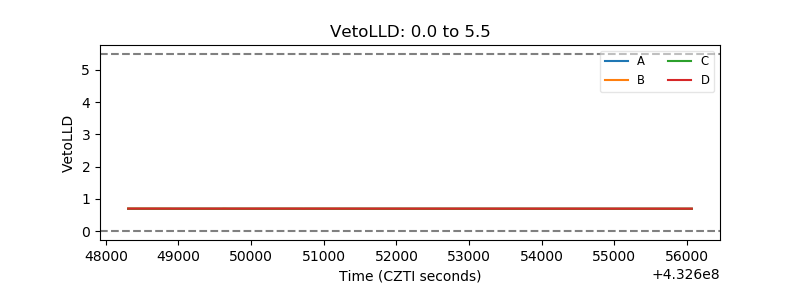 |
| Alpha Counter | 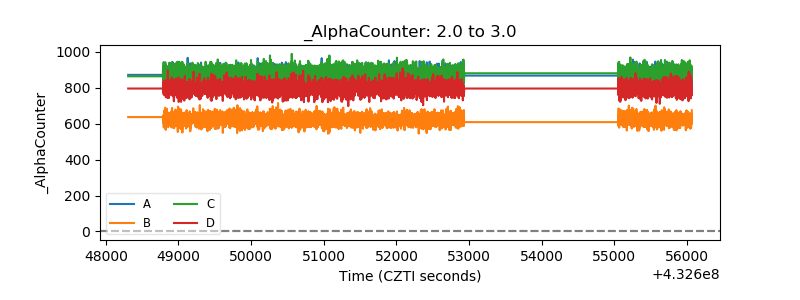 |
| _CPM_Rate | 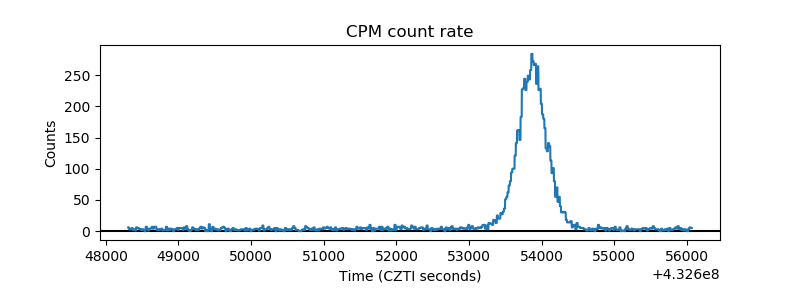 |
| CZT Counter | 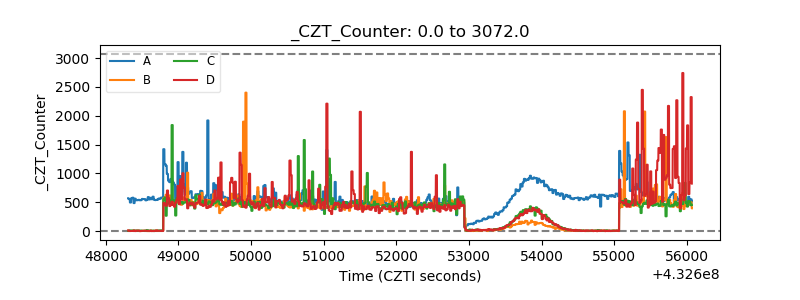 |
| +2.5 Volts monitor | 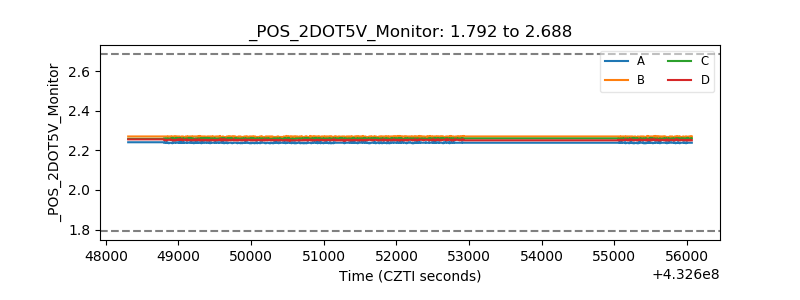 |
| +5 Volts monitor |  |
| _ROLL_ROT | 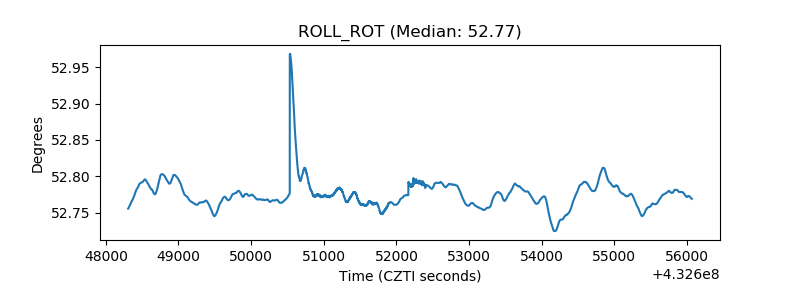 |
| _Roll_DEC | 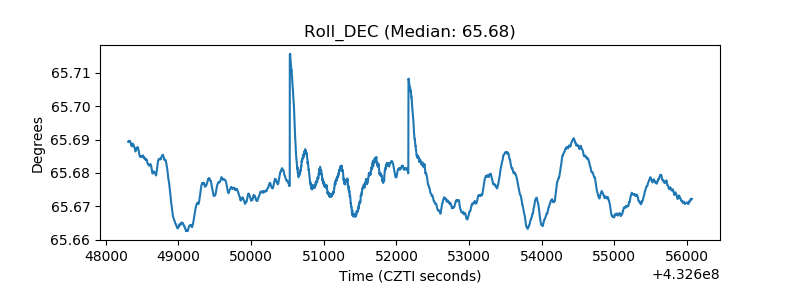 |
| _Roll_RA | 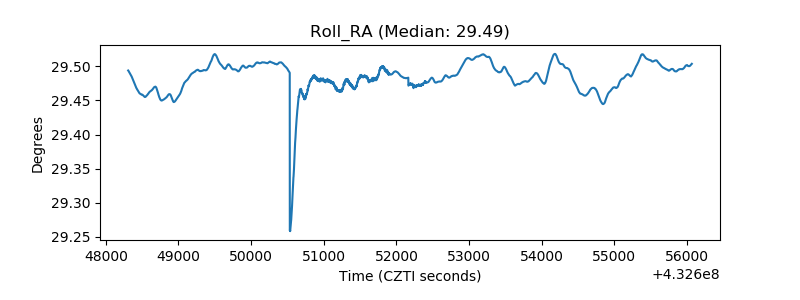 |
| Veto Counter | 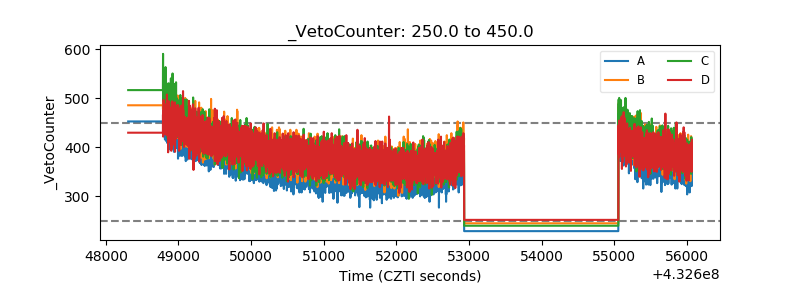 |