| Param | Original file | Final file |
|---|---|---|
| Filename | modeM0/AS1T05_153T01_9000005848_43100cztM0_level2.fits | modeM0/AS1T05_153T01_9000005848_43100cztM0_level2_quad_clean.evt |
| Size (bytes) | 331,585,920 | 87,180,480 |
| Size | 316.2 MB | 83.1 MB |
| Events in quadrant A | 2,953,616 | 597,778 |
| Events in quadrant B | 2,660,819 | 594,728 |
| Events in quadrant C | 2,636,252 | 566,154 |
| Events in quadrant D | 3,617,167 | 515,703 |
| Mode SS | |||
|---|---|---|---|
| Quadrant | BADHDUFLAG | Total packets | Discarded packets |
| A | 0 | 106 | 0 |
| B | 0 | 106 | 0 |
| C | 0 | 106 | 0 |
| D | 0 | 106 | 0 |
| Mode M9 | |||
|---|---|---|---|
| Quadrant | BADHDUFLAG | Total packets | Discarded packets |
| A | 0 | 23 | 0 |
| B | 0 | 24 | 0 |
| C | 0 | 24 | 0 |
| D | 0 | 24 | 0 |
| Mode M0 | |||
|---|---|---|---|
| Quadrant | BADHDUFLAG | Total packets | Discarded packets |
| A | 0 | 11880 | 2 |
| B | 0 | 11411 | 2 |
| C | 0 | 11194 | 2 |
| D | 0 | 14550 | 2 |
| Quadrant | Total seconds | Saturated seconds | Saturation percentage |
|---|---|---|---|
| A | 5216 | 35 | 0.671012% |
| B | 5216 | 50 | 0.958589% |
| C | 5216 | 41 | 0.786043% |
| D | 5216 | 246 | 4.716258% |
Noise dominated data is calculated using 1-second bins in cleaned event files. If a bin has >2000 counts, and if more than 50% of those come from <1% of pixels, then it is considered to be noise-dominated and hence unusable.
| Quadrant | # 1 sec bins | Bins with >0 counts | Bins with >2000 counts | High rate bins dominated by noise | Noise dominated (total time) | Noise dominated (detector-on time) | Marked lightcurve |
|---|---|---|---|---|---|---|---|
| A | 7160 | 5217 | 20 | 20 | 0.28% | 0.38% | 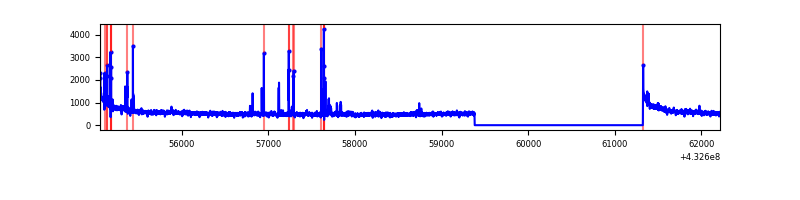 |
| B | 7160 | 5217 | 25 | 25 | 0.35% | 0.48% | 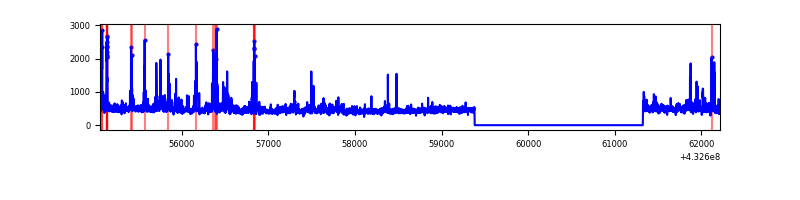 |
| C | 7160 | 5217 | 36 | 36 | 0.50% | 0.69% | 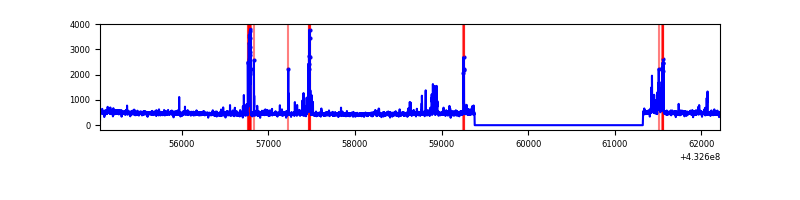 |
| D | 7160 | 5217 | 192 | 192 | 2.68% | 3.68% | 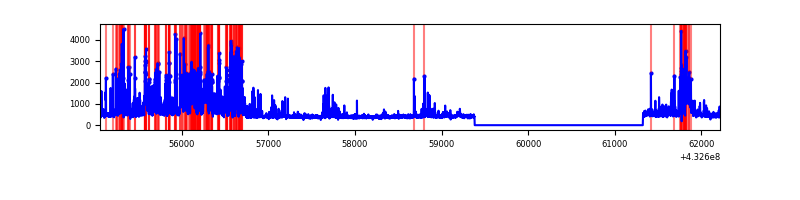 |
Top three noisy pixels from each quadrant. If the there are fewer than three noisy pixels in the level2.evt file, extra rows are filled as -1
| Pixel properties | Quadrant properties | ||||||
|---|---|---|---|---|---|---|---|
| Quadrant | DetID | PixID | Counts | Sigma | Mean | Median | Sigma |
| A | 10 | 83 | 601326 | 5201.71 | 565 | 554 | 115.5 |
| A | 15 | 237 | 106425 | 916.67 | 565 | 554 | 115.5 |
| A | 12 | 189 | 38804 | 331.18 | 565 | 554 | 115.5 |
| B | 0 | 229 | 139529 | 1286.29 | 559 | 543 | 108.1 |
| B | 0 | 245 | 109062 | 1004.32 | 559 | 543 | 108.1 |
| B | 5 | 255 | 85507 | 786.32 | 559 | 543 | 108.1 |
| C | 14 | 254 | 250827 | 1935.22 | 552 | 555 | 129.3 |
| C | 15 | 214 | 221503 | 1708.47 | 552 | 555 | 129.3 |
| C | 12 | 249 | 5049 | 34.75 | 552 | 555 | 129.3 |
| D | 12 | 233 | 879465 | 6641.87 | 546 | 528 | 132.3 |
| D | 1 | 52 | 432038 | 3260.8 | 546 | 528 | 132.3 |
| D | 5 | 171 | 78318 | 587.83 | 546 | 528 | 132.3 |
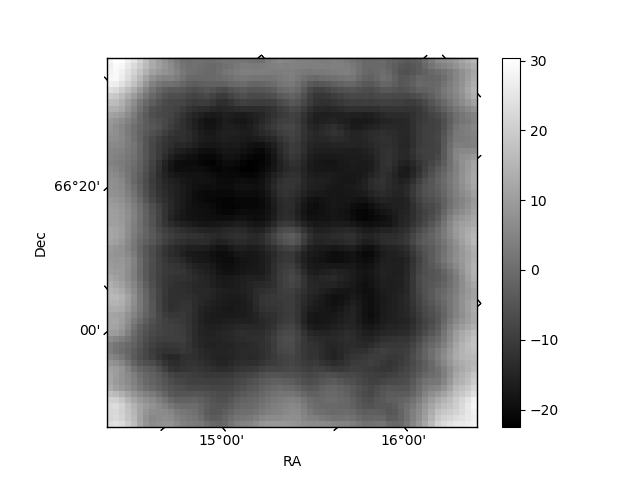
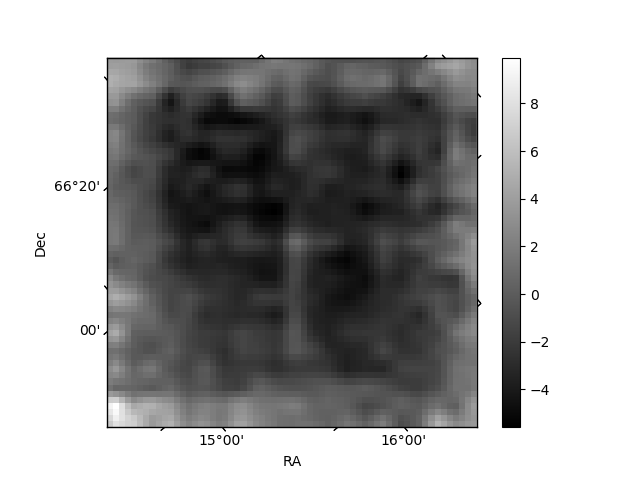
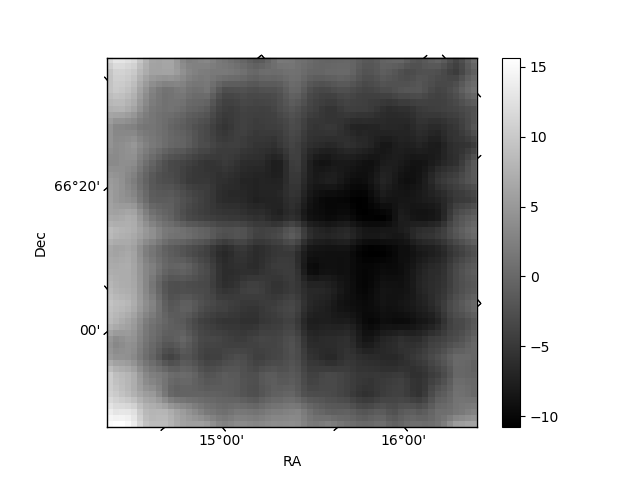
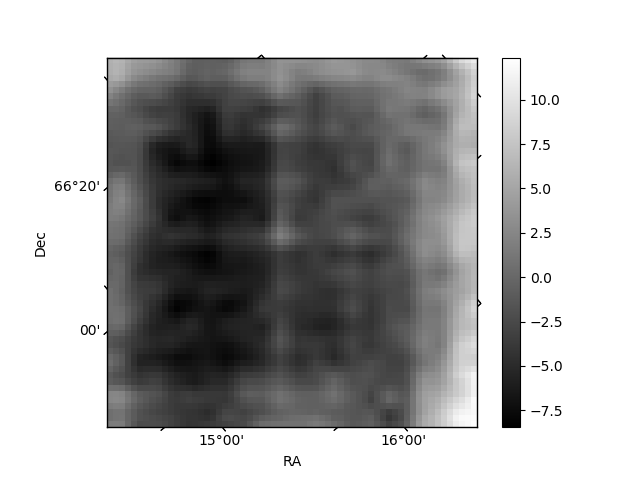
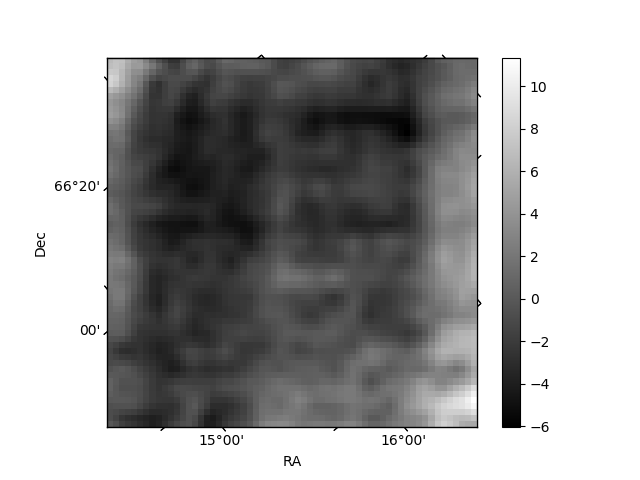
Histogram calculated using DETX and DETY for each event in the final _common_clean file
| Quadrant A | 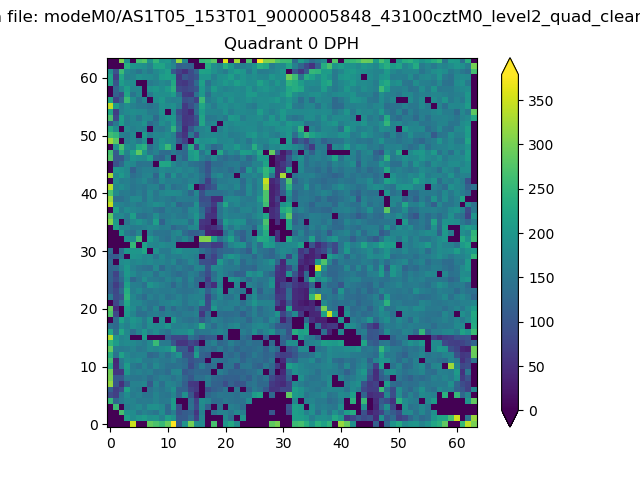 |
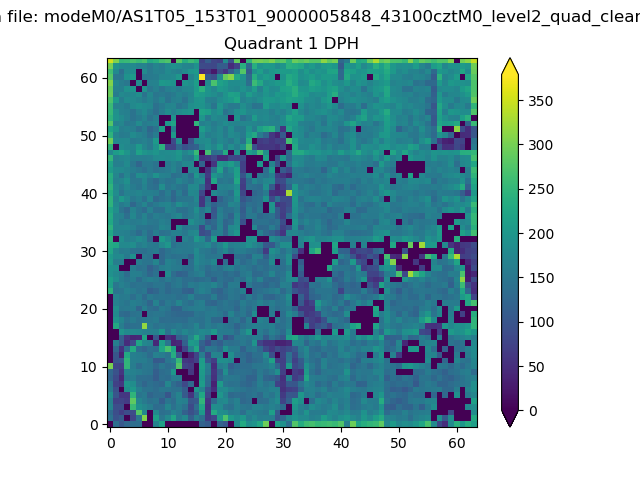 |
Quadrant B |
|---|---|---|---|
| Quadrant D | 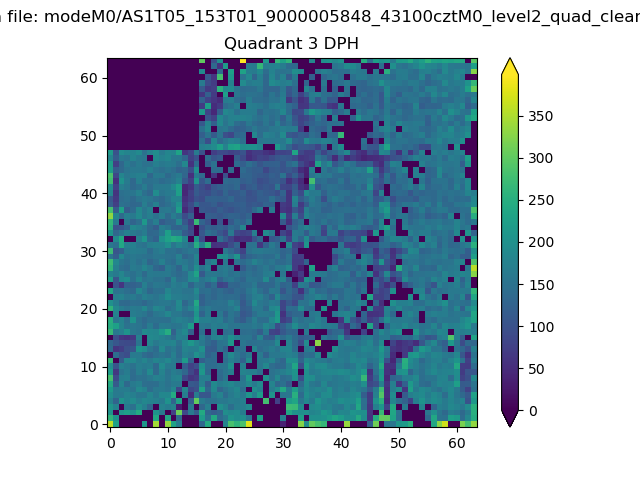 |
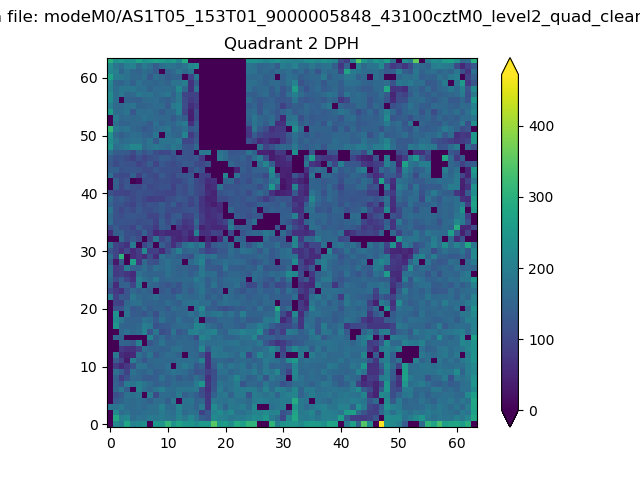 |
Quadrant C |
| Plot type | Count rate plots | Images |
|---|---|---|
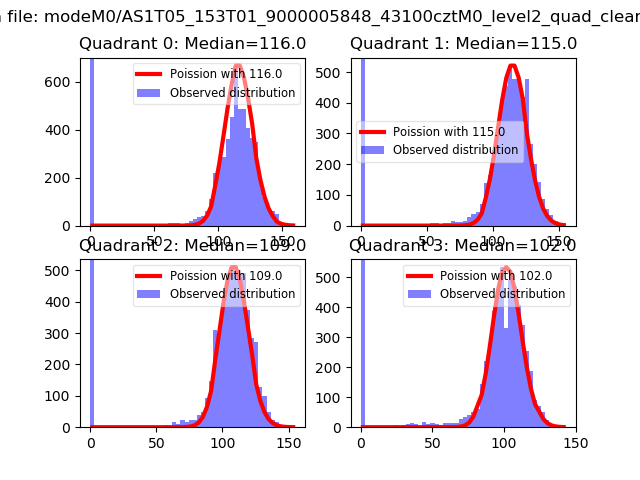
| Comparison with Poisson distribution Blue bars denote a histogram of data divided into 1 sec bins. Red curve is a Poisson curve with rate = median count rate of data. |
 |
 |
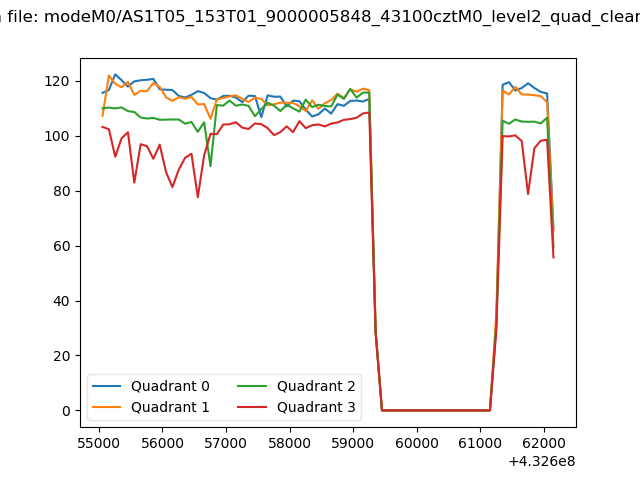
| Quadrant-wise count rates Data is divided into 100 sec bins |
 |
|
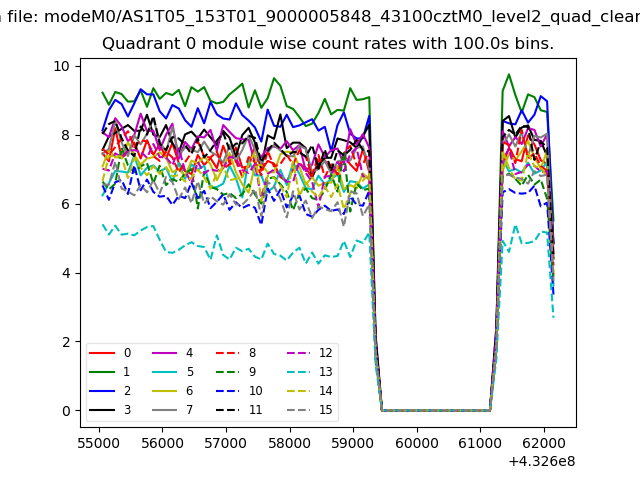
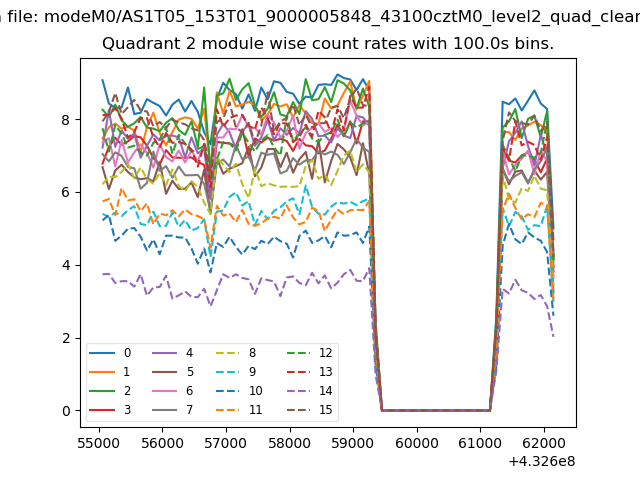
| Module-wise count rates for Quadrant A Data is divided into 100 sec bins |
 |
 |
| Module-wise count rates for Quadrant B Data is divided into 100 sec bins |
 |
 |
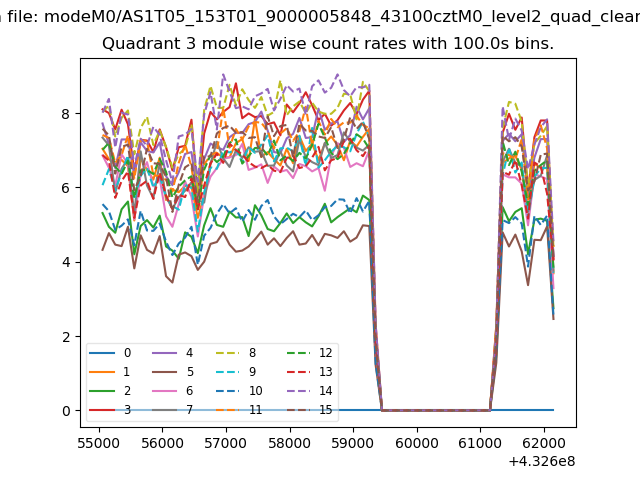
| Module-wise count rates for Quadrant C Data is divided into 100 sec bins |
 |
 |
| Module-wise count rates for Quadrant D Data is divided into 100 sec bins |
 |
 |
| Parameter | Plot |
|---|---|
| CZT HV Monitor | 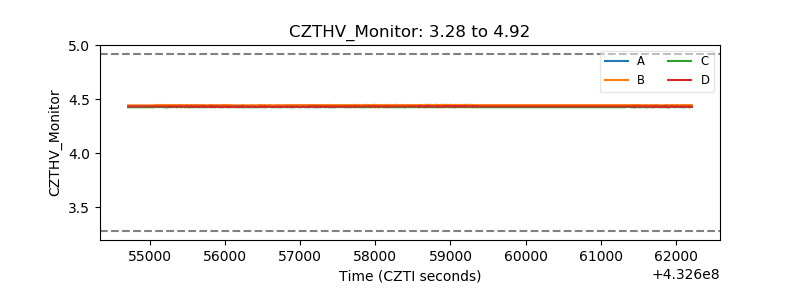 |
| D_VDD | 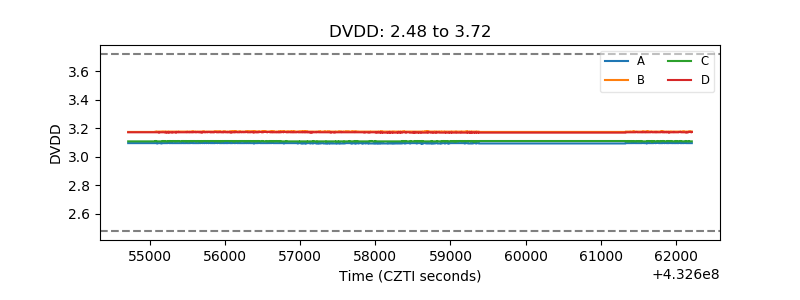 |
| Temperature 1 | 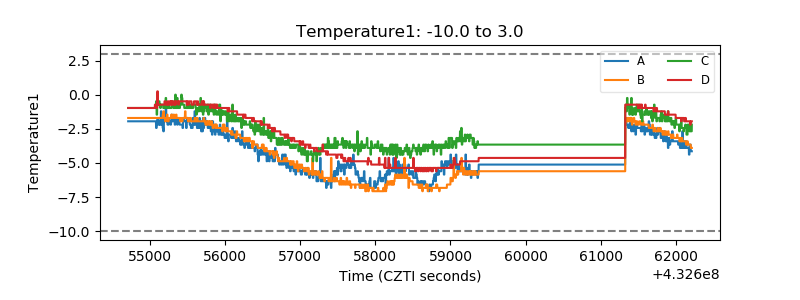 |
| Veto HV Monitor | 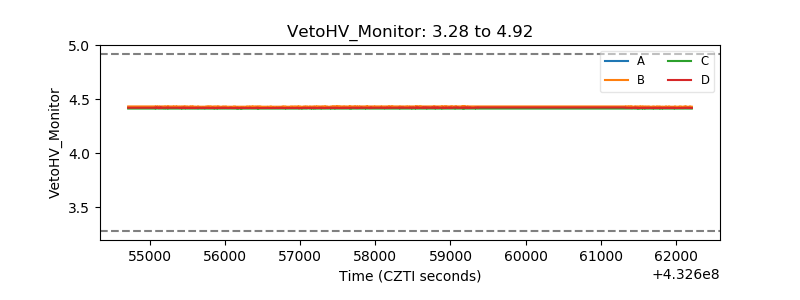 |
| Veto LLD | 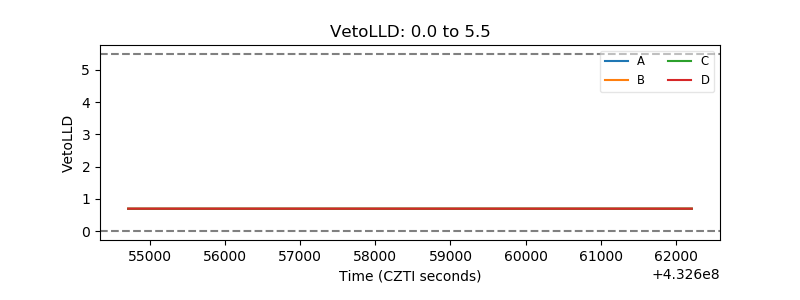 |
| Alpha Counter | 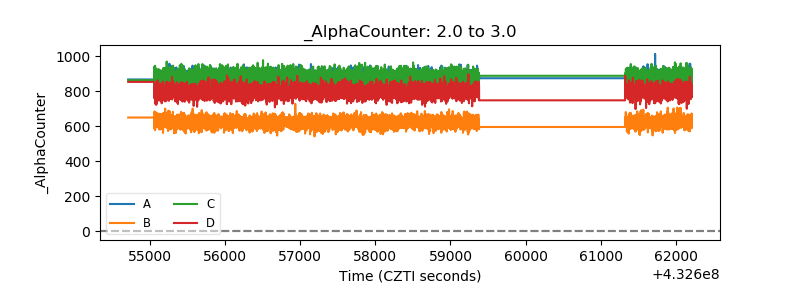 |
| _CPM_Rate | 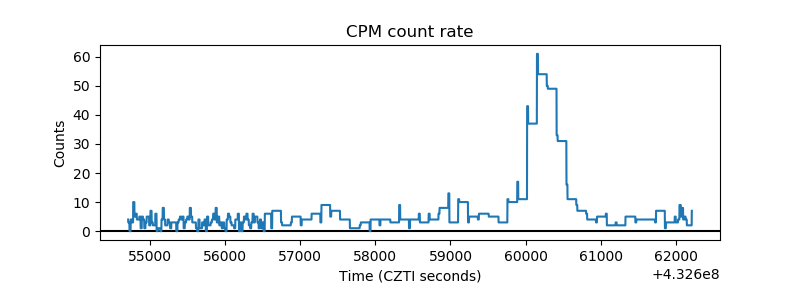 |
| CZT Counter | 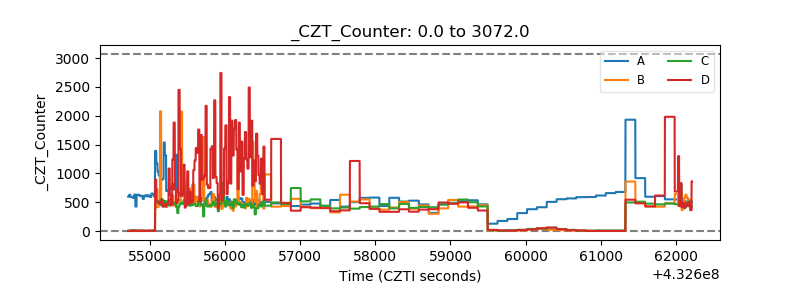 |
| +2.5 Volts monitor | 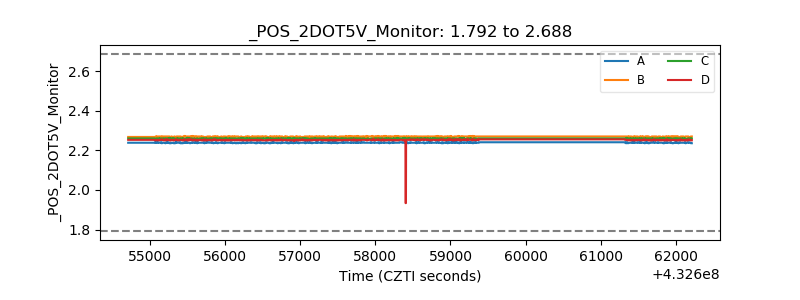 |
| +5 Volts monitor |  |
| _ROLL_ROT | 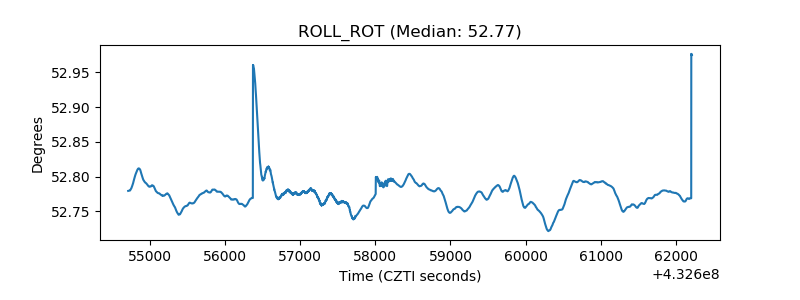 |
| _Roll_DEC | 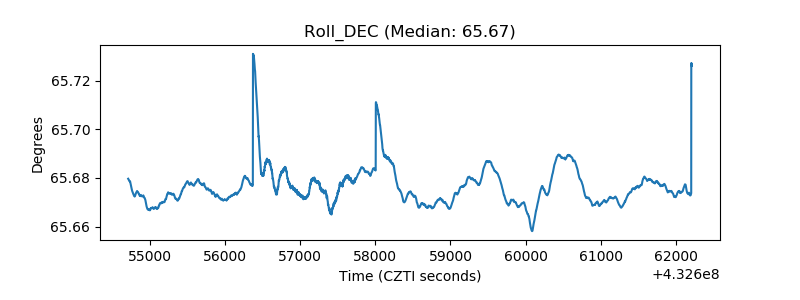 |
| _Roll_RA | 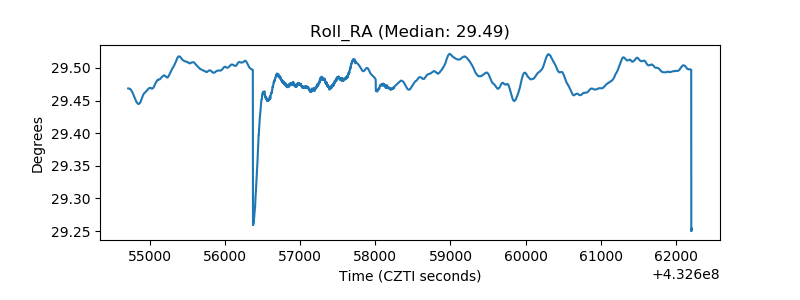 |
| Veto Counter |  |