| Param | Original file | Final file |
|---|---|---|
| Filename | modeM0/AS1T05_153T01_9000005848_43101cztM0_level2.fits | modeM0/AS1T05_153T01_9000005848_43101cztM0_level2_quad_clean.evt |
| Size (bytes) | 307,716,480 | 89,222,400 |
| Size | 293.5 MB | 85.1 MB |
| Events in quadrant A | 3,011,669 | 601,839 |
| Events in quadrant B | 2,535,862 | 606,125 |
| Events in quadrant C | 2,631,944 | 580,596 |
| Events in quadrant D | 2,791,560 | 536,652 |
| Mode SS | |||
|---|---|---|---|
| Quadrant | BADHDUFLAG | Total packets | Discarded packets |
| A | 0 | 108 | 0 |
| B | 0 | 108 | 0 |
| C | 0 | 108 | 0 |
| D | 0 | 108 | 0 |
| Mode M9 | |||
|---|---|---|---|
| Quadrant | BADHDUFLAG | Total packets | Discarded packets |
| A | 0 | 20 | 0 |
| B | 0 | 21 | 0 |
| C | 0 | 21 | 0 |
| D | 0 | 21 | 0 |
| Mode M0 | |||
|---|---|---|---|
| Quadrant | BADHDUFLAG | Total packets | Discarded packets |
| A | 0 | 12318 | 2 |
| B | 0 | 11317 | 3 |
| C | 0 | 11340 | 2 |
| D | 0 | 12264 | 2 |
| Quadrant | Total seconds | Saturated seconds | Saturation percentage |
|---|---|---|---|
| A | 5383 | 47 | 0.873119% |
| B | 5382 | 13 | 0.241546% |
| C | 5382 | 19 | 0.353029% |
| D | 5382 | 76 | 1.412114% |
Noise dominated data is calculated using 1-second bins in cleaned event files. If a bin has >2000 counts, and if more than 50% of those come from <1% of pixels, then it is considered to be noise-dominated and hence unusable.
| Quadrant | # 1 sec bins | Bins with >0 counts | Bins with >2000 counts | High rate bins dominated by noise | Noise dominated (total time) | Noise dominated (detector-on time) | Marked lightcurve |
|---|---|---|---|---|---|---|---|
| A | 6967 | 5384 | 32 | 32 | 0.46% | 0.59% | 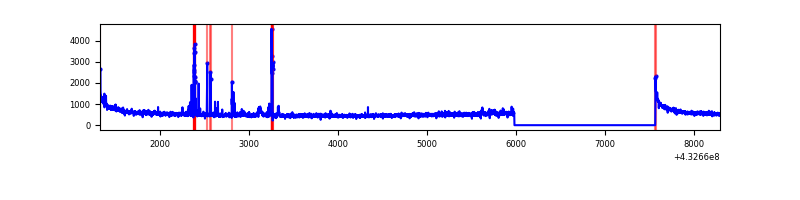 |
| B | 6966 | 5383 | 4 | 4 | 0.06% | 0.07% | 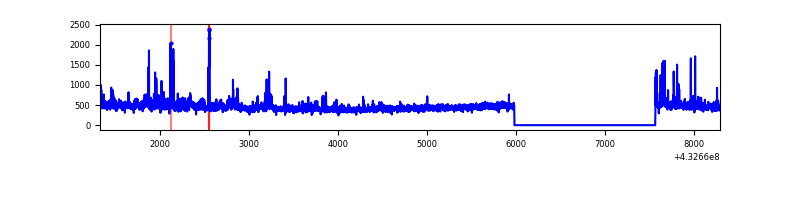 |
| C | 6966 | 5383 | 13 | 13 | 0.19% | 0.24% | 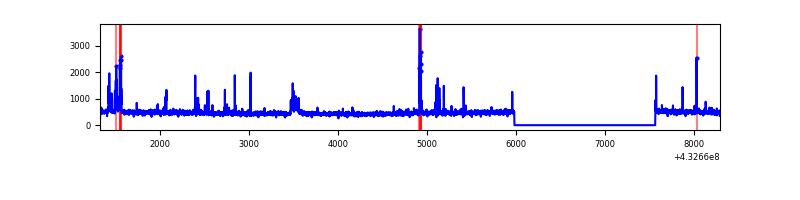 |
| D | 6966 | 5383 | 55 | 55 | 0.79% | 1.02% | 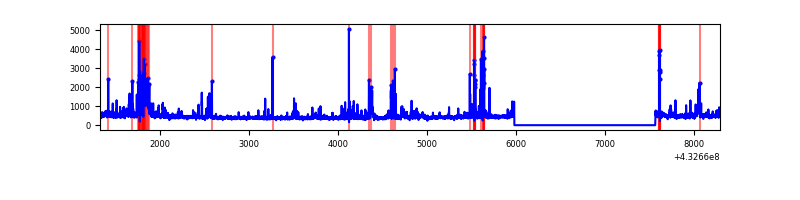 |
Top three noisy pixels from each quadrant. If the there are fewer than three noisy pixels in the level2.evt file, extra rows are filled as -1
| Pixel properties | Quadrant properties | ||||||
|---|---|---|---|---|---|---|---|
| Quadrant | DetID | PixID | Counts | Sigma | Mean | Median | Sigma |
| A | 10 | 83 | 598060 | 5082.52 | 573 | 561 | 117.6 |
| A | 15 | 237 | 125241 | 1060.57 | 573 | 561 | 117.6 |
| A | 12 | 189 | 57731 | 486.3 | 573 | 561 | 117.6 |
| B | 0 | 229 | 92982 | 833.67 | 571 | 555 | 110.9 |
| B | 0 | 245 | 74270 | 664.89 | 571 | 555 | 110.9 |
| B | 5 | 255 | 67147 | 600.64 | 571 | 555 | 110.9 |
| C | 15 | 214 | 240750 | 1821.53 | 563 | 565 | 131.9 |
| C | 14 | 254 | 173796 | 1313.76 | 563 | 565 | 131.9 |
| C | 8 | 79 | 11785 | 85.09 | 563 | 565 | 131.9 |
| D | 1 | 52 | 441455 | 3224.18 | 561 | 545 | 136.8 |
| D | 12 | 6 | 102699 | 747.01 | 561 | 545 | 136.8 |
| D | 5 | 32 | 43934 | 317.28 | 561 | 545 | 136.8 |
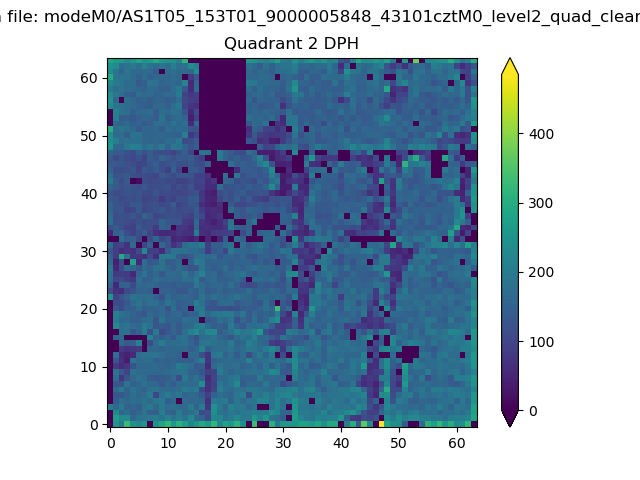
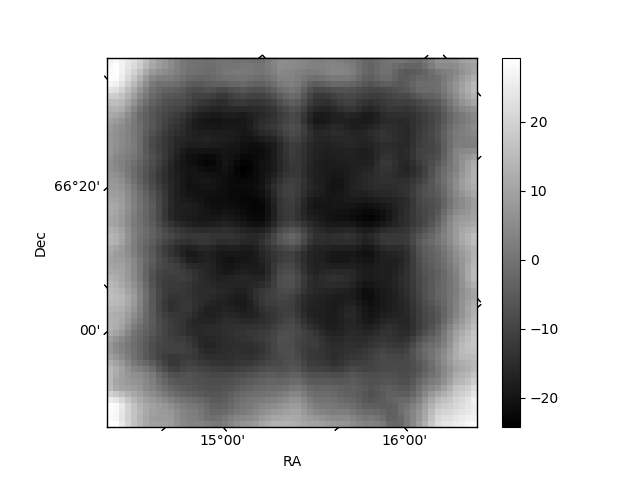
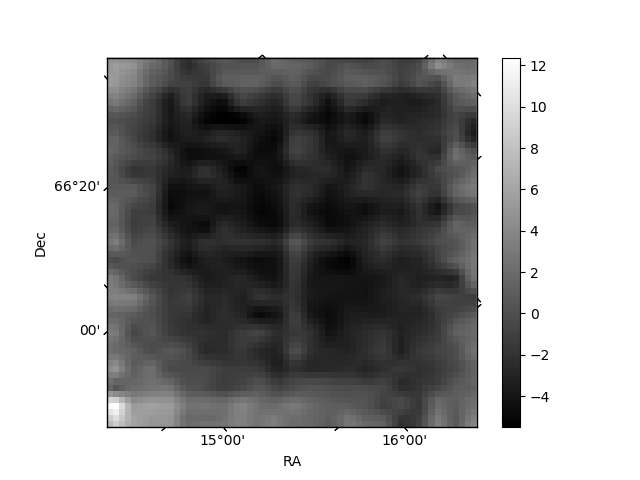
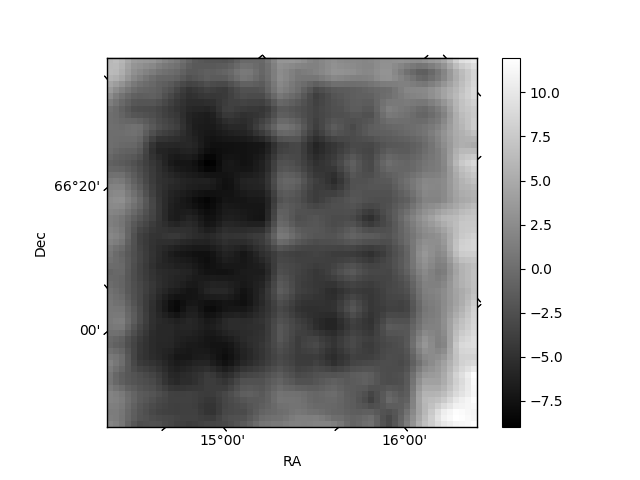
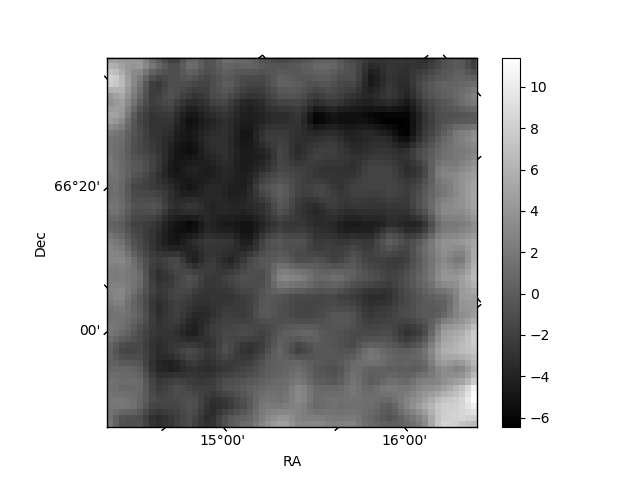
Histogram calculated using DETX and DETY for each event in the final _common_clean file
| Quadrant A | 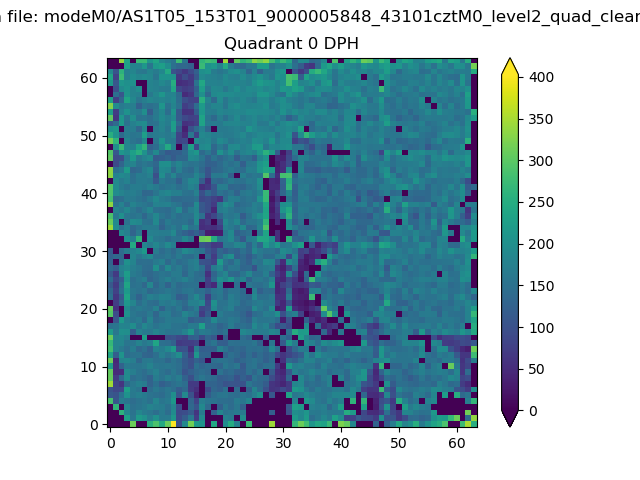 |
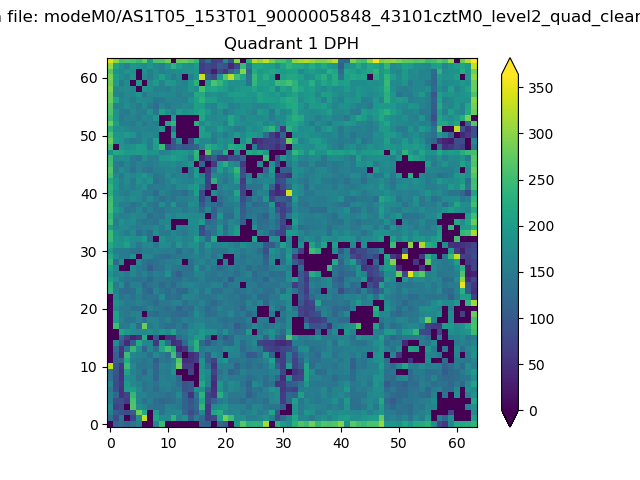 |
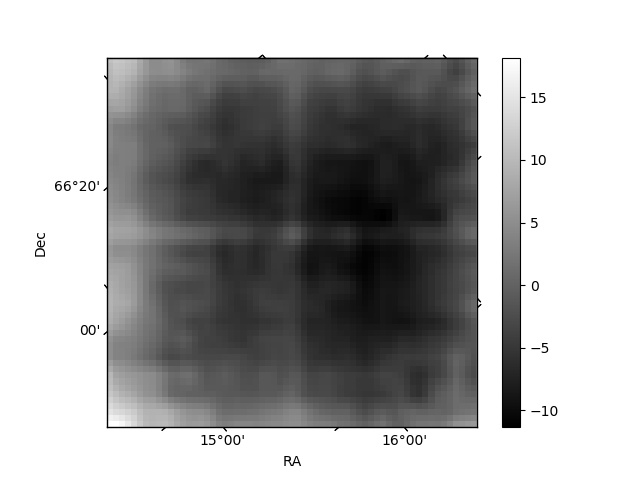
Quadrant B |
|---|---|---|---|
| Quadrant D | 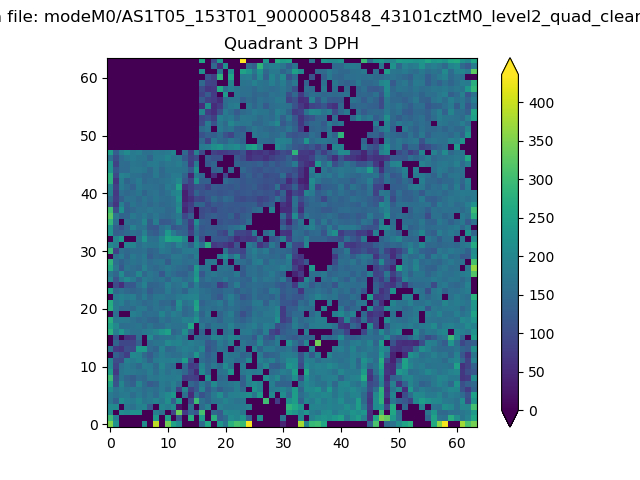 |
 |
Quadrant C |
| Plot type | Count rate plots | Images |
|---|---|---|
| Comparison with Poisson distribution Blue bars denote a histogram of data divided into 1 sec bins. Red curve is a Poisson curve with rate = median count rate of data. |
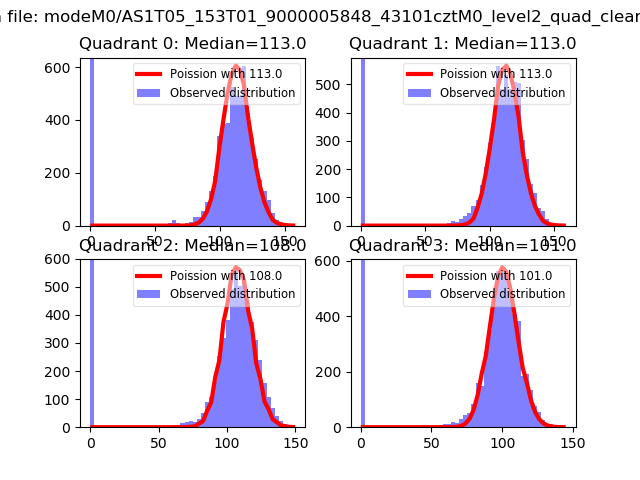 |
 |
| Quadrant-wise count rates Data is divided into 100 sec bins |
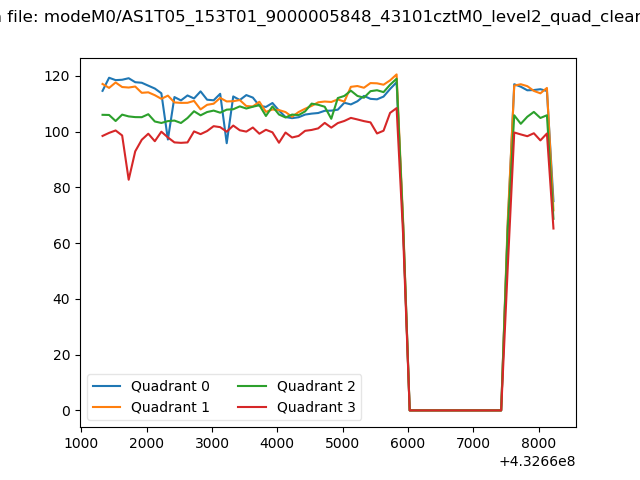 |
|
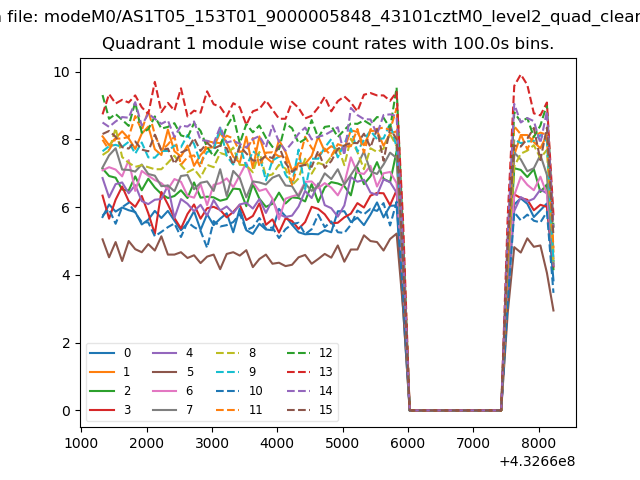
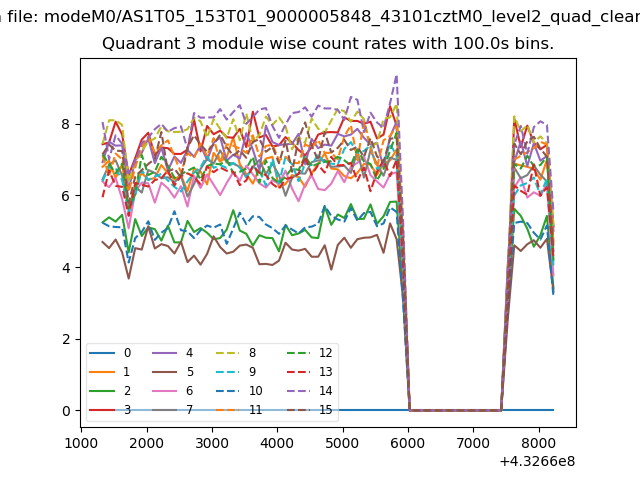
| Module-wise count rates for Quadrant A Data is divided into 100 sec bins |
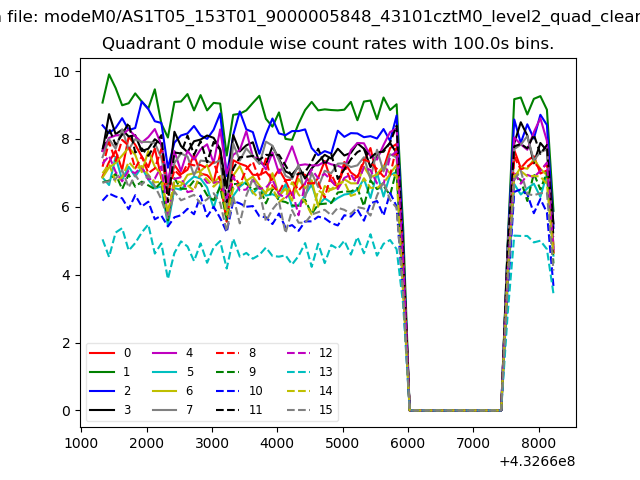 |
 |
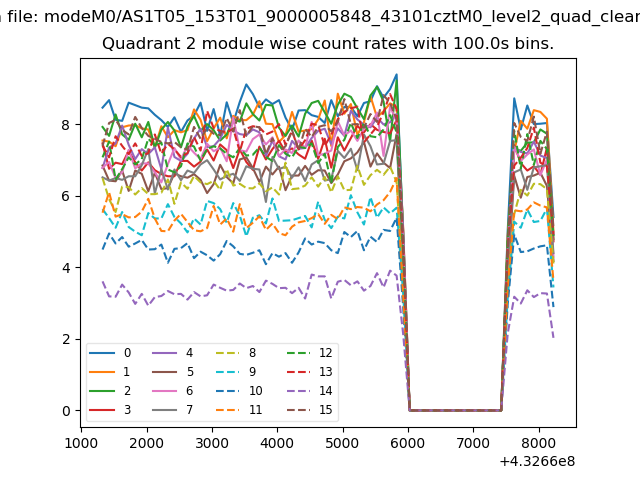
| Module-wise count rates for Quadrant B Data is divided into 100 sec bins |
 |
 |
| Module-wise count rates for Quadrant C Data is divided into 100 sec bins |
 |
 |
| Module-wise count rates for Quadrant D Data is divided into 100 sec bins |
 |
 |
| Parameter | Plot |
|---|---|
| CZT HV Monitor | 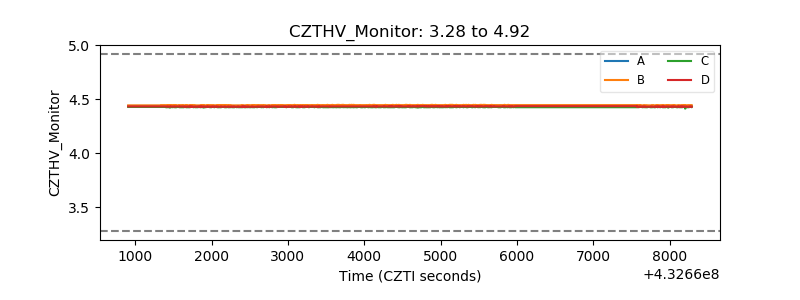 |
| D_VDD | 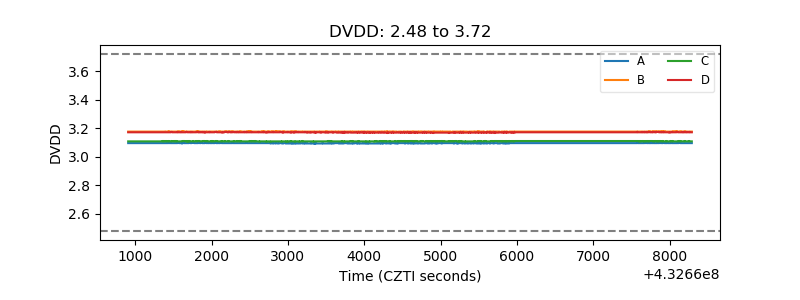 |
| Temperature 1 | 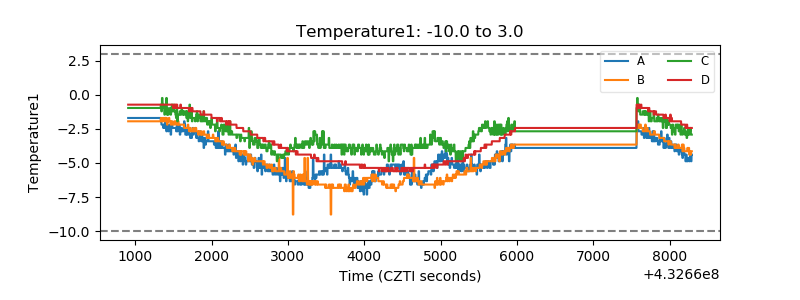 |
| Veto HV Monitor |  |
| Veto LLD | 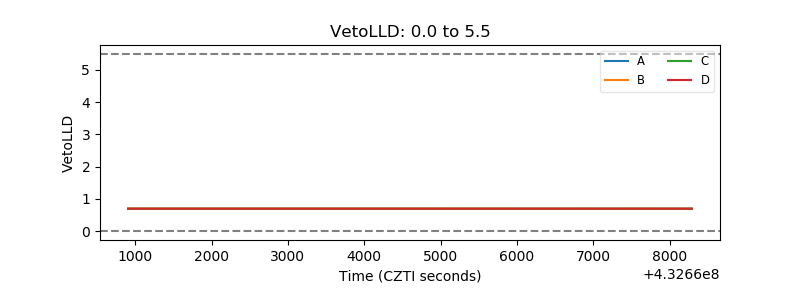 |
| Alpha Counter | 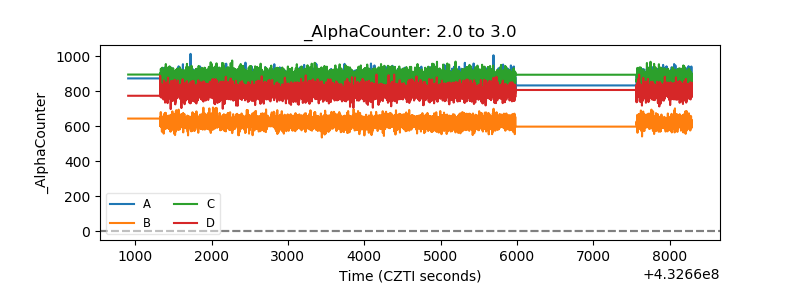 |
| _CPM_Rate | 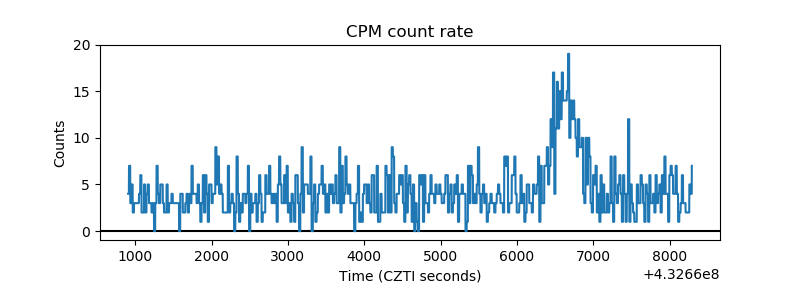 |
| CZT Counter | 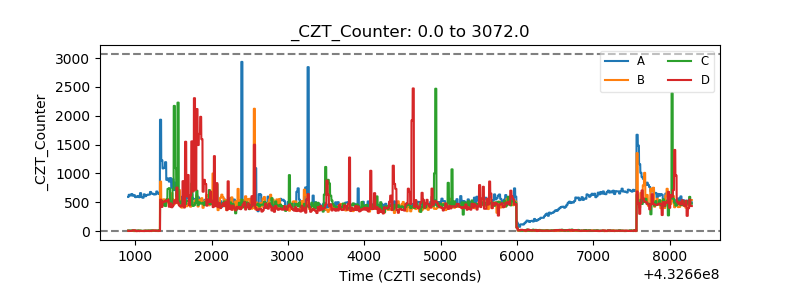 |
| +2.5 Volts monitor | 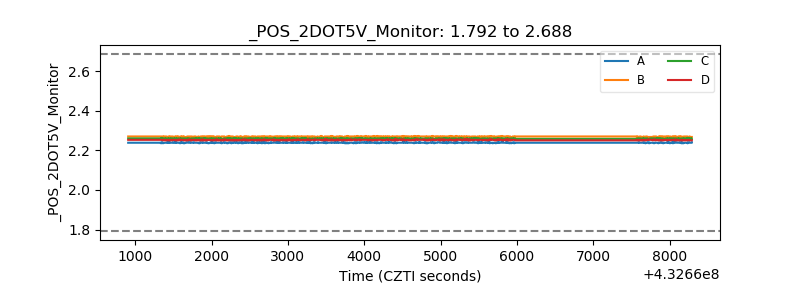 |
| +5 Volts monitor | 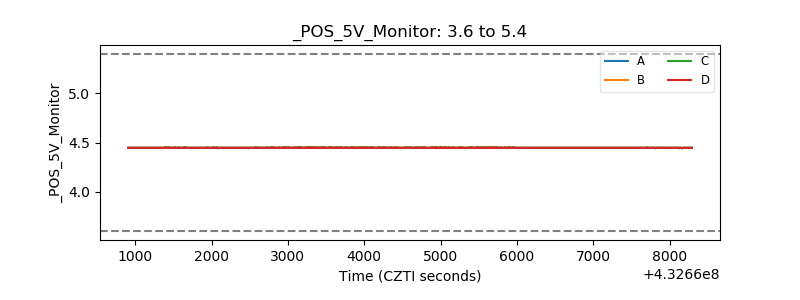 |
| _ROLL_ROT | 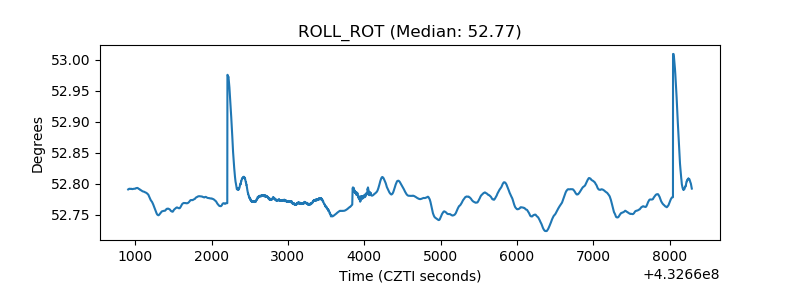 |
| _Roll_DEC | 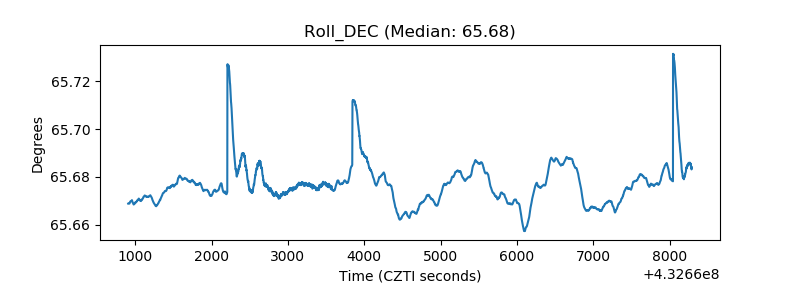 |
| _Roll_RA | 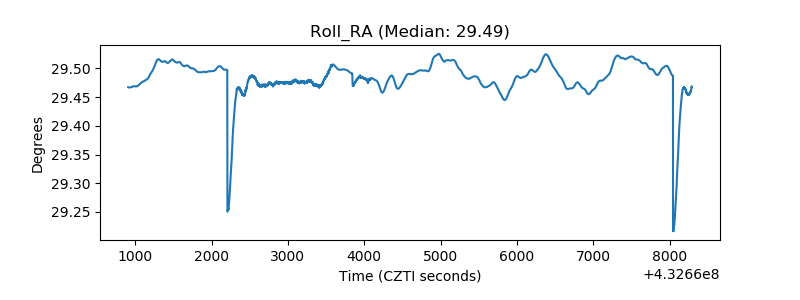 |
| Veto Counter | 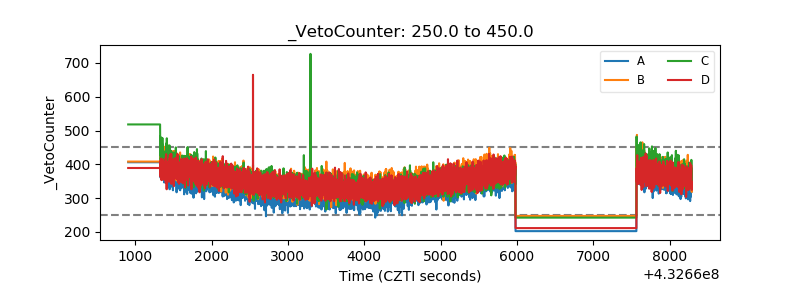 |