| Param | Original file | Final file |
|---|---|---|
| Filename | modeM0/AS1T05_153T01_9000005848_43102cztM0_level2.fits | modeM0/AS1T05_153T01_9000005848_43102cztM0_level2_quad_clean.evt |
| Size (bytes) | 324,541,440 | 93,303,360 |
| Size | 309.5 MB | 89.0 MB |
| Events in quadrant A | 3,528,937 | 617,377 |
| Events in quadrant B | 2,616,570 | 631,895 |
| Events in quadrant C | 2,726,578 | 611,000 |
| Events in quadrant D | 2,697,067 | 566,224 |
| Mode SS | |||
|---|---|---|---|
| Quadrant | BADHDUFLAG | Total packets | Discarded packets |
| A | 0 | 116 | 0 |
| B | 0 | 116 | 0 |
| C | 0 | 116 | 0 |
| D | 0 | 116 | 0 |
| Mode M9 | |||
|---|---|---|---|
| Quadrant | BADHDUFLAG | Total packets | Discarded packets |
| A | 0 | 17 | 0 |
| B | 0 | 18 | 0 |
| C | 0 | 18 | 0 |
| D | 0 | 18 | 0 |
| Mode M0 | |||
|---|---|---|---|
| Quadrant | BADHDUFLAG | Total packets | Discarded packets |
| A | 0 | 14049 | 2 |
| B | 0 | 11814 | 2 |
| C | 0 | 11800 | 2 |
| D | 0 | 12280 | 2 |
| Quadrant | Total seconds | Saturated seconds | Saturation percentage |
|---|---|---|---|
| A | 5700 | 134 | 2.350877% |
| B | 5700 | 17 | 0.298246% |
| C | 5700 | 8 | 0.140351% |
| D | 5700 | 36 | 0.631579% |
Noise dominated data is calculated using 1-second bins in cleaned event files. If a bin has >2000 counts, and if more than 50% of those come from <1% of pixels, then it is considered to be noise-dominated and hence unusable.
| Quadrant | # 1 sec bins | Bins with >0 counts | Bins with >2000 counts | High rate bins dominated by noise | Noise dominated (total time) | Noise dominated (detector-on time) | Marked lightcurve |
|---|---|---|---|---|---|---|---|
| A | 7044 | 5701 | 93 | 93 | 1.32% | 1.63% | 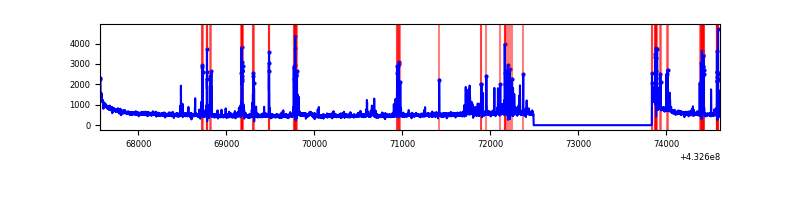 |
| B | 7044 | 5701 | 7 | 7 | 0.10% | 0.12% | 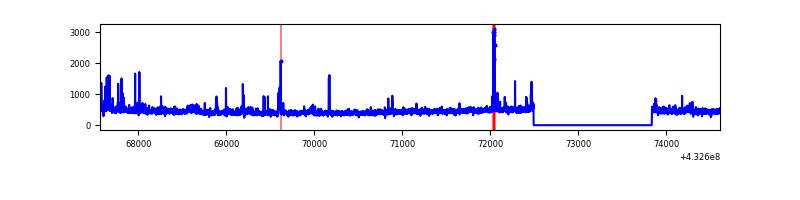 |
| C | 7044 | 5701 | 5 | 5 | 0.07% | 0.09% | 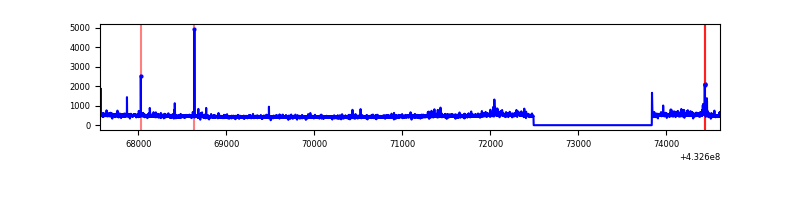 |
| D | 7044 | 5701 | 40 | 40 | 0.57% | 0.70% | 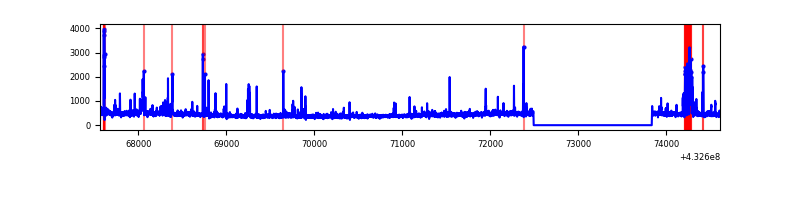 |
Top three noisy pixels from each quadrant. If the there are fewer than three noisy pixels in the level2.evt file, extra rows are filled as -1
| Pixel properties | Quadrant properties | ||||||
|---|---|---|---|---|---|---|---|
| Quadrant | DetID | PixID | Counts | Sigma | Mean | Median | Sigma |
| A | 10 | 83 | 616486 | 4927.33 | 605 | 592 | 125.0 |
| A | 15 | 237 | 465489 | 3719.31 | 605 | 592 | 125.0 |
| A | 12 | 189 | 88711 | 704.98 | 605 | 592 | 125.0 |
| B | 5 | 255 | 79587 | 671.95 | 604 | 586 | 117.6 |
| B | 0 | 229 | 68971 | 581.65 | 604 | 586 | 117.6 |
| B | 0 | 245 | 48050 | 403.71 | 604 | 586 | 117.6 |
| C | 15 | 214 | 254586 | 1808.21 | 598 | 599 | 140.5 |
| C | 0 | 207 | 51136 | 359.79 | 598 | 599 | 140.5 |
| C | 14 | 254 | 40746 | 285.82 | 598 | 599 | 140.5 |
| D | 1 | 52 | 143481 | 983.86 | 596 | 577 | 145.2 |
| D | 12 | 233 | 137321 | 941.45 | 596 | 577 | 145.2 |
| D | 5 | 32 | 51297 | 349.19 | 596 | 577 | 145.2 |
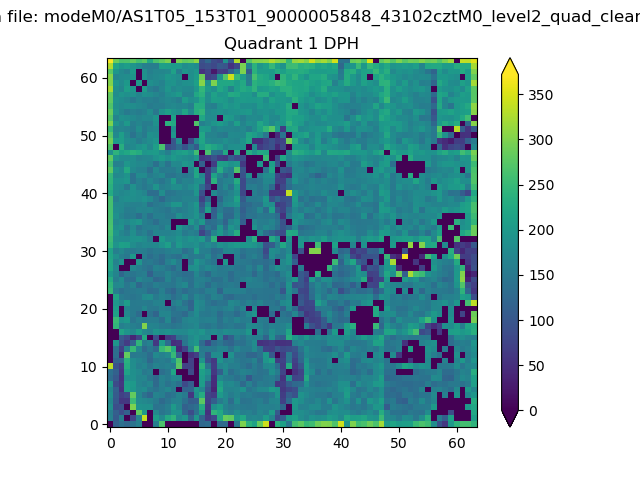
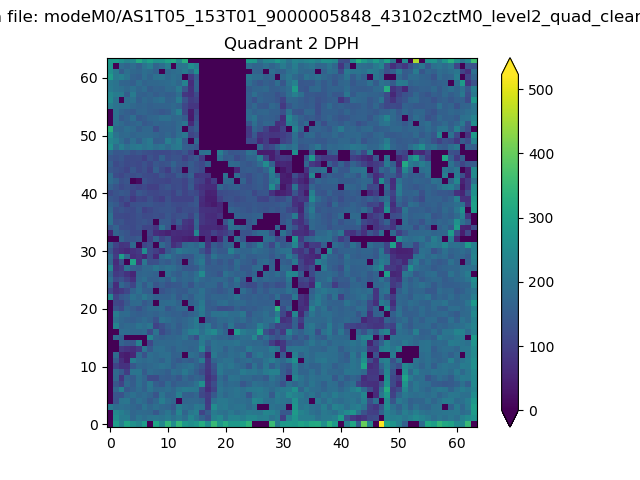
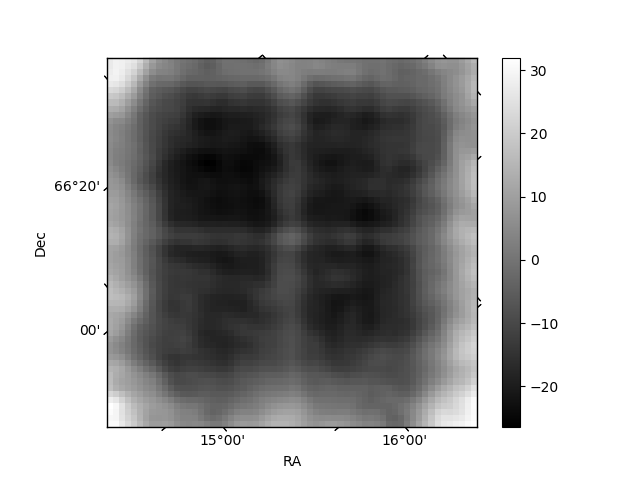
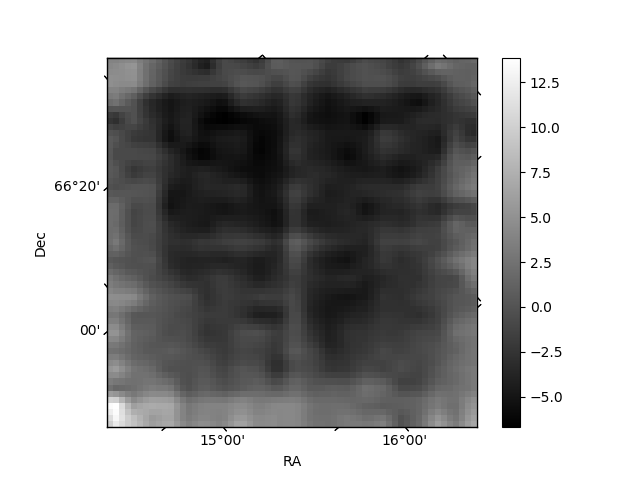
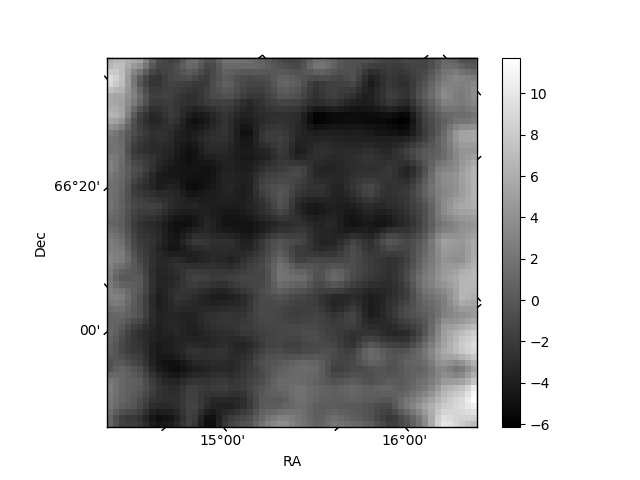
Histogram calculated using DETX and DETY for each event in the final _common_clean file
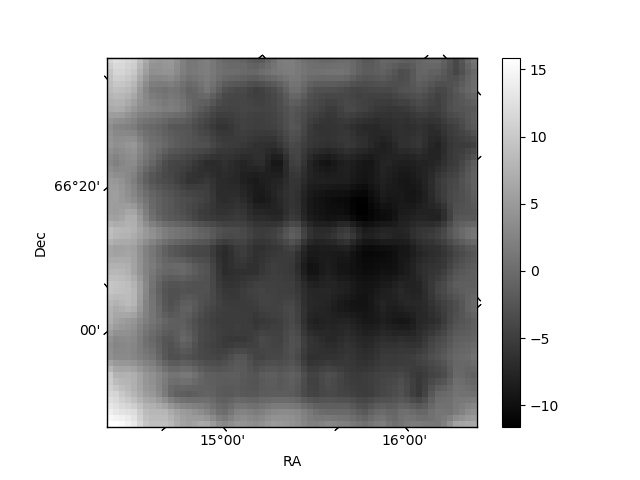
| Quadrant A |  |
 |
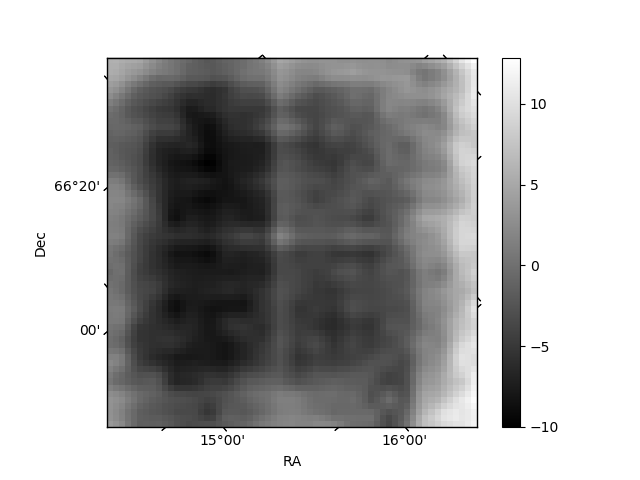
Quadrant B |
|---|---|---|---|
| Quadrant D | 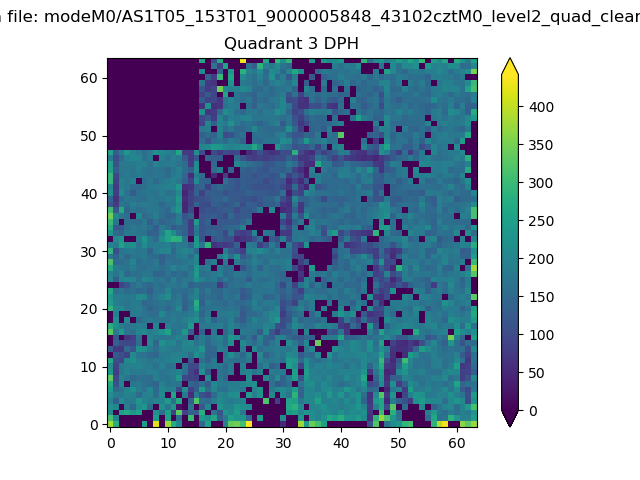 |
 |
Quadrant C |
| Plot type | Count rate plots | Images |
|---|---|---|
| Comparison with Poisson distribution Blue bars denote a histogram of data divided into 1 sec bins. Red curve is a Poisson curve with rate = median count rate of data. |
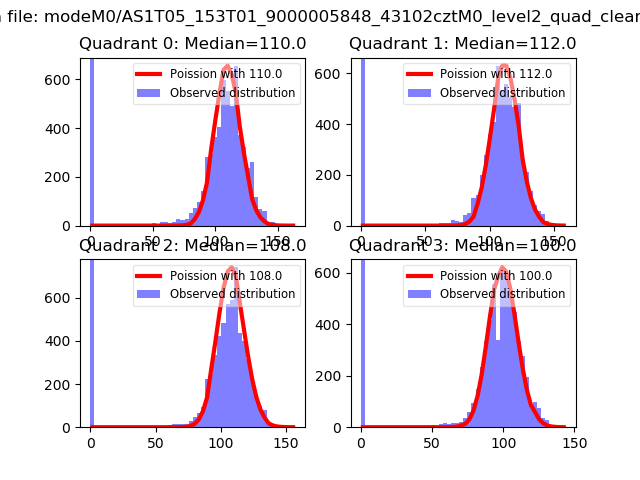 |
 |
| Quadrant-wise count rates Data is divided into 100 sec bins |
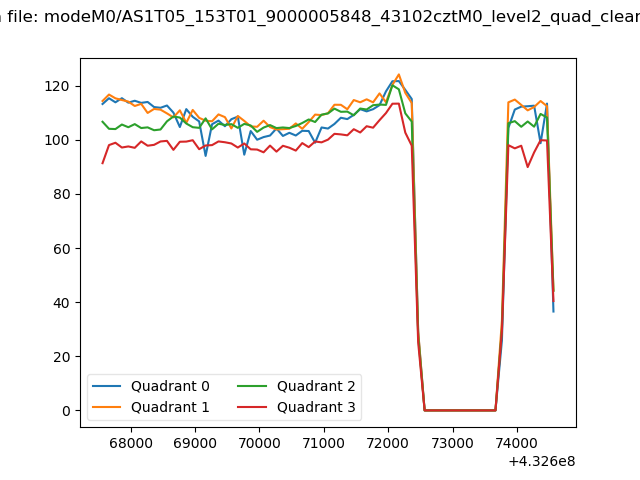 |
|
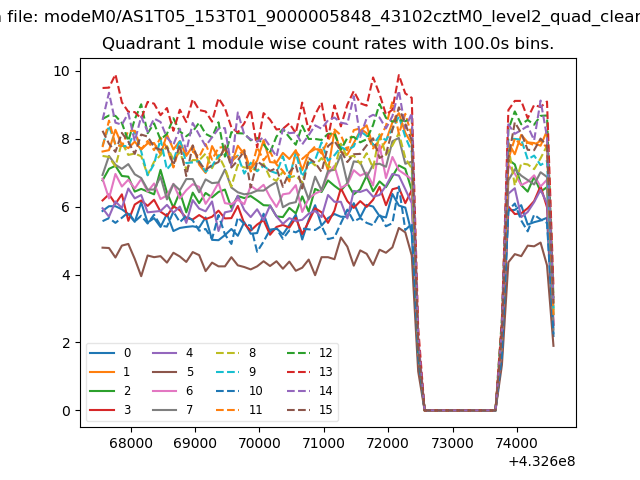
| Module-wise count rates for Quadrant A Data is divided into 100 sec bins |
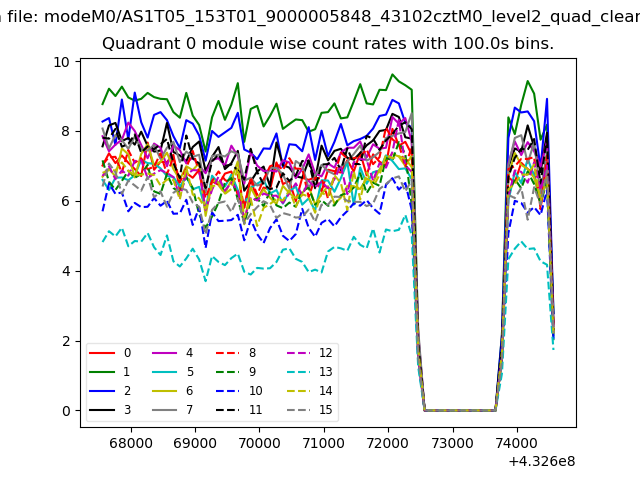 |
 |
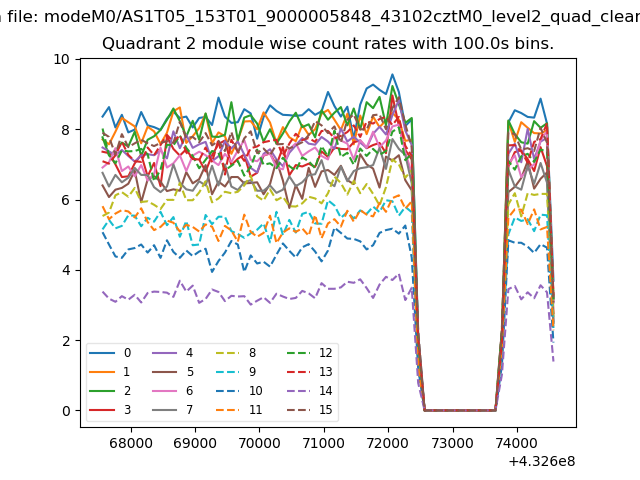
| Module-wise count rates for Quadrant B Data is divided into 100 sec bins |
 |
 |
| Module-wise count rates for Quadrant C Data is divided into 100 sec bins |
 |
 |
| Module-wise count rates for Quadrant D Data is divided into 100 sec bins |
 |
 |
| Parameter | Plot |
|---|---|
| CZT HV Monitor | 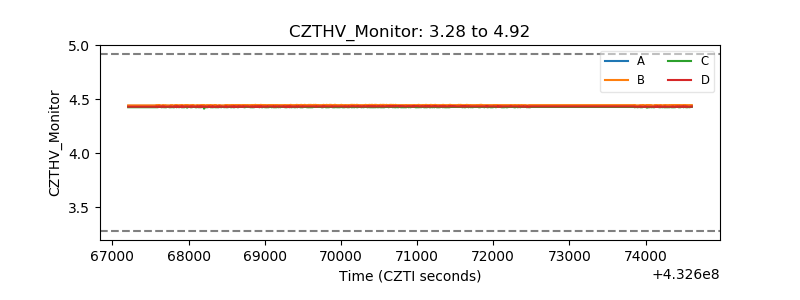 |
| D_VDD | 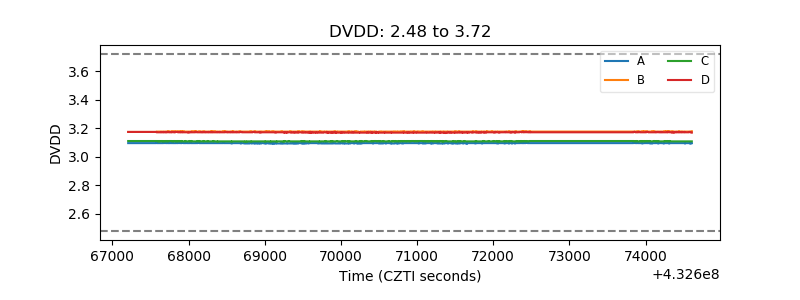 |
| Temperature 1 | 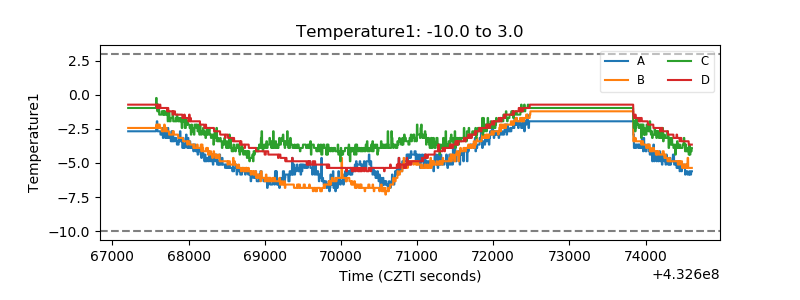 |
| Veto HV Monitor | 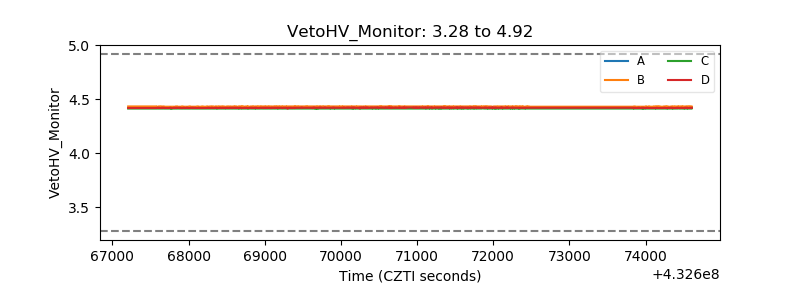 |
| Veto LLD | 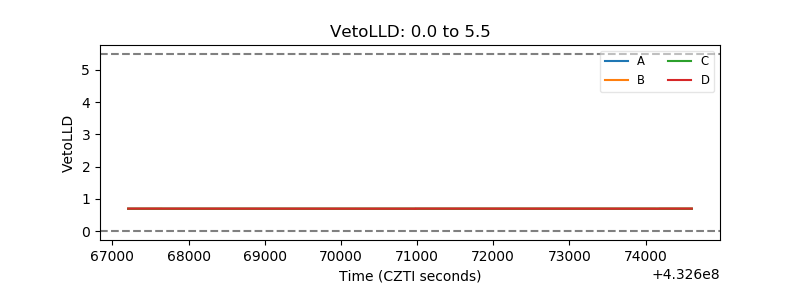 |
| Alpha Counter | 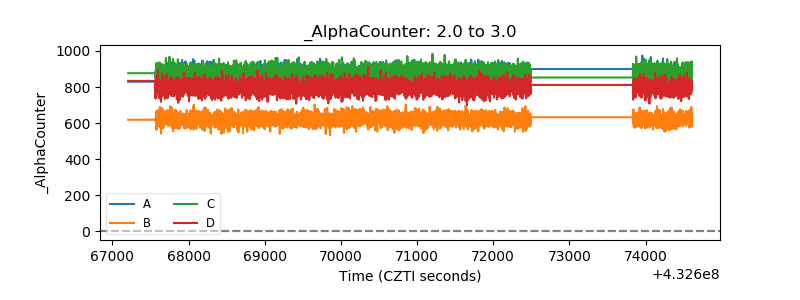 |
| _CPM_Rate | 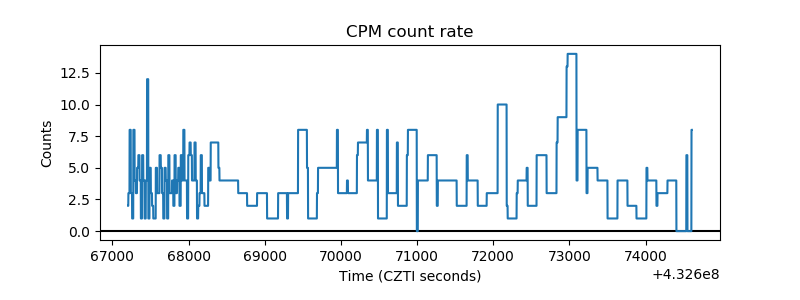 |
| CZT Counter | 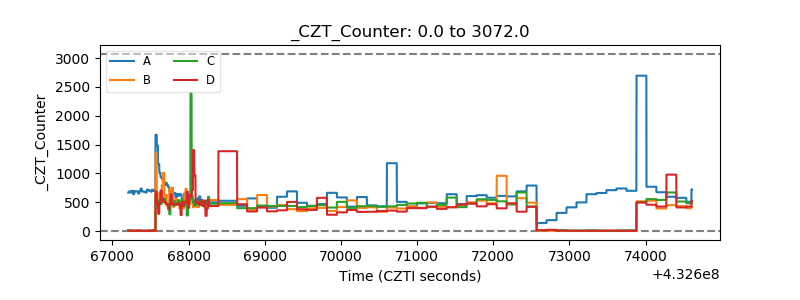 |
| +2.5 Volts monitor |  |
| +5 Volts monitor |  |
| _ROLL_ROT | 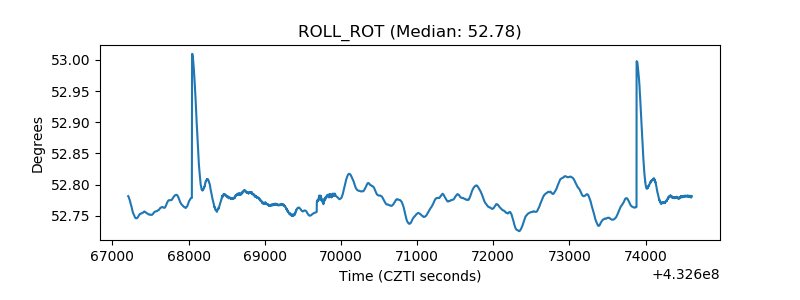 |
| _Roll_DEC | 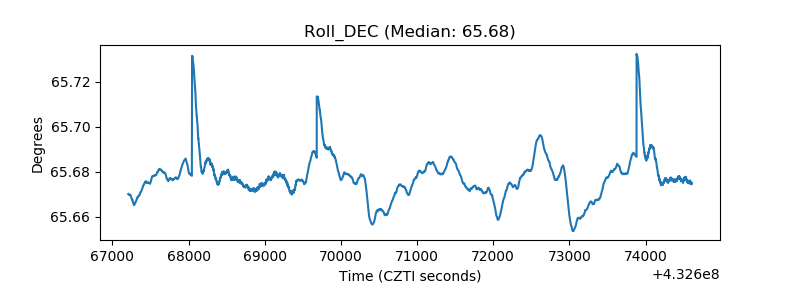 |
| _Roll_RA | 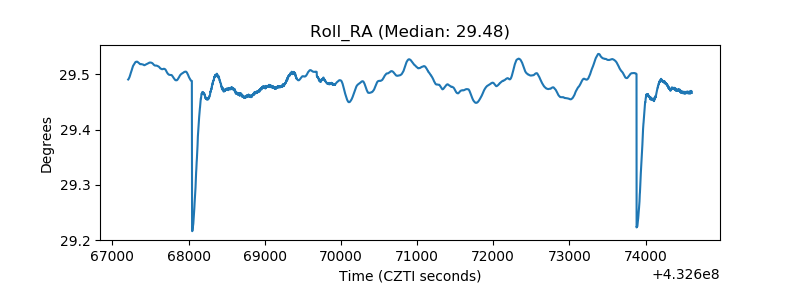 |
| Veto Counter | 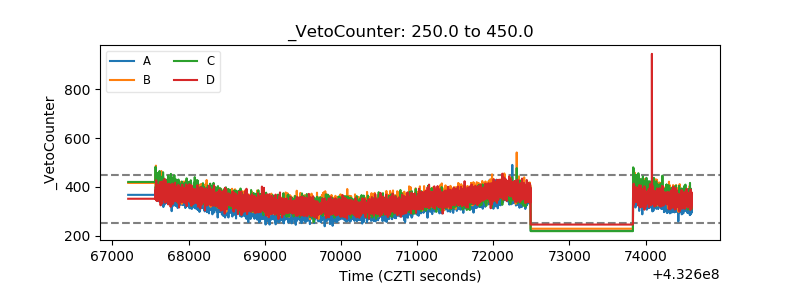 |