| Param | Original file | Final file |
|---|---|---|
| Filename | modeM0/AS1T05_153T01_9000005848_43103cztM0_level2.fits | modeM0/AS1T05_153T01_9000005848_43103cztM0_level2_quad_clean.evt |
| Size (bytes) | 370,964,160 | 97,709,760 |
| Size | 353.8 MB | 93.2 MB |
| Events in quadrant A | 4,063,412 | 635,309 |
| Events in quadrant B | 2,757,738 | 664,361 |
| Events in quadrant C | 3,189,441 | 644,324 |
| Events in quadrant D | 3,251,749 | 593,343 |
| Mode SS | |||
|---|---|---|---|
| Quadrant | BADHDUFLAG | Total packets | Discarded packets |
| A | 0 | 124 | 0 |
| B | 0 | 124 | 0 |
| C | 0 | 124 | 0 |
| D | 0 | 124 | 0 |
| Mode M9 | |||
|---|---|---|---|
| Quadrant | BADHDUFLAG | Total packets | Discarded packets |
| A | 0 | 26 | 0 |
| B | 0 | 26 | 0 |
| C | 0 | 26 | 0 |
| D | 0 | 26 | 0 |
| Mode M0 | |||
|---|---|---|---|
| Quadrant | BADHDUFLAG | Total packets | Discarded packets |
| A | 0 | 16060 | 2 |
| B | 0 | 12518 | 2 |
| C | 0 | 13222 | 2 |
| D | 0 | 14110 | 4 |
| Quadrant | Total seconds | Saturated seconds | Saturation percentage |
|---|---|---|---|
| A | 6032 | 276 | 4.575597% |
| B | 6032 | 19 | 0.314987% |
| C | 6032 | 35 | 0.580239% |
| D | 6031 | 87 | 1.442547% |
Noise dominated data is calculated using 1-second bins in cleaned event files. If a bin has >2000 counts, and if more than 50% of those come from <1% of pixels, then it is considered to be noise-dominated and hence unusable.
| Quadrant | # 1 sec bins | Bins with >0 counts | Bins with >2000 counts | High rate bins dominated by noise | Noise dominated (total time) | Noise dominated (detector-on time) | Marked lightcurve |
|---|---|---|---|---|---|---|---|
| A | 8659 | 6034 | 191 | 191 | 2.21% | 3.17% | 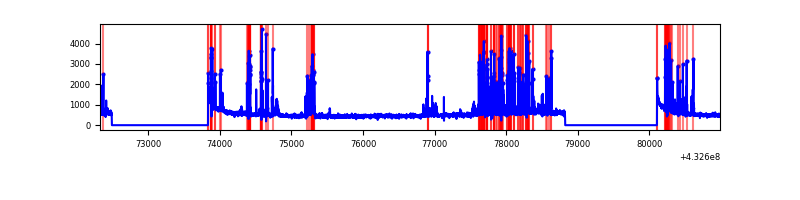 |
| B | 8659 | 6034 | 7 | 7 | 0.08% | 0.12% | 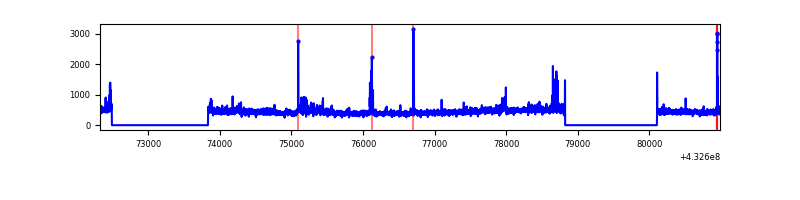 |
| C | 8659 | 6034 | 33 | 33 | 0.38% | 0.55% | 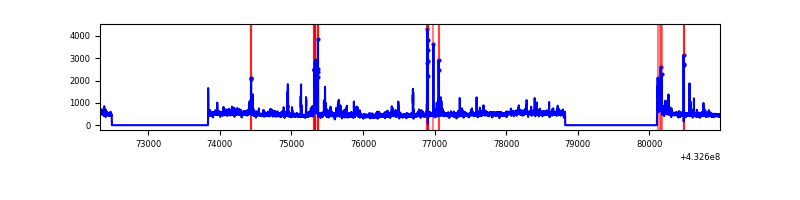 |
| D | 8658 | 6033 | 85 | 85 | 0.98% | 1.41% | 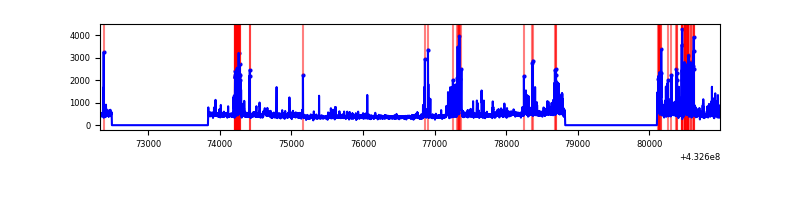 |
Top three noisy pixels from each quadrant. If the there are fewer than three noisy pixels in the level2.evt file, extra rows are filled as -1
| Pixel properties | Quadrant properties | ||||||
|---|---|---|---|---|---|---|---|
| Quadrant | DetID | PixID | Counts | Sigma | Mean | Median | Sigma |
| A | 15 | 237 | 887222 | 6781.03 | 633 | 617 | 130.7 |
| A | 10 | 83 | 628538 | 4802.53 | 633 | 617 | 130.7 |
| A | 12 | 189 | 89051 | 676.37 | 633 | 617 | 130.7 |
| B | 0 | 229 | 92290 | 737.3 | 640 | 621 | 124.3 |
| B | 5 | 255 | 68324 | 544.54 | 640 | 621 | 124.3 |
| B | 0 | 189 | 22868 | 178.93 | 640 | 621 | 124.3 |
| C | 15 | 214 | 272364 | 1841.01 | 631 | 634 | 147.6 |
| C | 8 | 79 | 195276 | 1318.73 | 631 | 634 | 147.6 |
| C | 14 | 254 | 175332 | 1183.61 | 631 | 634 | 147.6 |
| D | 1 | 52 | 472769 | 3059.67 | 630 | 612 | 154.3 |
| D | 12 | 233 | 149265 | 963.3 | 630 | 612 | 154.3 |
| D | 5 | 32 | 91548 | 589.28 | 630 | 612 | 154.3 |
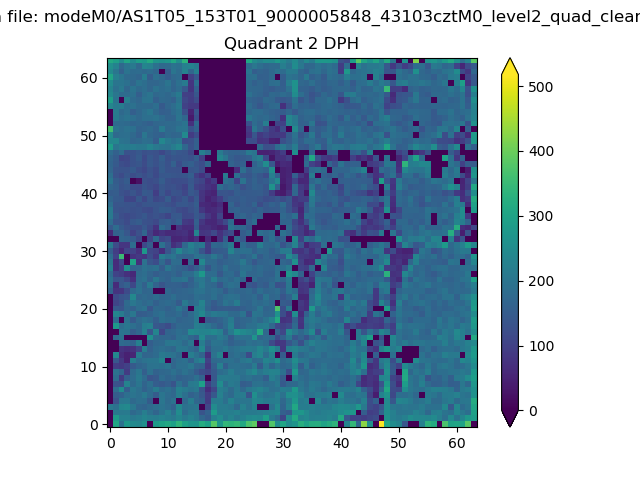
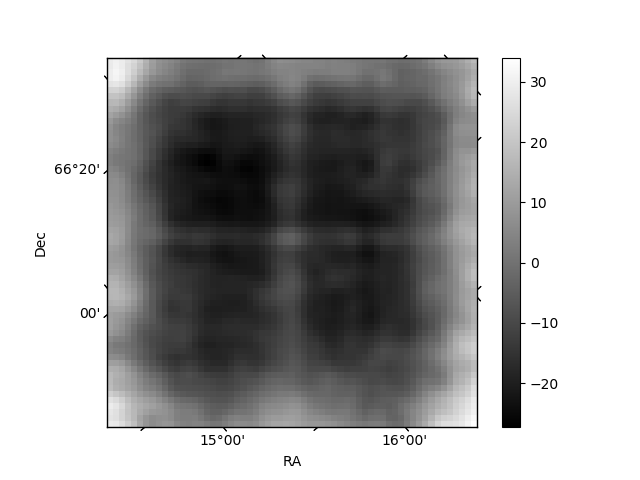
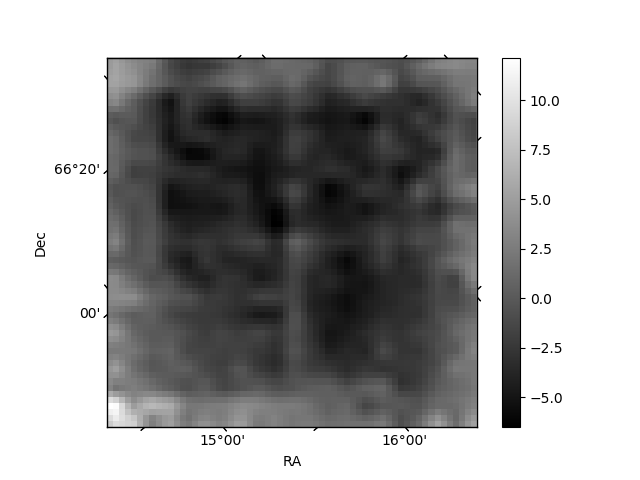
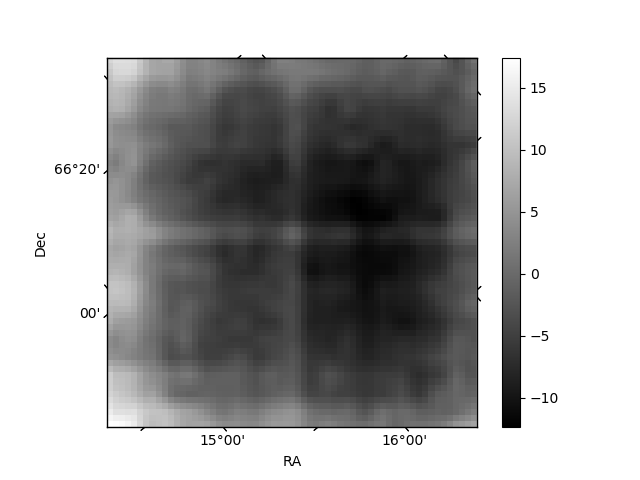
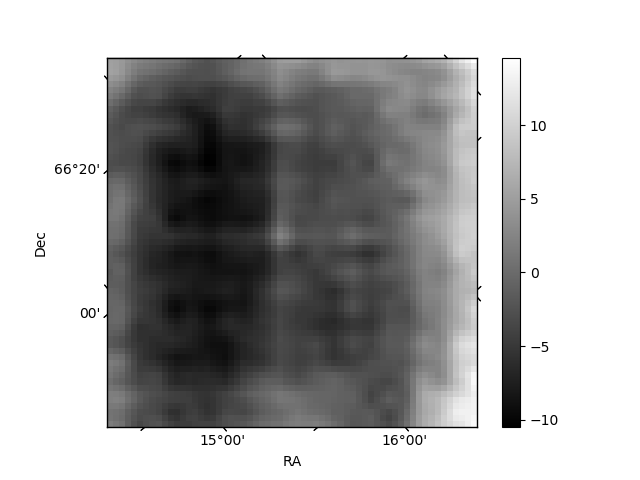
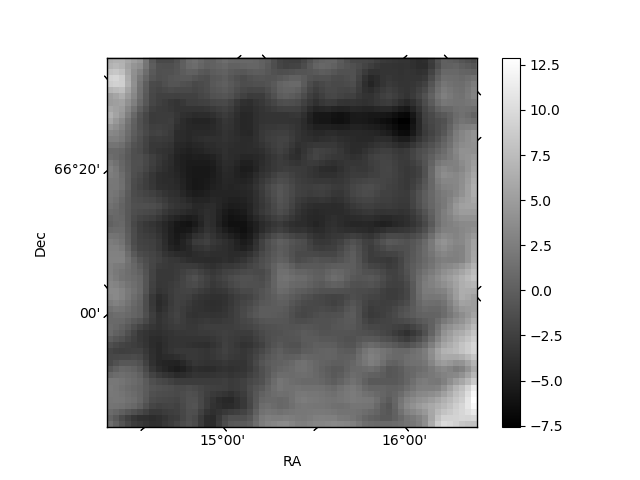
Histogram calculated using DETX and DETY for each event in the final _common_clean file
| Quadrant A | 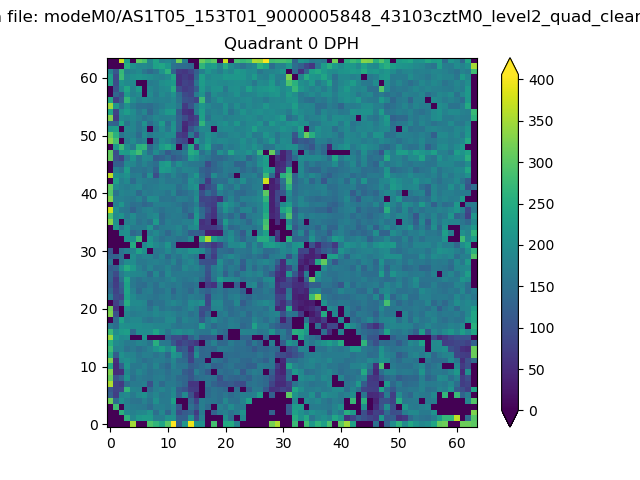 |
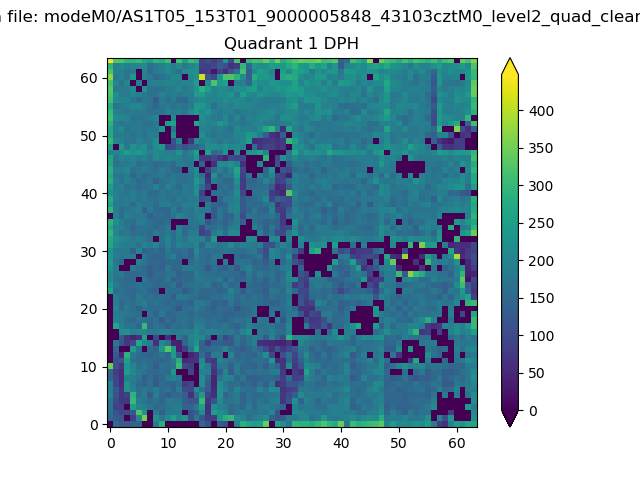 |
Quadrant B |
|---|---|---|---|
| Quadrant D | 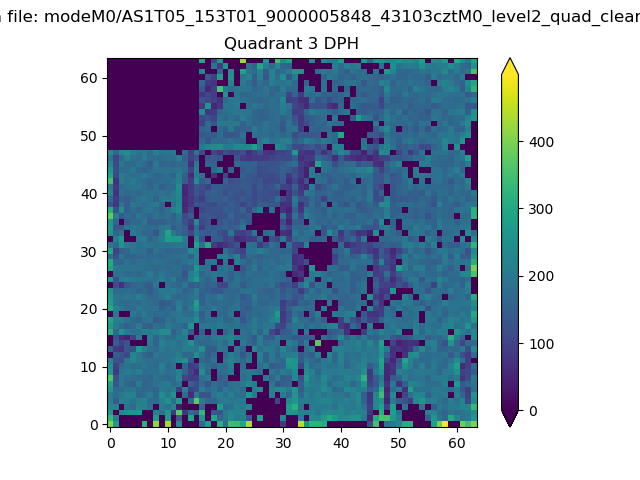 |
 |
Quadrant C |
| Plot type | Count rate plots | Images |
|---|---|---|
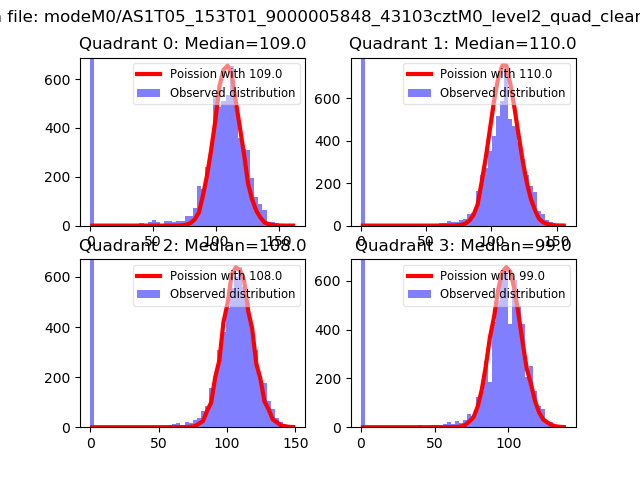
| Comparison with Poisson distribution Blue bars denote a histogram of data divided into 1 sec bins. Red curve is a Poisson curve with rate = median count rate of data. |
 |
 |
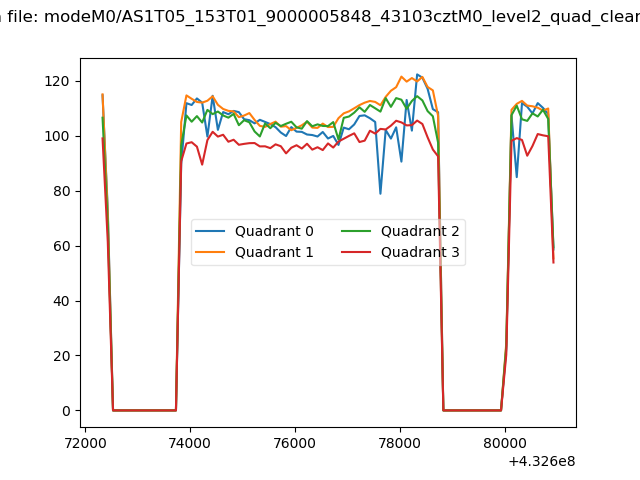
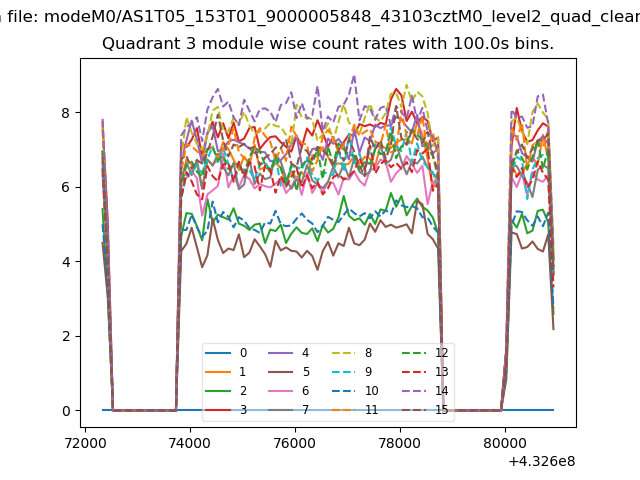
| Quadrant-wise count rates Data is divided into 100 sec bins |
 |
|
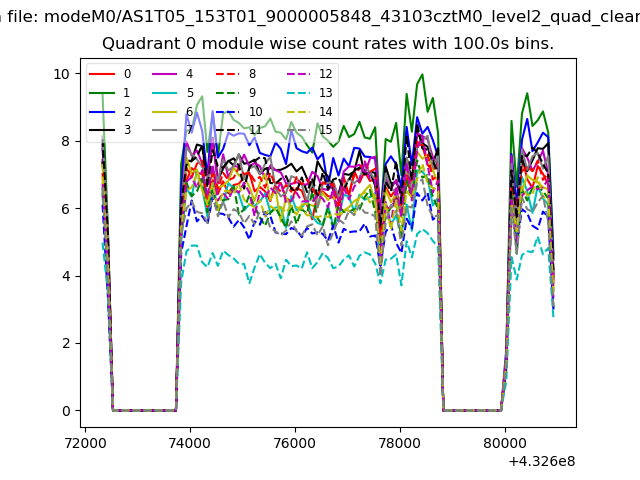
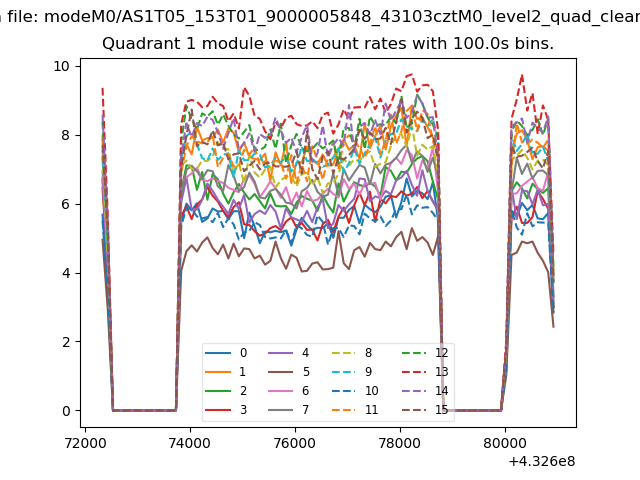
| Module-wise count rates for Quadrant A Data is divided into 100 sec bins |
 |
 |
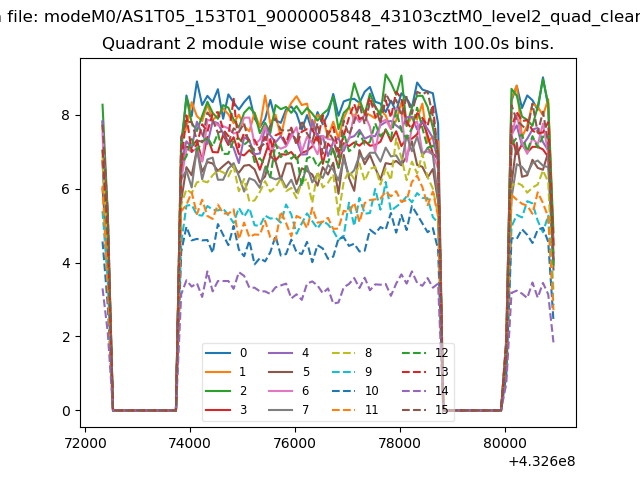
| Module-wise count rates for Quadrant B Data is divided into 100 sec bins |
 |
 |
| Module-wise count rates for Quadrant C Data is divided into 100 sec bins |
 |
 |
| Module-wise count rates for Quadrant D Data is divided into 100 sec bins |
 |
 |
| Parameter | Plot |
|---|---|
| CZT HV Monitor | 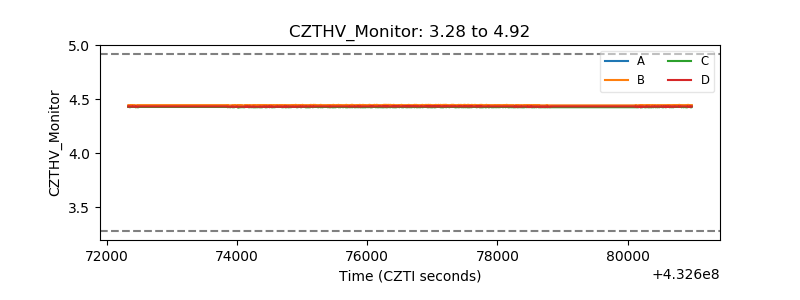 |
| D_VDD | 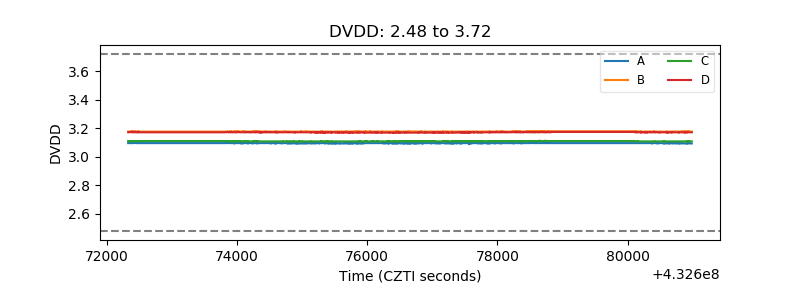 |
| Temperature 1 | 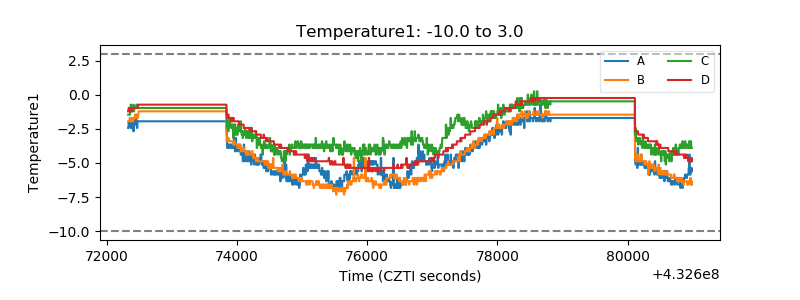 |
| Veto HV Monitor | 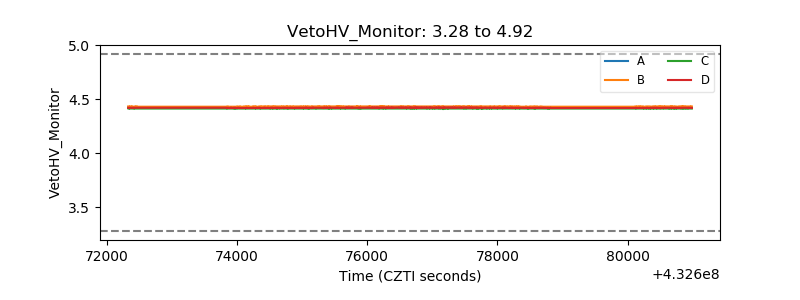 |
| Veto LLD | 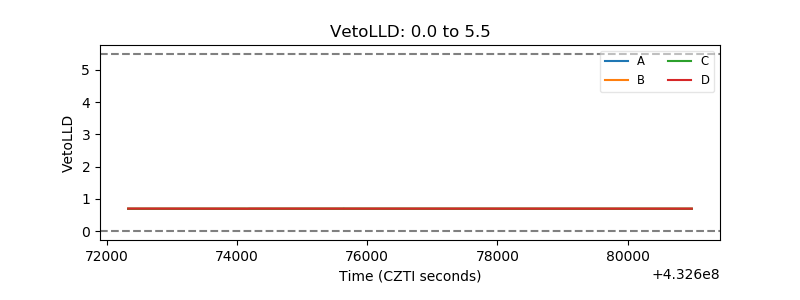 |
| Alpha Counter | 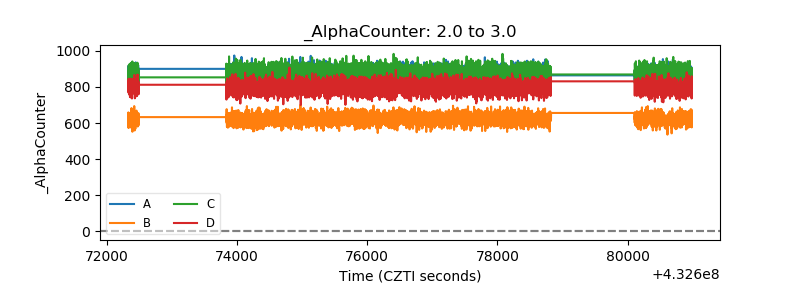 |
| _CPM_Rate | 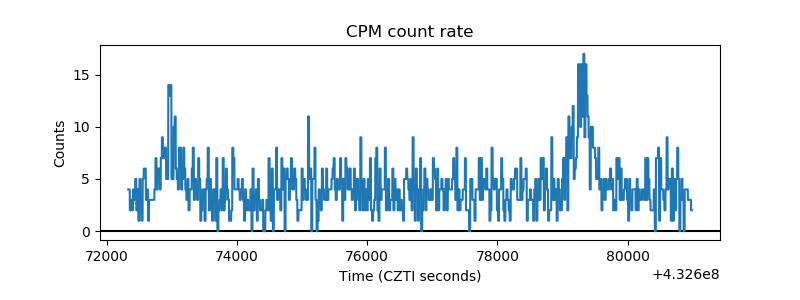 |
| CZT Counter | 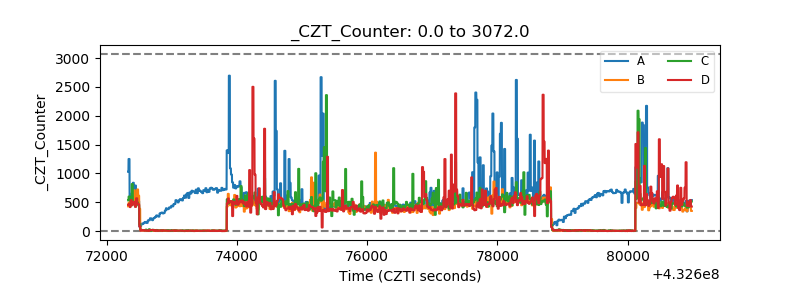 |
| +2.5 Volts monitor | 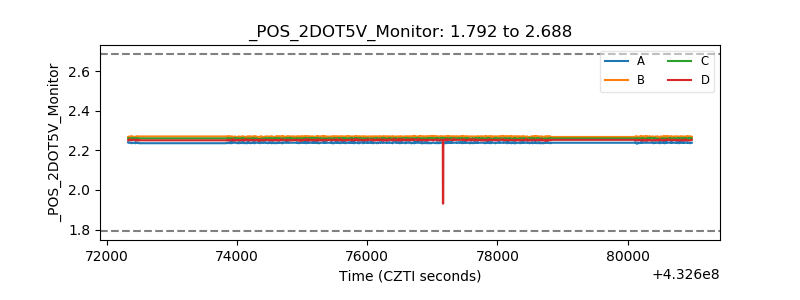 |
| +5 Volts monitor | 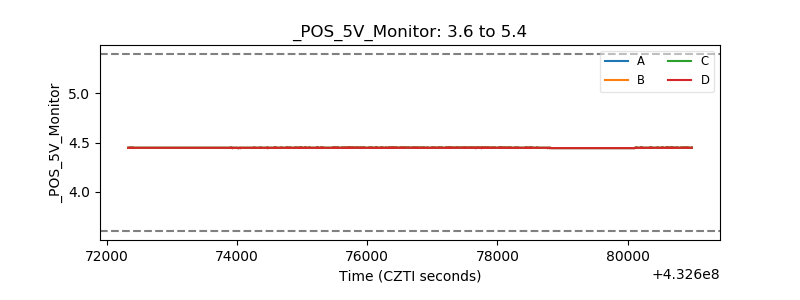 |
| _ROLL_ROT | 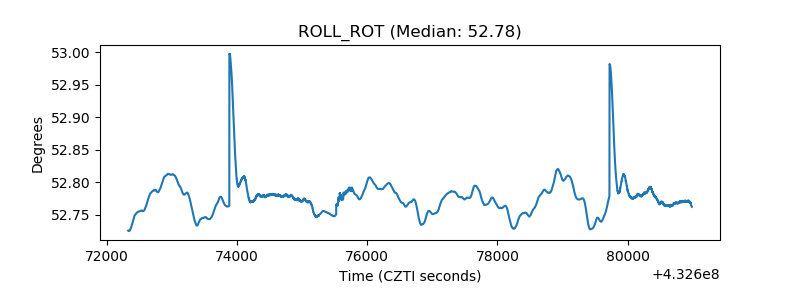 |
| _Roll_DEC | 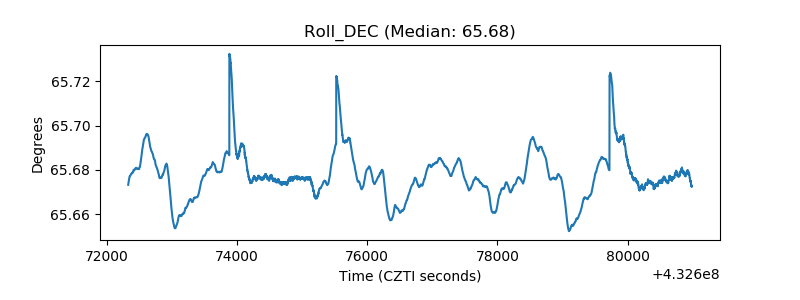 |
| _Roll_RA | 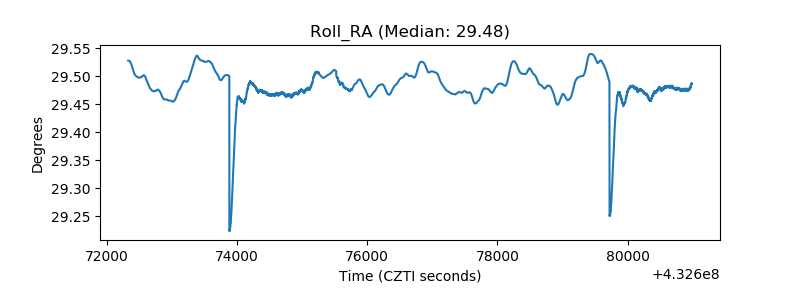 |
| Veto Counter | 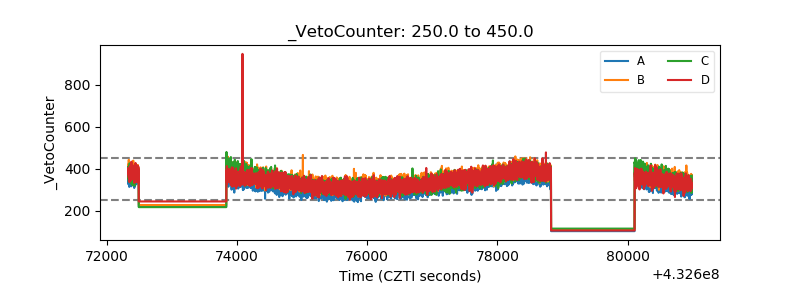 |