| Param | Original file | Final file |
|---|---|---|
| Filename | modeM0/AS1T05_153T01_9000005848_43105cztM0_level2.fits | modeM0/AS1T05_153T01_9000005848_43105cztM0_level2_quad_clean.evt |
| Size (bytes) | 671,849,280 | 178,496,640 |
| Size | 640.7 MB | 170.2 MB |
| Events in quadrant A | 7,205,665 | 1,158,177 |
| Events in quadrant B | 4,961,452 | 1,214,036 |
| Events in quadrant C | 5,869,650 | 1,174,371 |
| Events in quadrant D | 5,966,906 | 1,084,634 |
| Mode SS | |||
|---|---|---|---|
| Quadrant | BADHDUFLAG | Total packets | Discarded packets |
| A | 0 | 232 | 0 |
| B | 0 | 232 | 0 |
| C | 0 | 232 | 0 |
| D | 0 | 232 | 0 |
| Mode M9 | |||
|---|---|---|---|
| Quadrant | BADHDUFLAG | Total packets | Discarded packets |
| A | 0 | 39 | 0 |
| B | 0 | 39 | 0 |
| C | 0 | 39 | 0 |
| D | 0 | 39 | 0 |
| Mode M0 | |||
|---|---|---|---|
| Quadrant | BADHDUFLAG | Total packets | Discarded packets |
| A | 0 | 28770 | 3 |
| B | 0 | 23023 | 3 |
| C | 0 | 24658 | 3 |
| D | 0 | 25905 | 4 |
| Quadrant | Total seconds | Saturated seconds | Saturation percentage |
|---|---|---|---|
| A | 11162 | 425 | 3.807561% |
| B | 11163 | 20 | 0.179163% |
| C | 11163 | 130 | 1.164561% |
| D | 11162 | 158 | 1.415517% |
Noise dominated data is calculated using 1-second bins in cleaned event files. If a bin has >2000 counts, and if more than 50% of those come from <1% of pixels, then it is considered to be noise-dominated and hence unusable.
| Quadrant | # 1 sec bins | Bins with >0 counts | Bins with >2000 counts | High rate bins dominated by noise | Noise dominated (total time) | Noise dominated (detector-on time) | Marked lightcurve |
|---|---|---|---|---|---|---|---|
| A | 15221 | 11165 | 272 | 272 | 1.79% | 2.44% | 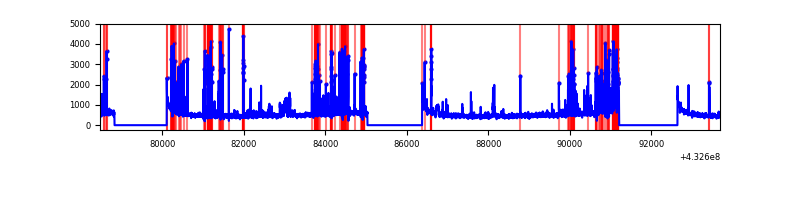 |
| B | 15222 | 11166 | 7 | 7 | 0.05% | 0.06% | 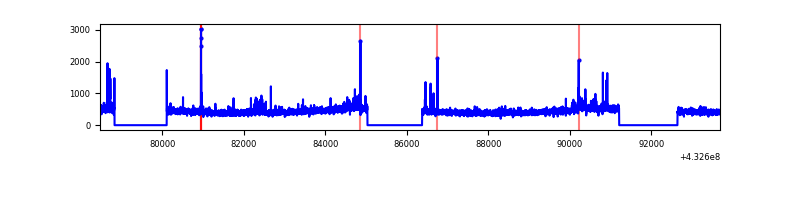 |
| C | 15222 | 11166 | 123 | 123 | 0.81% | 1.10% | 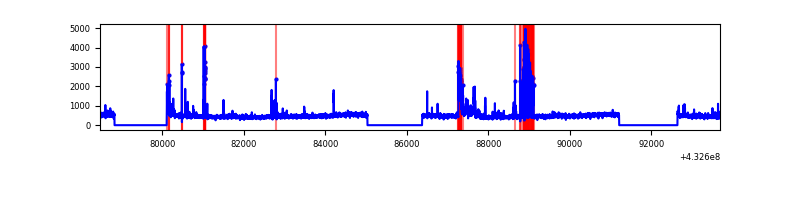 |
| D | 15221 | 11165 | 146 | 146 | 0.96% | 1.31% | 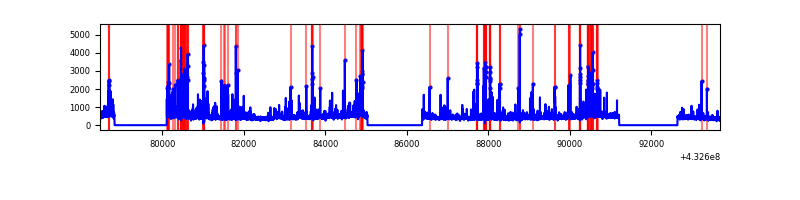 |
Top three noisy pixels from each quadrant. If the there are fewer than three noisy pixels in the level2.evt file, extra rows are filled as -1
| Pixel properties | Quadrant properties | ||||||
|---|---|---|---|---|---|---|---|
| Quadrant | DetID | PixID | Counts | Sigma | Mean | Median | Sigma |
| A | 15 | 237 | 1248570 | 5200.14 | 1175 | 1149 | 239.9 |
| A | 10 | 83 | 1094534 | 4558.01 | 1175 | 1149 | 239.9 |
| A | 15 | 222 | 175406 | 726.43 | 1175 | 1149 | 239.9 |
| B | 0 | 229 | 150074 | 654.84 | 1184 | 1150 | 227.4 |
| B | 0 | 189 | 62834 | 271.23 | 1184 | 1150 | 227.4 |
| B | 3 | 112 | 49593 | 213.01 | 1184 | 1150 | 227.4 |
| C | 14 | 254 | 636747 | 2359.19 | 1161 | 1167 | 269.4 |
| C | 15 | 214 | 497429 | 1842.06 | 1161 | 1167 | 269.4 |
| C | 8 | 79 | 176607 | 651.21 | 1161 | 1167 | 269.4 |
| D | 1 | 52 | 858999 | 3030.95 | 1160 | 1124 | 283.0 |
| D | 13 | 249 | 177543 | 623.31 | 1160 | 1124 | 283.0 |
| D | 5 | 32 | 141824 | 497.11 | 1160 | 1124 | 283.0 |
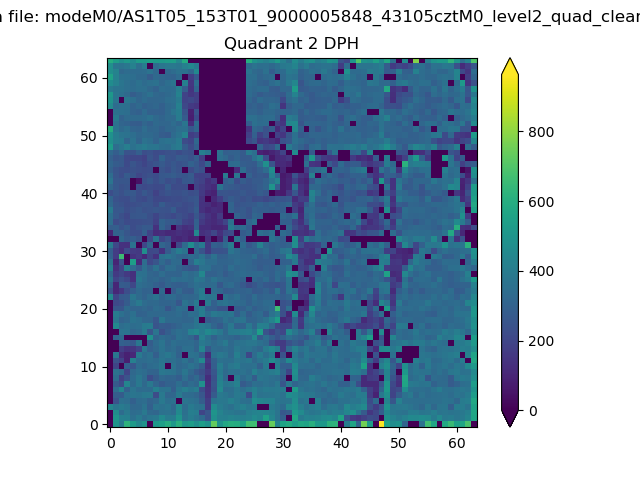
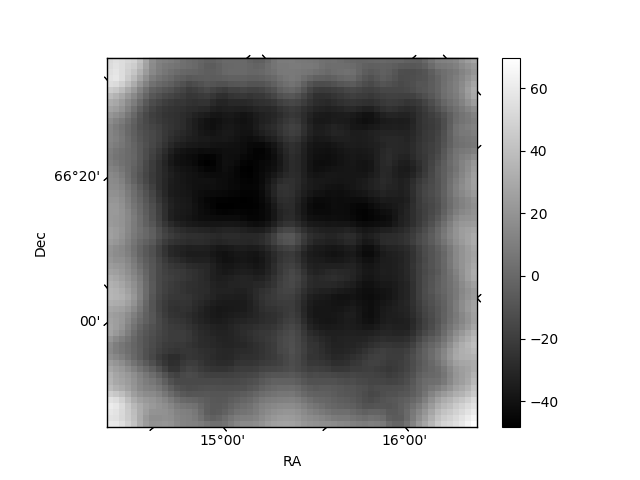
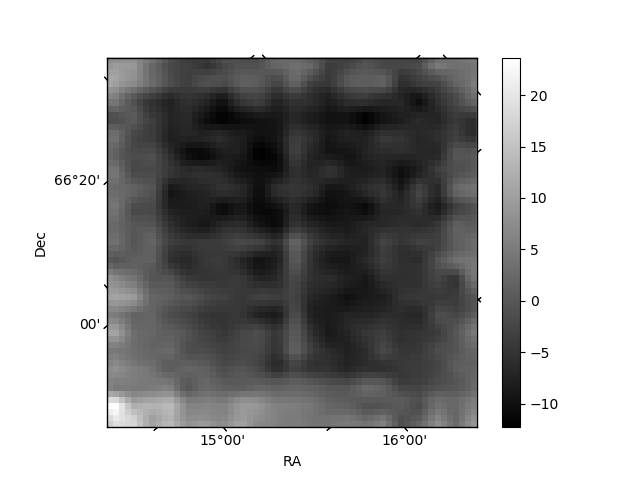
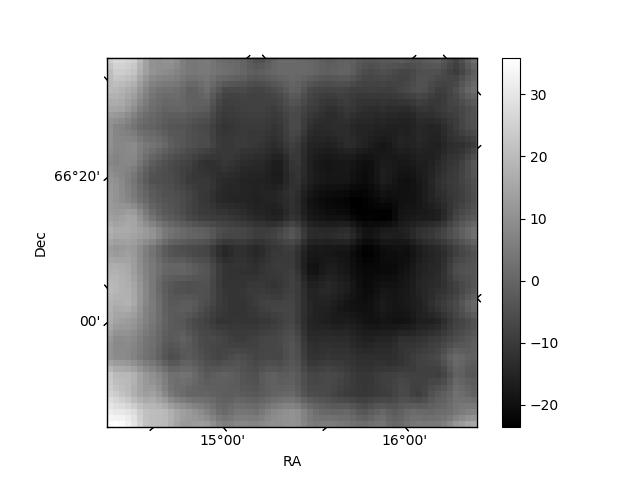
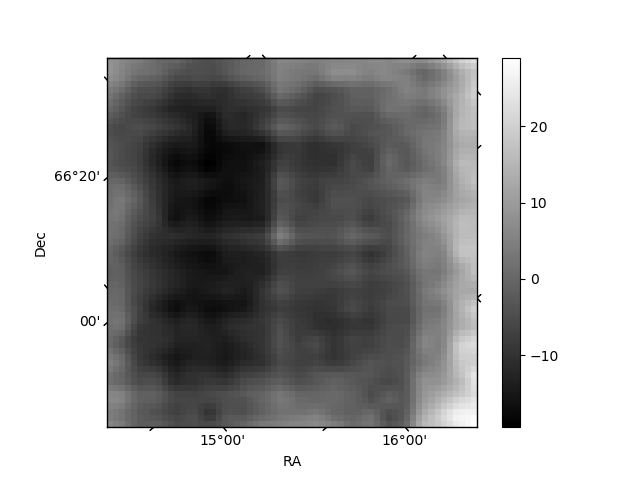
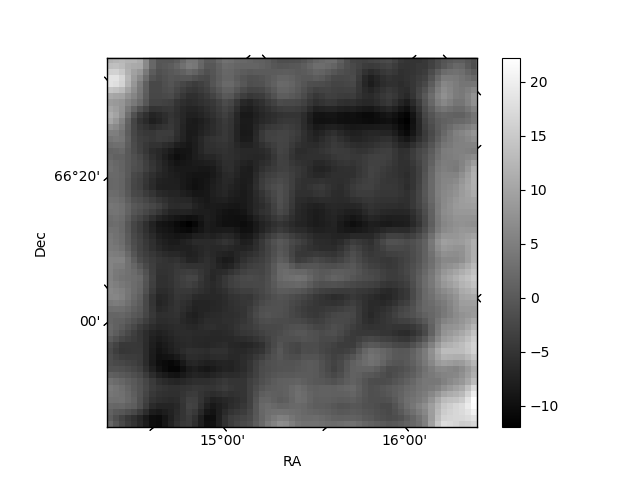
Histogram calculated using DETX and DETY for each event in the final _common_clean file
| Quadrant A | 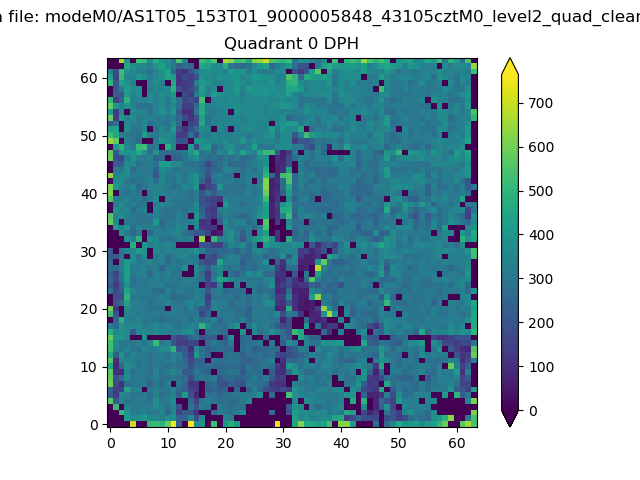 |
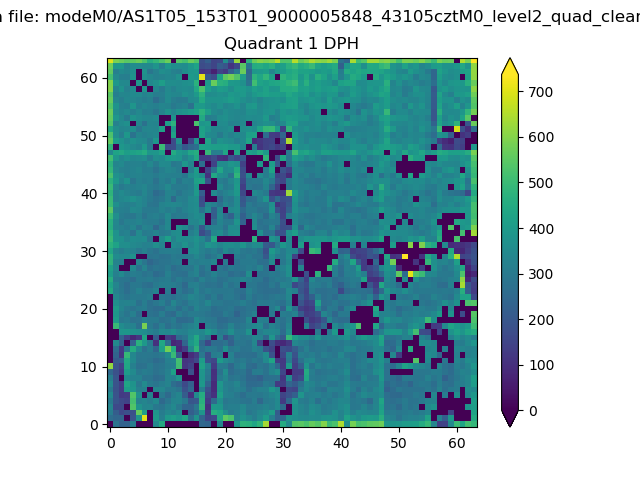 |
Quadrant B |
|---|---|---|---|
| Quadrant D | 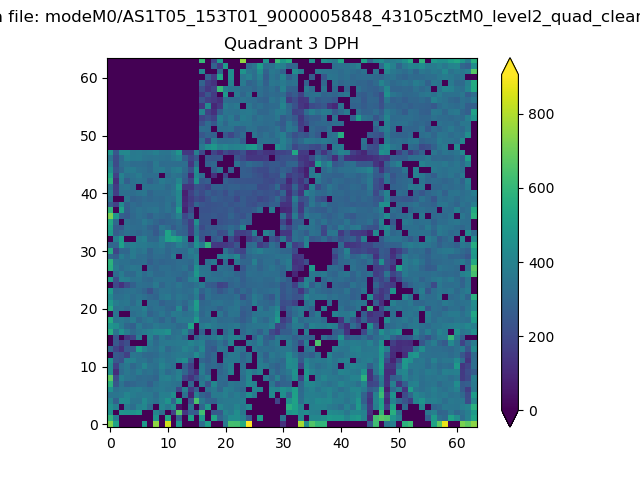 |
 |
Quadrant C |
| Plot type | Count rate plots | Images |
|---|---|---|
| Comparison with Poisson distribution Blue bars denote a histogram of data divided into 1 sec bins. Red curve is a Poisson curve with rate = median count rate of data. |
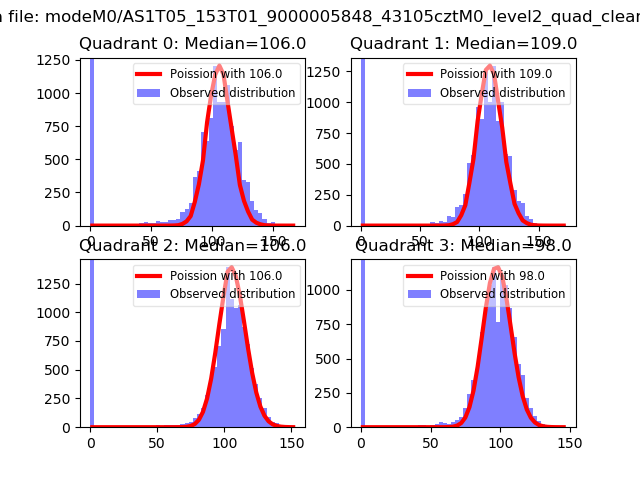 |
 |
| Quadrant-wise count rates Data is divided into 100 sec bins |
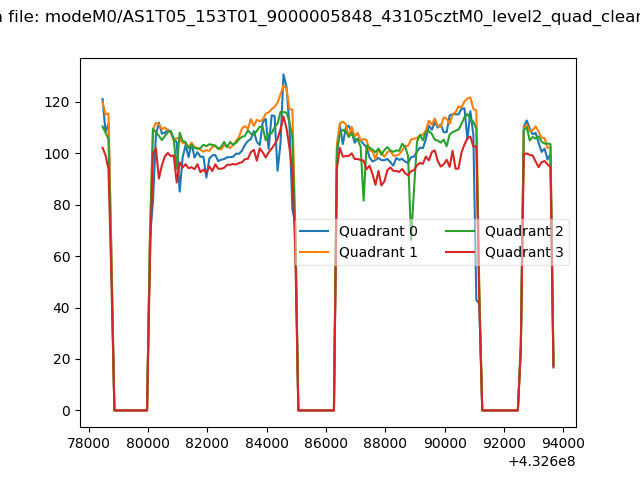 |
|
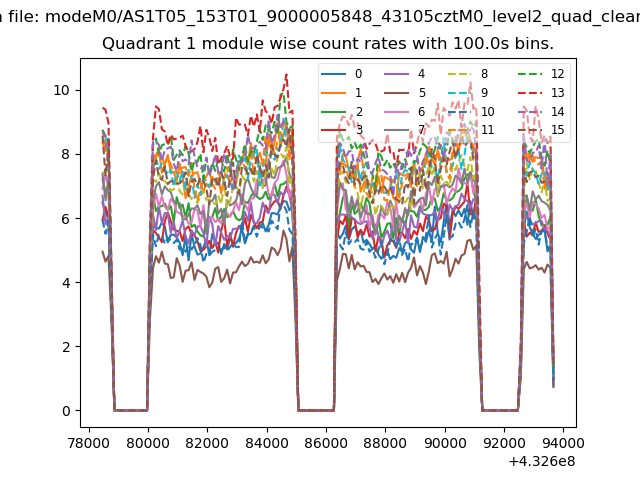
| Module-wise count rates for Quadrant A Data is divided into 100 sec bins |
 |
 |
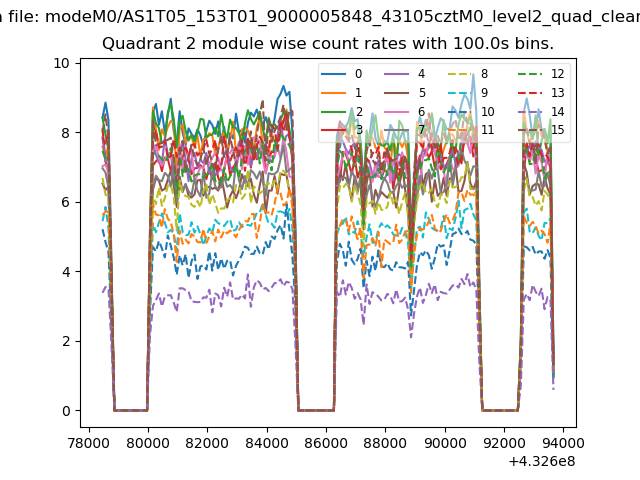
| Module-wise count rates for Quadrant B Data is divided into 100 sec bins |
 |
 |
| Module-wise count rates for Quadrant C Data is divided into 100 sec bins |
 |
 |
| Module-wise count rates for Quadrant D Data is divided into 100 sec bins |
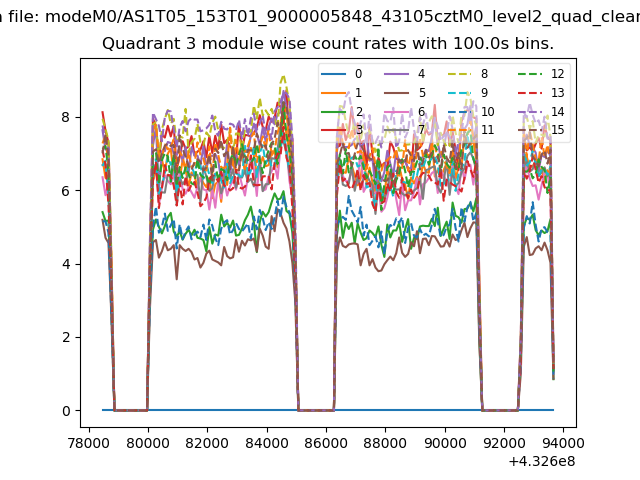 |
 |
| Parameter | Plot |
|---|---|
| CZT HV Monitor | 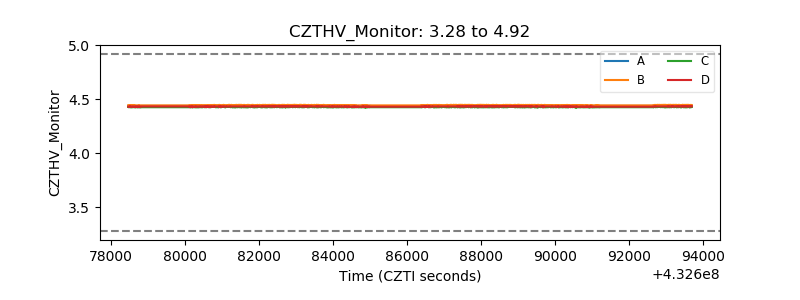 |
| D_VDD | 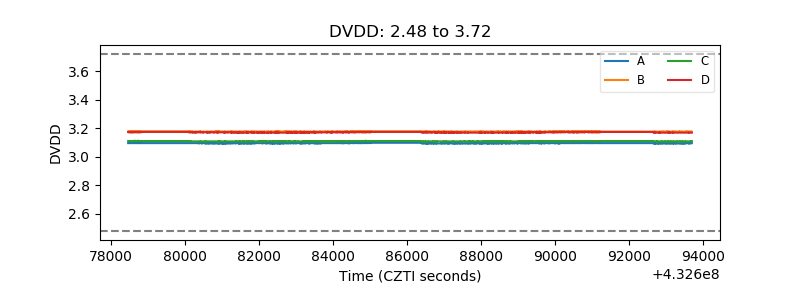 |
| Temperature 1 | 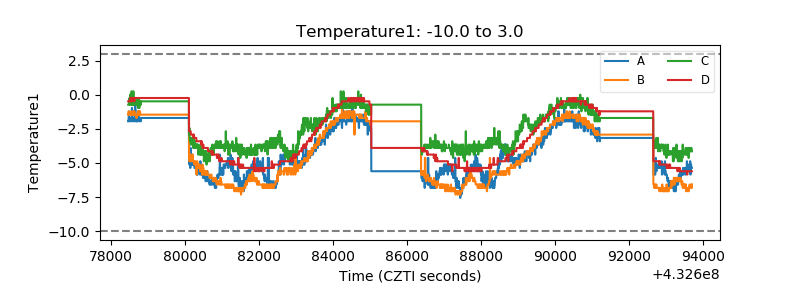 |
| Veto HV Monitor | 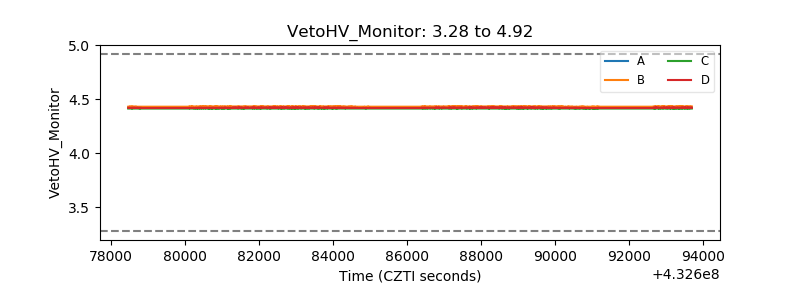 |
| Veto LLD | 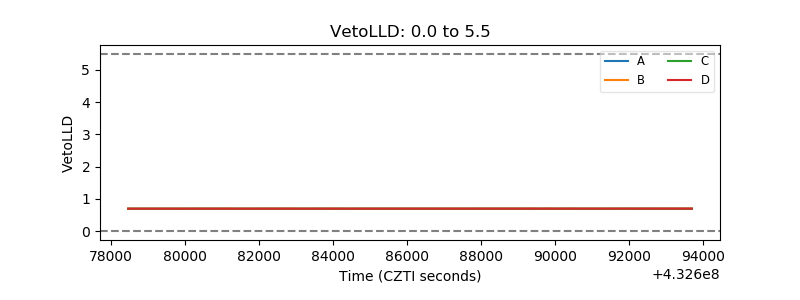 |
| Alpha Counter | 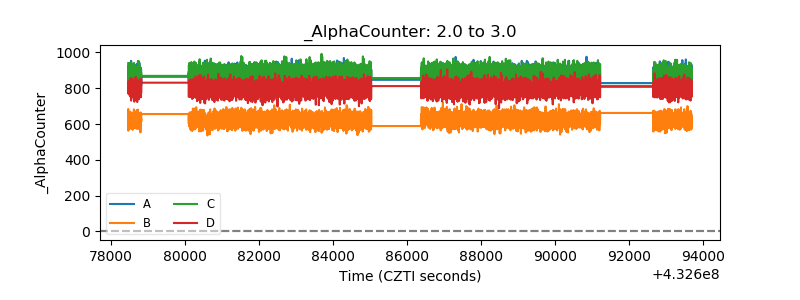 |
| _CPM_Rate | 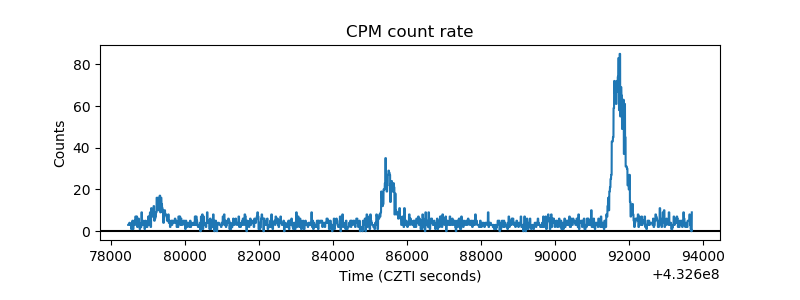 |
| CZT Counter | 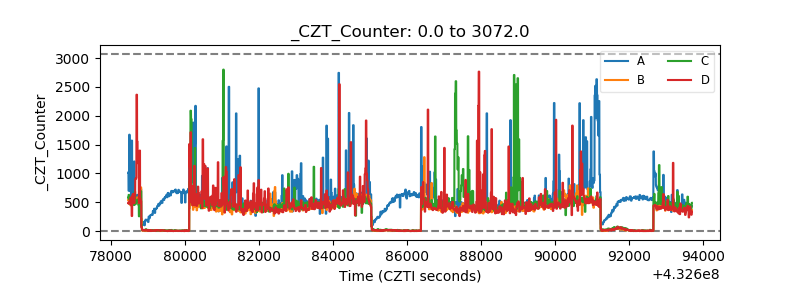 |
| +2.5 Volts monitor |  |
| +5 Volts monitor |  |
| _ROLL_ROT | 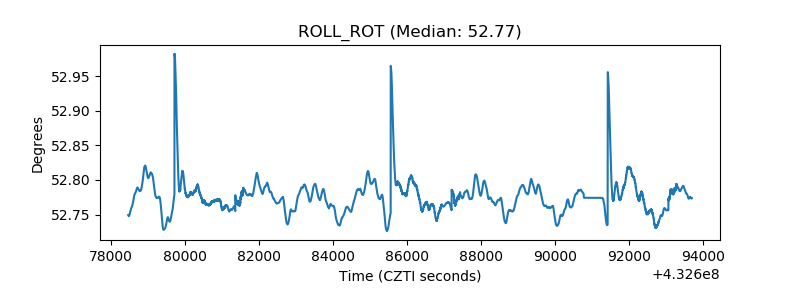 |
| _Roll_DEC | 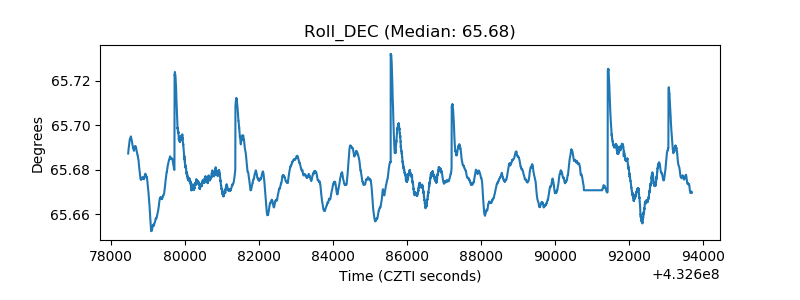 |
| _Roll_RA | 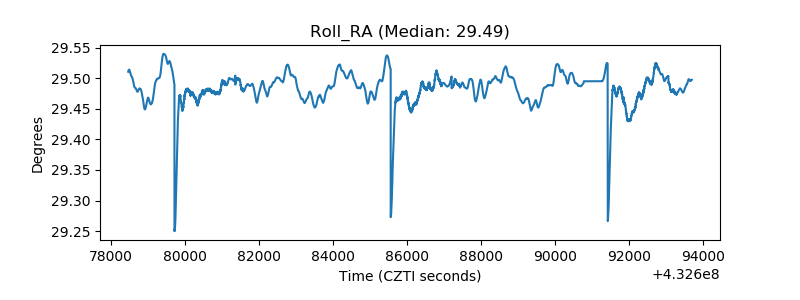 |
| Veto Counter | 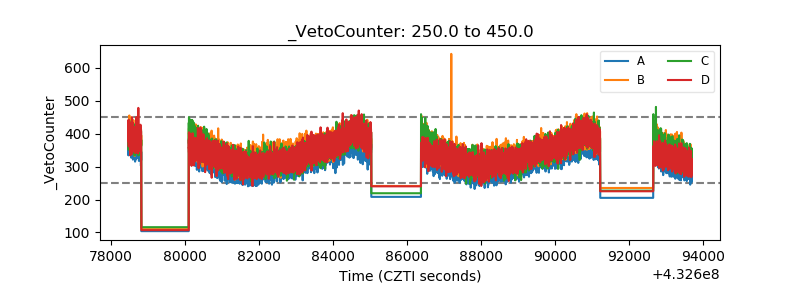 |