| Param | Original file | Final file |
|---|---|---|
| Filename | modeM0/AS1T05_153T01_9000005848_43106cztM0_level2.fits | modeM0/AS1T05_153T01_9000005848_43106cztM0_level2_quad_clean.evt |
| Size (bytes) | 359,879,040 | 99,498,240 |
| Size | 343.2 MB | 94.9 MB |
| Events in quadrant A | 4,050,995 | 646,230 |
| Events in quadrant B | 2,976,244 | 674,492 |
| Events in quadrant C | 3,063,710 | 656,278 |
| Events in quadrant D | 2,749,297 | 604,224 |
| Mode SS | |||
|---|---|---|---|
| Quadrant | BADHDUFLAG | Total packets | Discarded packets |
| A | 0 | 128 | 0 |
| B | 0 | 128 | 0 |
| C | 0 | 128 | 0 |
| D | 0 | 128 | 0 |
| Mode M9 | |||
|---|---|---|---|
| Quadrant | BADHDUFLAG | Total packets | Discarded packets |
| A | 0 | 29 | 0 |
| B | 0 | 29 | 0 |
| C | 0 | 29 | 0 |
| D | 0 | 29 | 0 |
| Mode M0 | |||
|---|---|---|---|
| Quadrant | BADHDUFLAG | Total packets | Discarded packets |
| A | 0 | 16189 | 2 |
| B | 0 | 13242 | 2 |
| C | 0 | 13025 | 2 |
| D | 0 | 12875 | 2 |
| Quadrant | Total seconds | Saturated seconds | Saturation percentage |
|---|---|---|---|
| A | 6178 | 243 | 3.933312% |
| B | 6179 | 47 | 0.760641% |
| C | 6179 | 8 | 0.129471% |
| D | 6179 | 22 | 0.356045% |
Noise dominated data is calculated using 1-second bins in cleaned event files. If a bin has >2000 counts, and if more than 50% of those come from <1% of pixels, then it is considered to be noise-dominated and hence unusable.
| Quadrant | # 1 sec bins | Bins with >0 counts | Bins with >2000 counts | High rate bins dominated by noise | Noise dominated (total time) | Noise dominated (detector-on time) | Marked lightcurve |
|---|---|---|---|---|---|---|---|
| A | 9134 | 6180 | 149 | 149 | 1.63% | 2.41% | 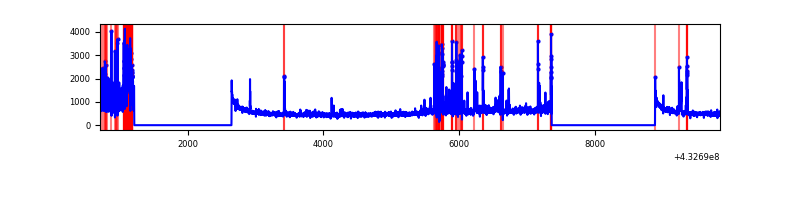 |
| B | 9135 | 6181 | 25 | 25 | 0.27% | 0.40% | 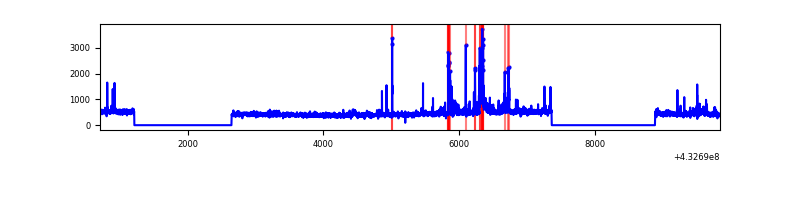 |
| C | 9135 | 6181 | 6 | 6 | 0.07% | 0.10% | 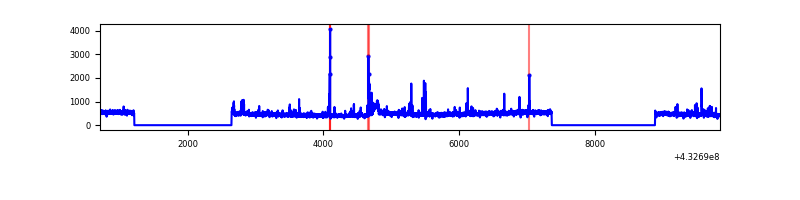 |
| D | 9135 | 6181 | 13 | 13 | 0.14% | 0.21% | 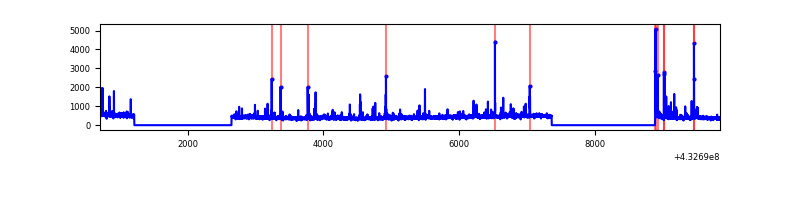 |
Top three noisy pixels from each quadrant. If the there are fewer than three noisy pixels in the level2.evt file, extra rows are filled as -1
| Pixel properties | Quadrant properties | ||||||
|---|---|---|---|---|---|---|---|
| Quadrant | DetID | PixID | Counts | Sigma | Mean | Median | Sigma |
| A | 10 | 83 | 643300 | 4794.1 | 658 | 645 | 134.1 |
| A | 15 | 237 | 521485 | 3885.38 | 658 | 645 | 134.1 |
| A | 15 | 222 | 230434 | 1714.19 | 658 | 645 | 134.1 |
| B | 5 | 255 | 148598 | 1150.45 | 661 | 643 | 128.6 |
| B | 0 | 229 | 139645 | 1080.83 | 661 | 643 | 128.6 |
| B | 3 | 112 | 75843 | 584.73 | 661 | 643 | 128.6 |
| C | 15 | 214 | 277704 | 1824.83 | 650 | 654 | 151.8 |
| C | 14 | 254 | 166752 | 1094.03 | 650 | 654 | 151.8 |
| C | 8 | 79 | 67378 | 439.49 | 650 | 654 | 151.8 |
| D | 1 | 52 | 128313 | 791.8 | 650 | 629 | 161.3 |
| D | 13 | 249 | 56218 | 344.72 | 650 | 629 | 161.3 |
| D | 5 | 32 | 35396 | 215.6 | 650 | 629 | 161.3 |
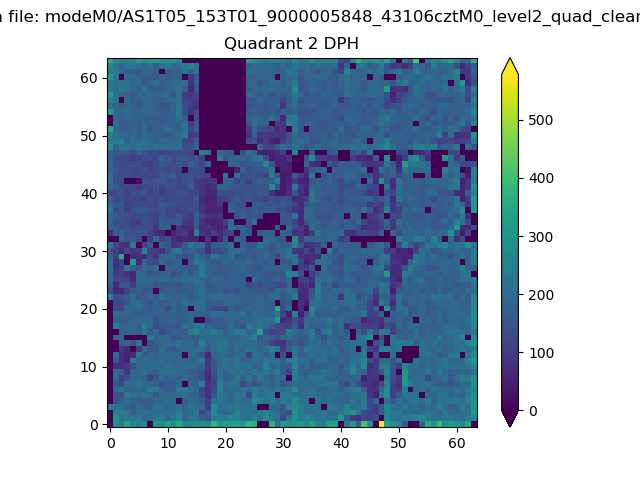
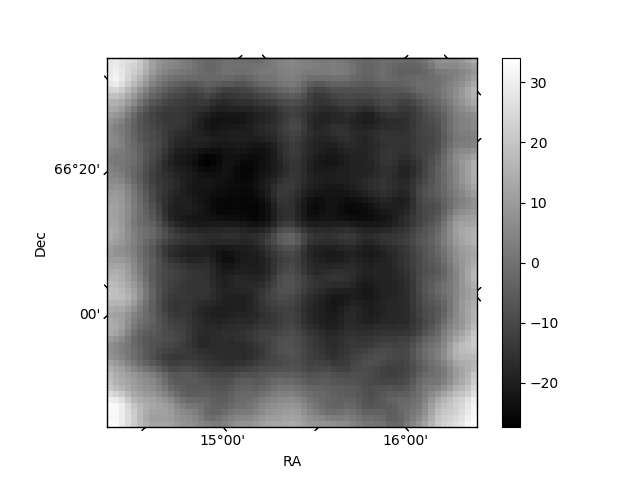
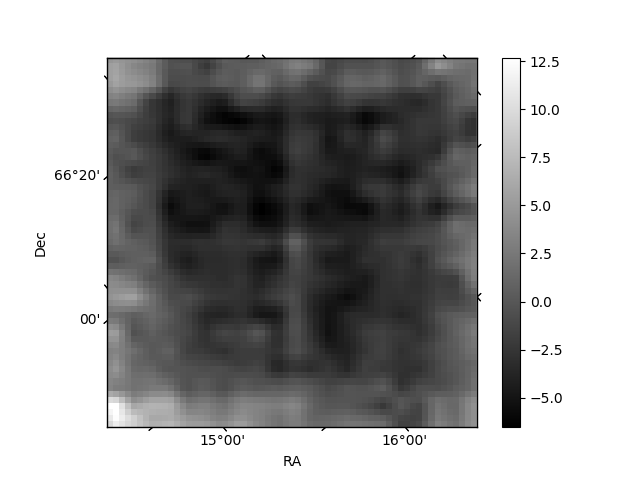
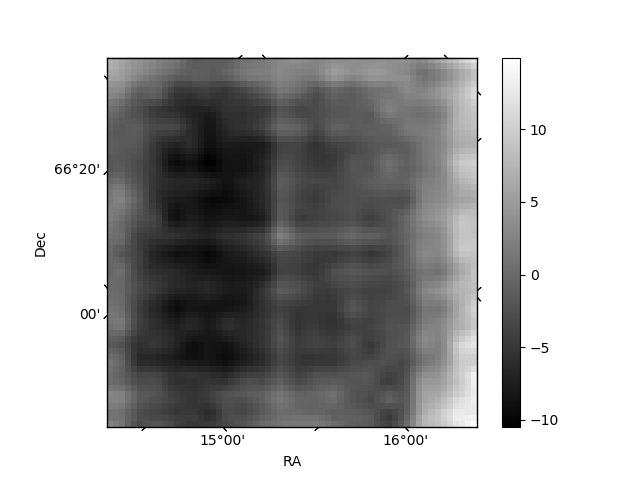
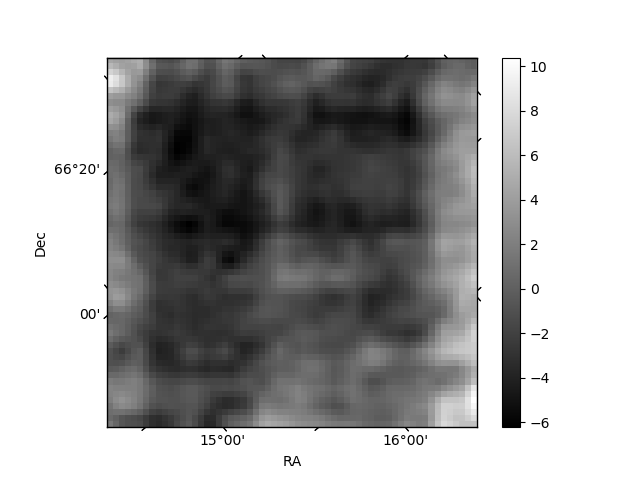
Histogram calculated using DETX and DETY for each event in the final _common_clean file
| Quadrant A | 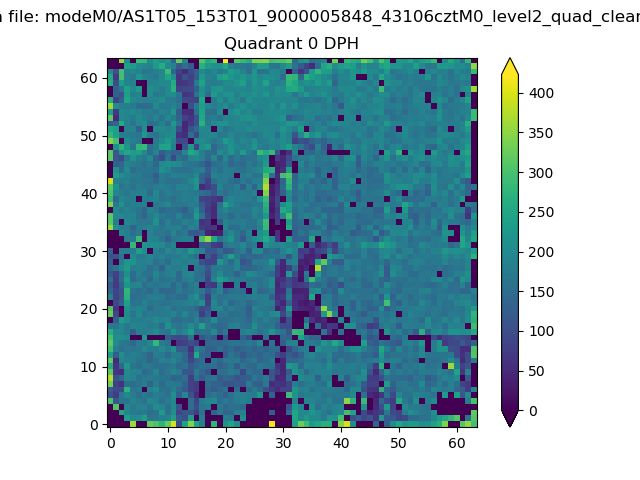 |
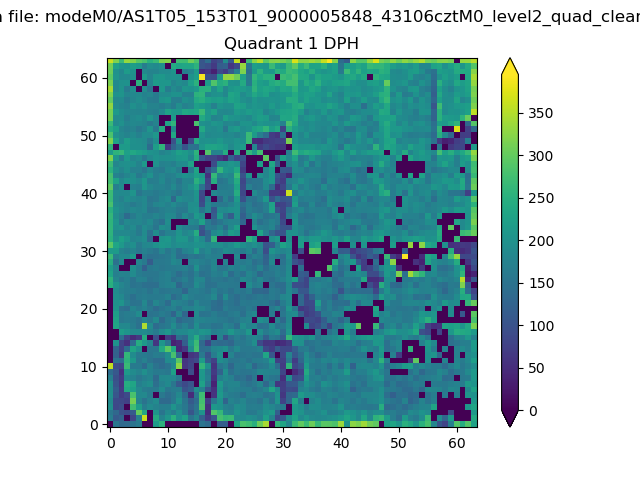 |
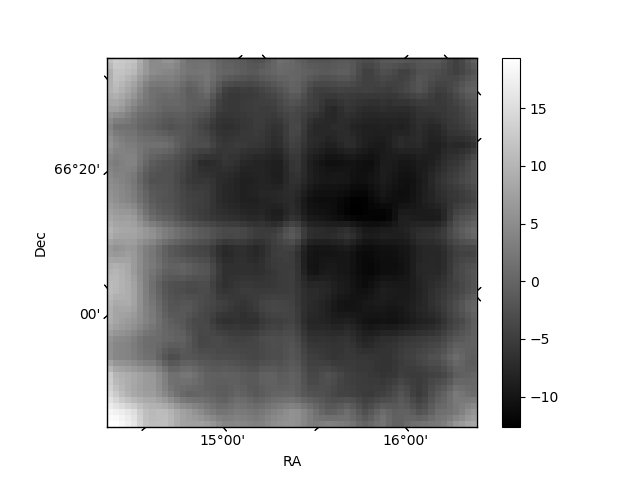
Quadrant B |
|---|---|---|---|
| Quadrant D | 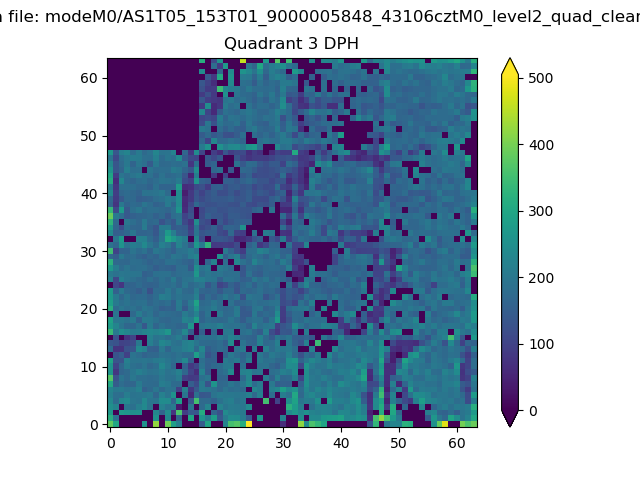 |
 |
Quadrant C |
| Plot type | Count rate plots | Images |
|---|---|---|
| Comparison with Poisson distribution Blue bars denote a histogram of data divided into 1 sec bins. Red curve is a Poisson curve with rate = median count rate of data. |
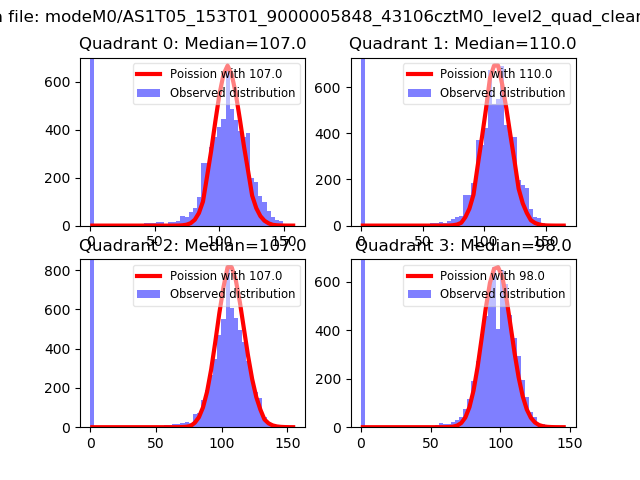 |
 |
| Quadrant-wise count rates Data is divided into 100 sec bins |
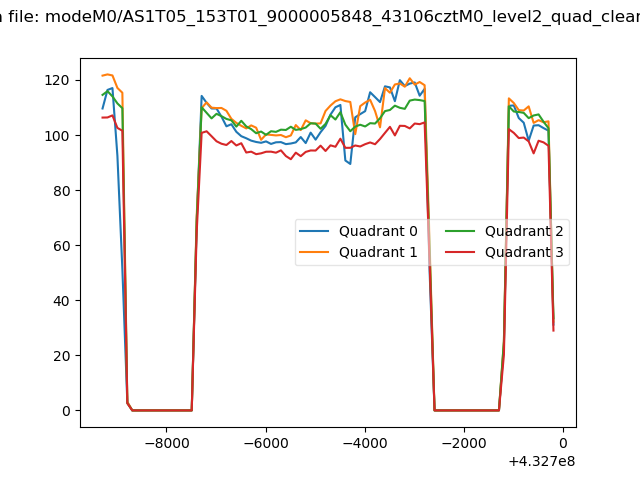 |
|
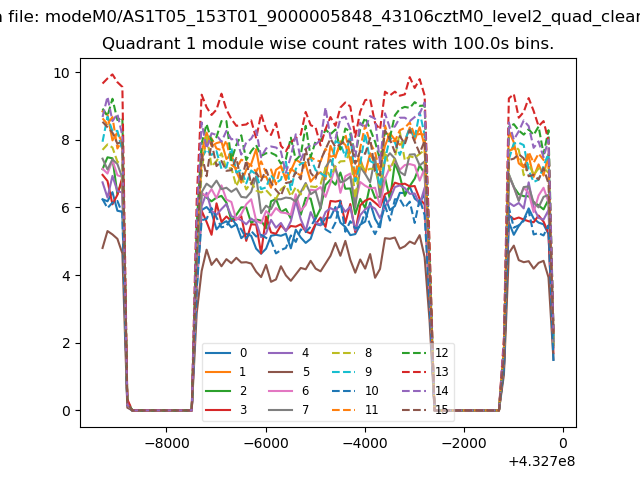
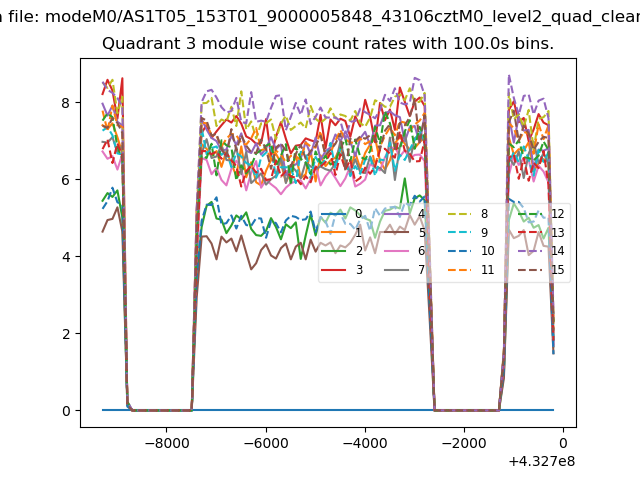
| Module-wise count rates for Quadrant A Data is divided into 100 sec bins |
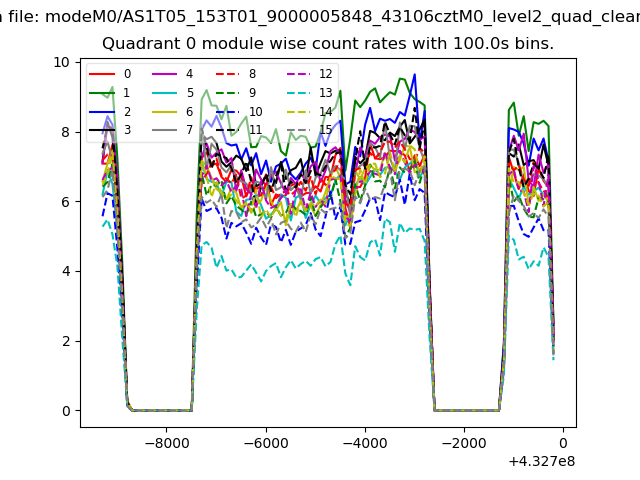 |
 |
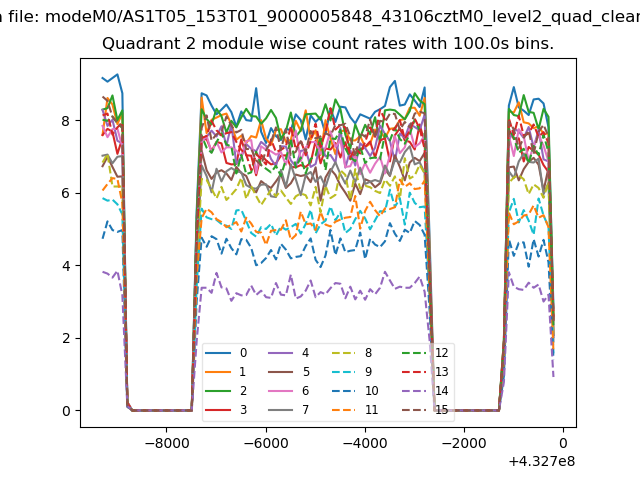
| Module-wise count rates for Quadrant B Data is divided into 100 sec bins |
 |
 |
| Module-wise count rates for Quadrant C Data is divided into 100 sec bins |
 |
 |
| Module-wise count rates for Quadrant D Data is divided into 100 sec bins |
 |
 |
| Parameter | Plot |
|---|---|
| CZT HV Monitor | 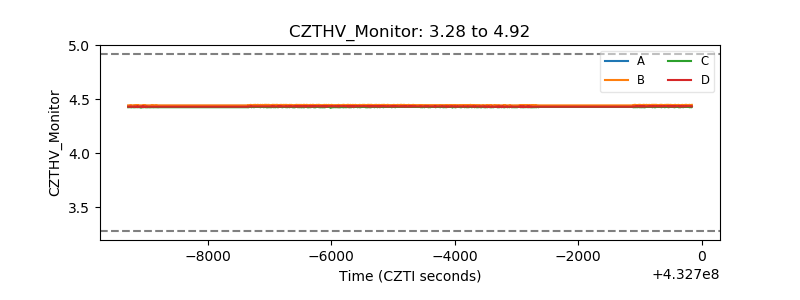 |
| D_VDD | 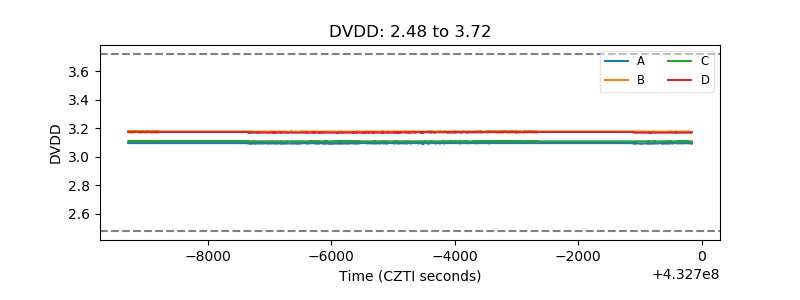 |
| Temperature 1 | 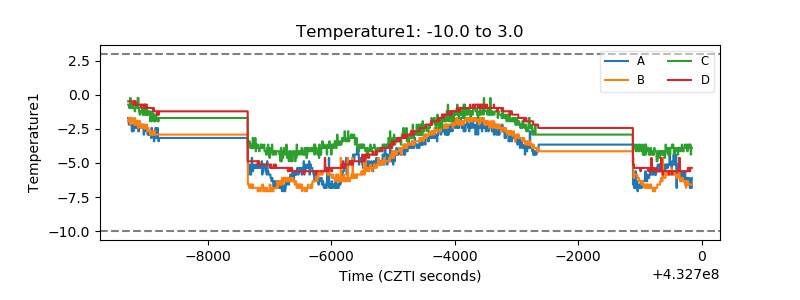 |
| Veto HV Monitor | 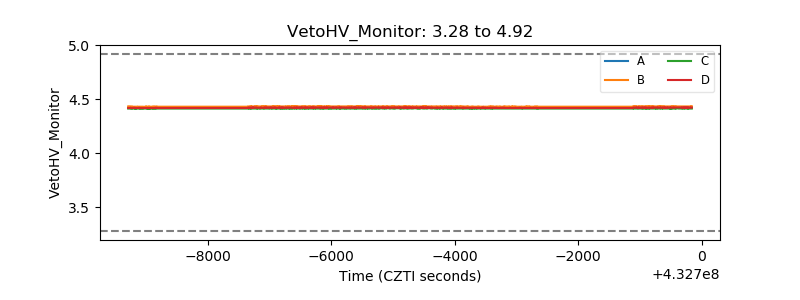 |
| Veto LLD | 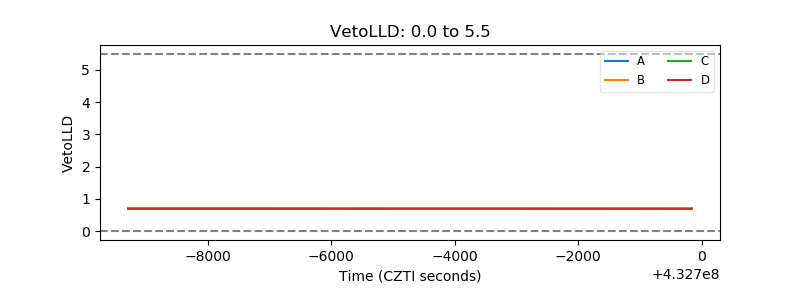 |
| Alpha Counter | 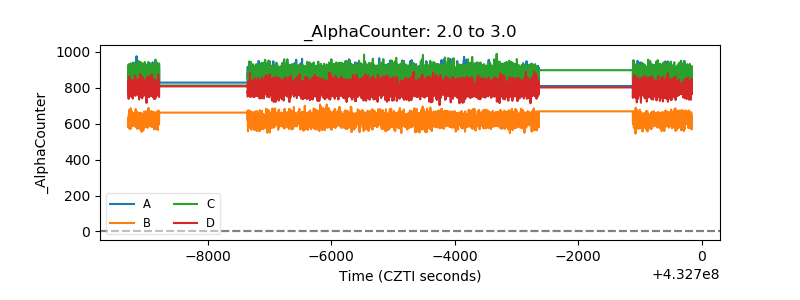 |
| _CPM_Rate | 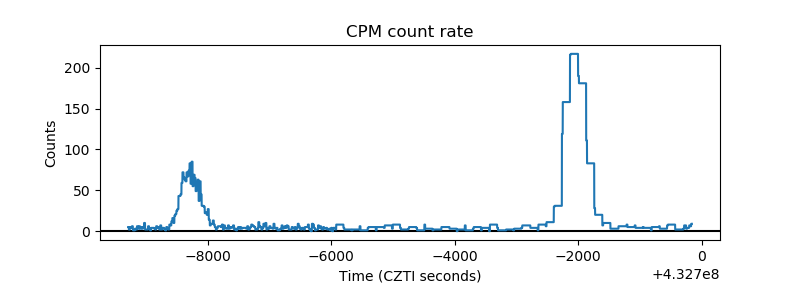 |
| CZT Counter | 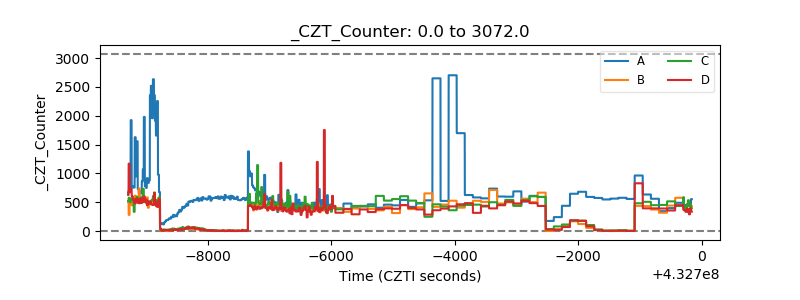 |
| +2.5 Volts monitor |  |
| +5 Volts monitor | 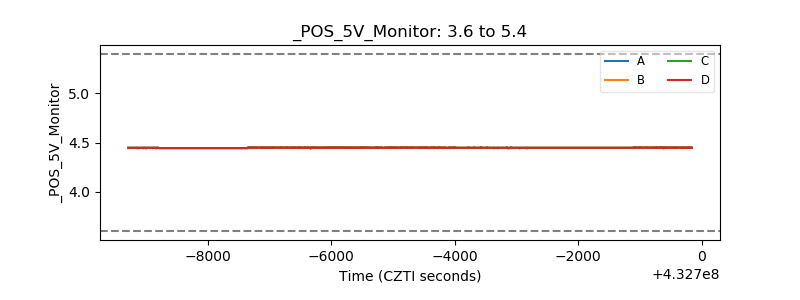 |
| _ROLL_ROT | 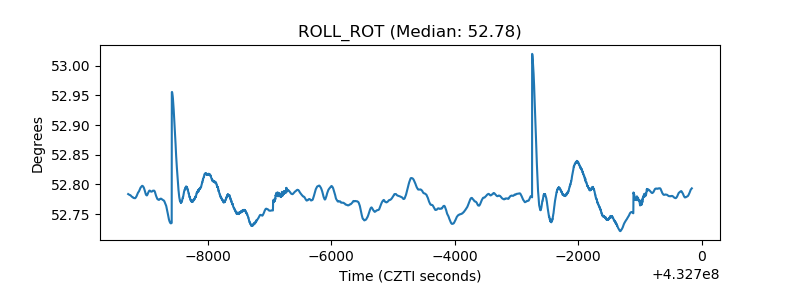 |
| _Roll_DEC | 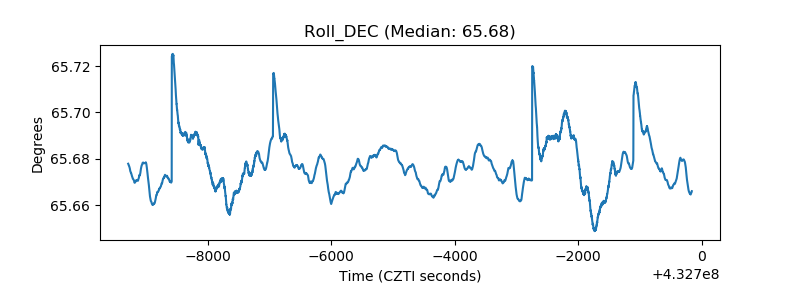 |
| _Roll_RA | 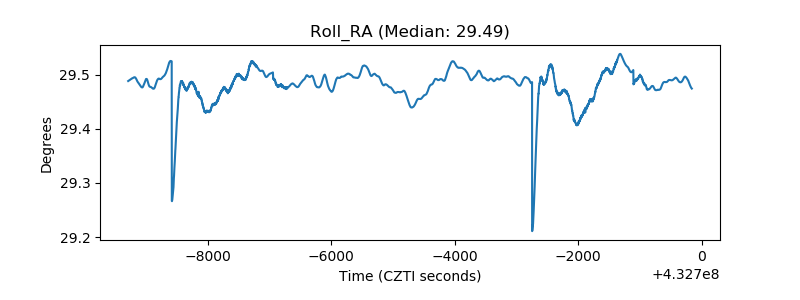 |
| Veto Counter | 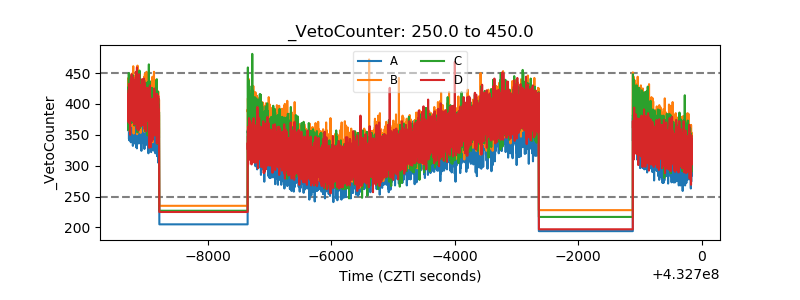 |