| Param | Original file | Final file |
|---|---|---|
| Filename | modeM0/AS1T05_153T01_9000005848_43107cztM0_level2.fits | modeM0/AS1T05_153T01_9000005848_43107cztM0_level2_quad_clean.evt |
| Size (bytes) | 358,159,680 | 99,244,800 |
| Size | 341.6 MB | 94.6 MB |
| Events in quadrant A | 3,871,178 | 654,186 |
| Events in quadrant B | 2,966,352 | 674,944 |
| Events in quadrant C | 3,214,402 | 647,217 |
| Events in quadrant D | 2,729,534 | 601,486 |
| Mode SS | |||
|---|---|---|---|
| Quadrant | BADHDUFLAG | Total packets | Discarded packets |
| A | 0 | 126 | 0 |
| B | 0 | 126 | 0 |
| C | 0 | 126 | 0 |
| D | 0 | 126 | 0 |
| Mode M9 | |||
|---|---|---|---|
| Quadrant | BADHDUFLAG | Total packets | Discarded packets |
| A | 0 | 32 | 0 |
| B | 0 | 32 | 0 |
| C | 0 | 32 | 0 |
| D | 0 | 32 | 0 |
| Mode M0 | |||
|---|---|---|---|
| Quadrant | BADHDUFLAG | Total packets | Discarded packets |
| A | 0 | 15463 | 2 |
| B | 0 | 13059 | 2 |
| C | 0 | 13529 | 2 |
| D | 0 | 12792 | 2 |
| Quadrant | Total seconds | Saturated seconds | Saturation percentage |
|---|---|---|---|
| A | 6117 | 147 | 2.403139% |
| B | 6118 | 13 | 0.212488% |
| C | 6118 | 73 | 1.193200% |
| D | 6118 | 30 | 0.490356% |
Noise dominated data is calculated using 1-second bins in cleaned event files. If a bin has >2000 counts, and if more than 50% of those come from <1% of pixels, then it is considered to be noise-dominated and hence unusable.
| Quadrant | # 1 sec bins | Bins with >0 counts | Bins with >2000 counts | High rate bins dominated by noise | Noise dominated (total time) | Noise dominated (detector-on time) | Marked lightcurve |
|---|---|---|---|---|---|---|---|
| A | 9312 | 6119 | 92 | 92 | 0.99% | 1.50% | 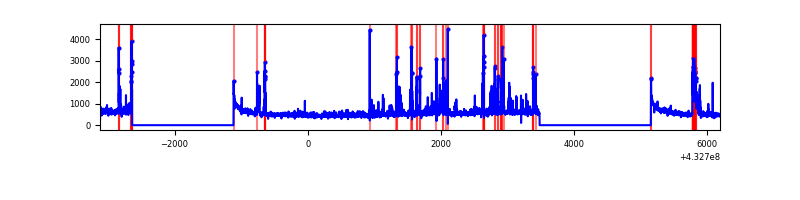 |
| B | 9313 | 6120 | 7 | 7 | 0.08% | 0.11% | 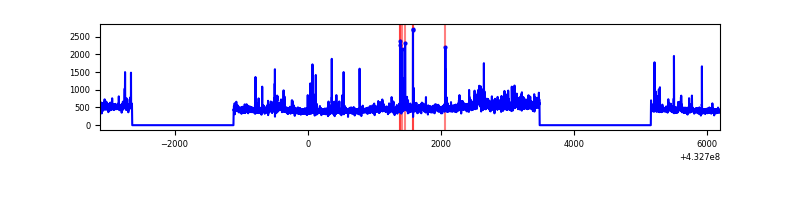 |
| C | 9313 | 6120 | 59 | 59 | 0.63% | 0.96% | 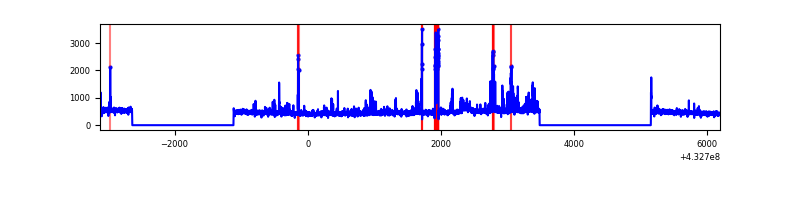 |
| D | 9313 | 6120 | 18 | 18 | 0.19% | 0.29% | 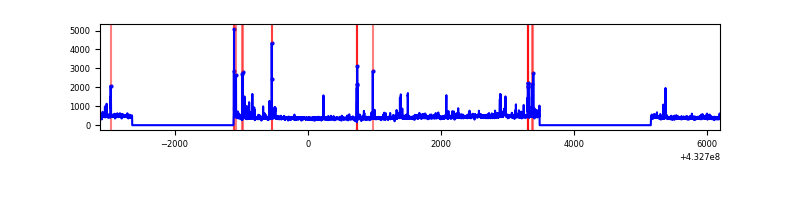 |
Top three noisy pixels from each quadrant. If the there are fewer than three noisy pixels in the level2.evt file, extra rows are filled as -1
| Pixel properties | Quadrant properties | ||||||
|---|---|---|---|---|---|---|---|
| Quadrant | DetID | PixID | Counts | Sigma | Mean | Median | Sigma |
| A | 10 | 83 | 650316 | 4827.92 | 656 | 642 | 134.6 |
| A | 15 | 237 | 475324 | 3527.5 | 656 | 642 | 134.6 |
| A | 15 | 222 | 107232 | 792.1 | 656 | 642 | 134.6 |
| B | 0 | 229 | 245215 | 1929.86 | 655 | 636 | 126.7 |
| B | 5 | 255 | 106565 | 835.84 | 655 | 636 | 126.7 |
| B | 3 | 112 | 27708 | 213.61 | 655 | 636 | 126.7 |
| C | 0 | 239 | 282604 | 1872.61 | 642 | 645 | 150.6 |
| C | 15 | 214 | 275512 | 1825.51 | 642 | 645 | 150.6 |
| C | 8 | 79 | 70561 | 464.34 | 642 | 645 | 150.6 |
| D | 1 | 52 | 102138 | 652.32 | 642 | 623 | 155.6 |
| D | 13 | 249 | 51161 | 324.75 | 642 | 623 | 155.6 |
| D | 12 | 233 | 36060 | 227.71 | 642 | 623 | 155.6 |
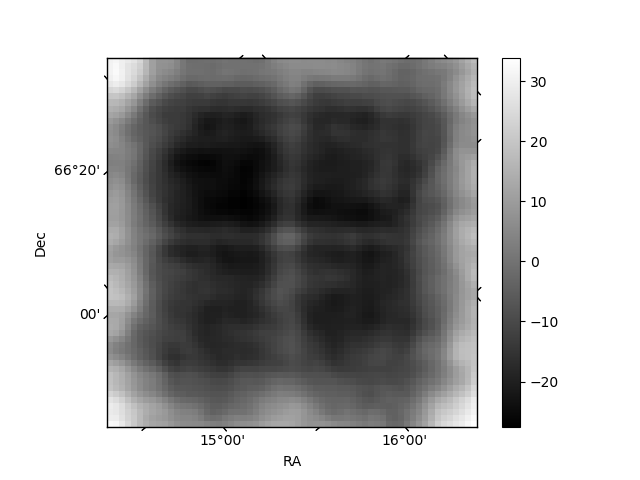
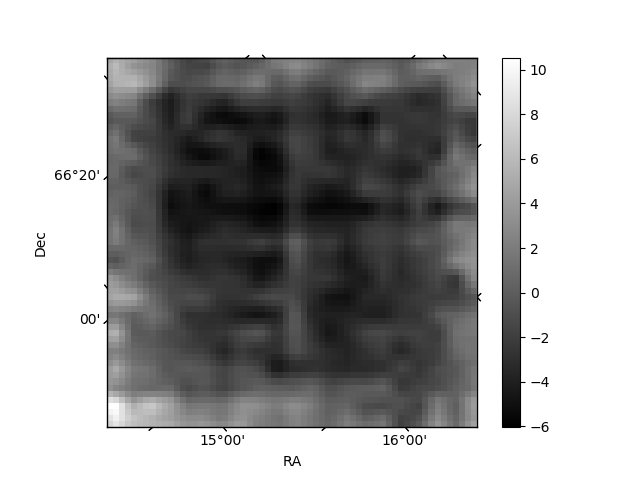
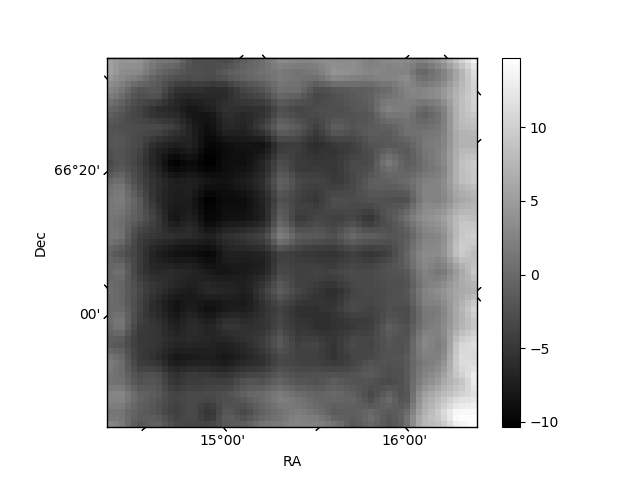
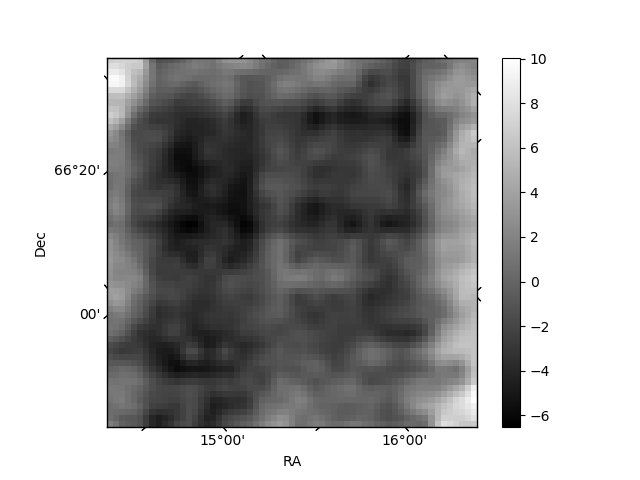
Histogram calculated using DETX and DETY for each event in the final _common_clean file
| Quadrant A | 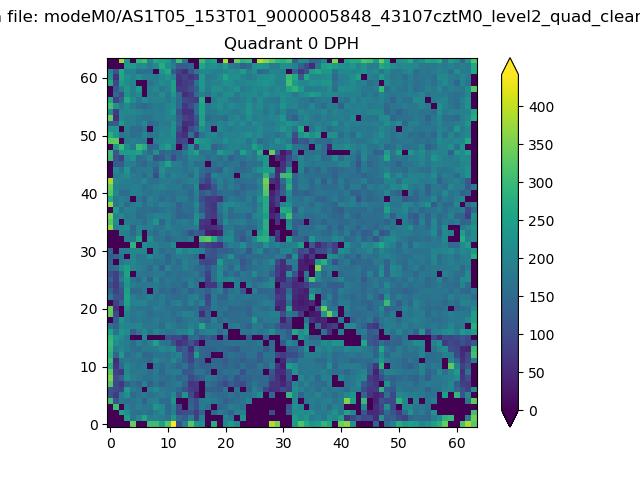 |
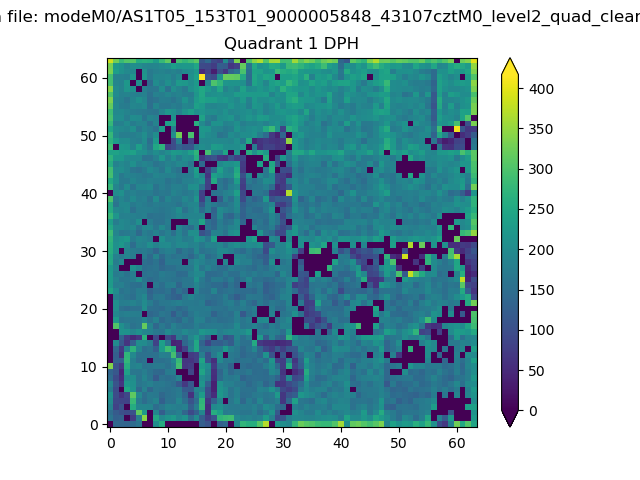 |
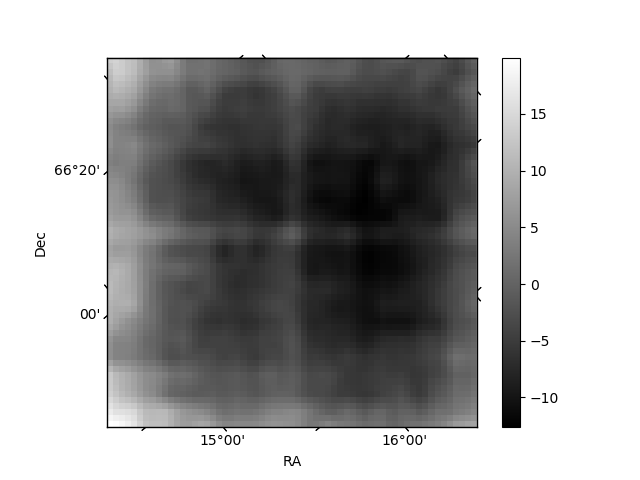
Quadrant B |
|---|---|---|---|
| Quadrant D | 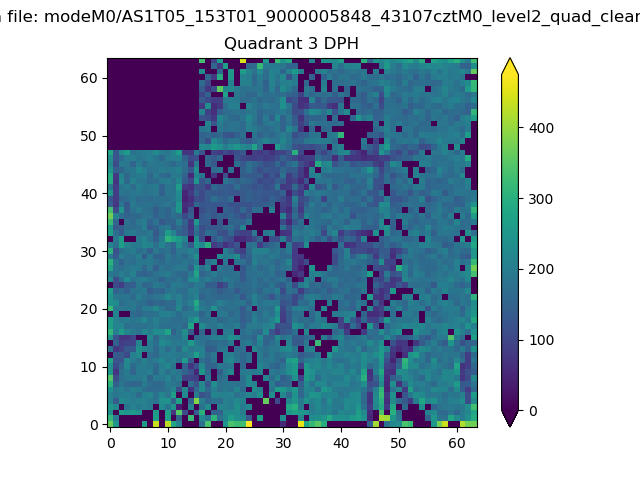 |
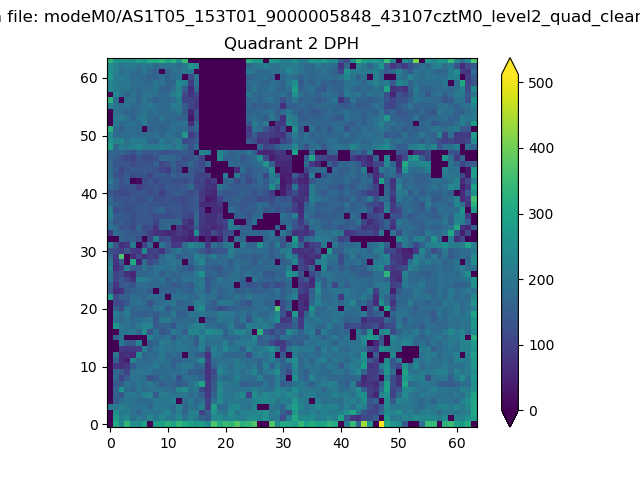 |
Quadrant C |
| Plot type | Count rate plots | Images |
|---|---|---|
| Comparison with Poisson distribution Blue bars denote a histogram of data divided into 1 sec bins. Red curve is a Poisson curve with rate = median count rate of data. |
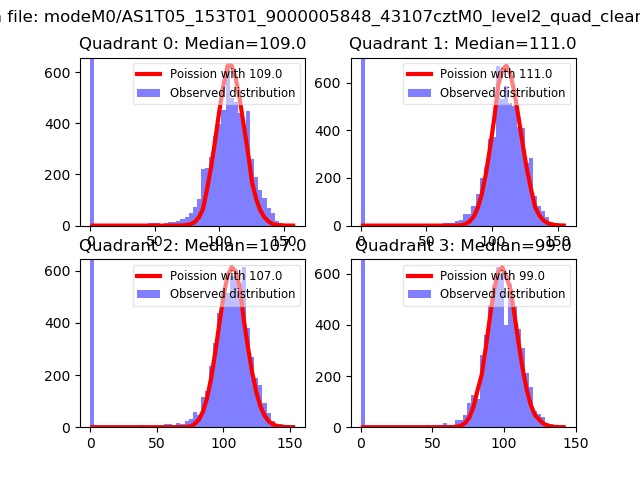 |
 |
| Quadrant-wise count rates Data is divided into 100 sec bins |
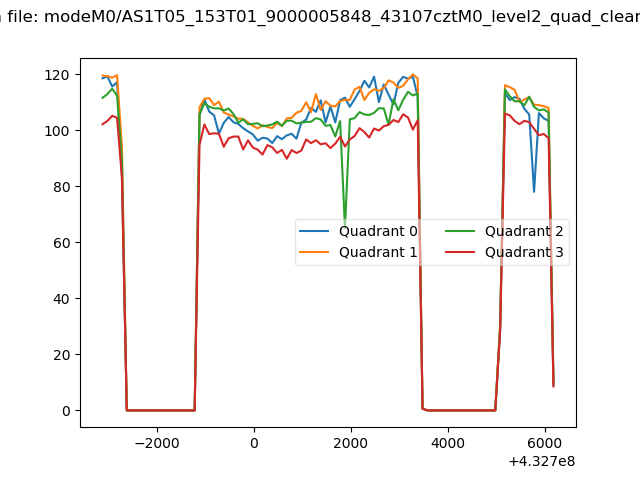 |
|
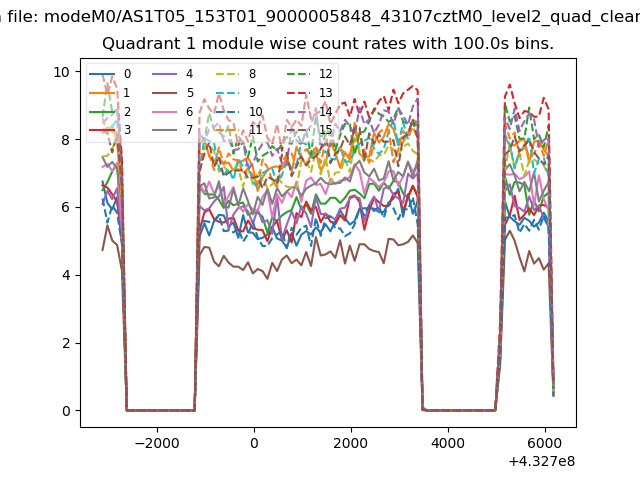
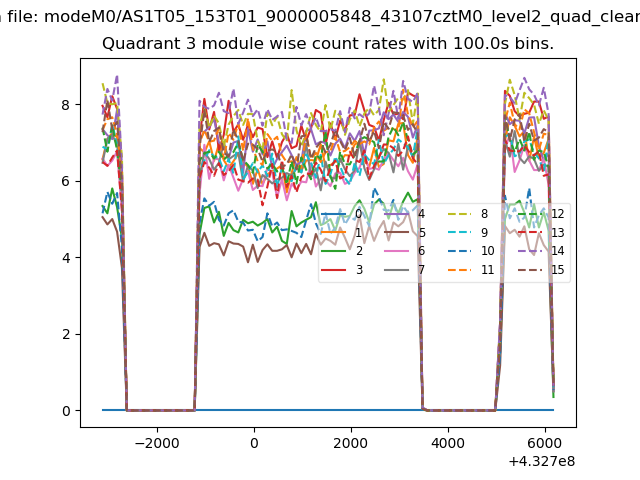
| Module-wise count rates for Quadrant A Data is divided into 100 sec bins |
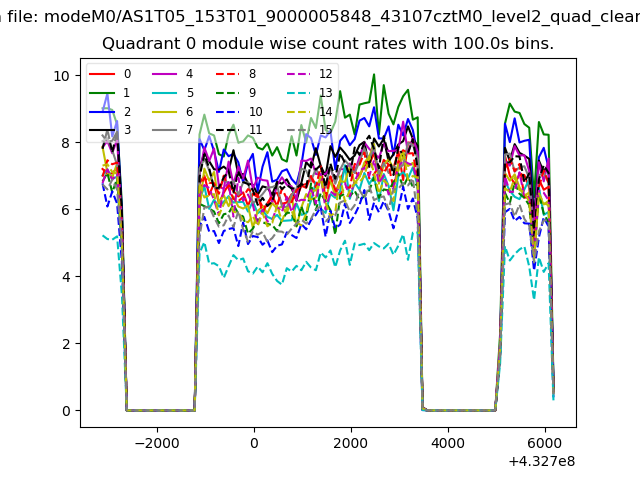 |
 |
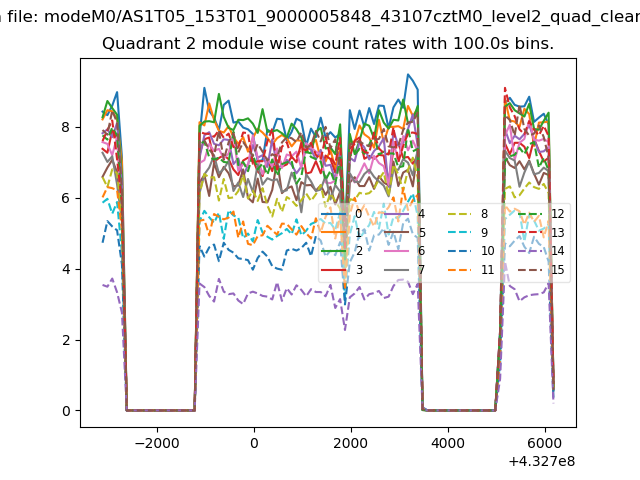
| Module-wise count rates for Quadrant B Data is divided into 100 sec bins |
 |
 |
| Module-wise count rates for Quadrant C Data is divided into 100 sec bins |
 |
 |
| Module-wise count rates for Quadrant D Data is divided into 100 sec bins |
 |
 |
| Parameter | Plot |
|---|---|
| CZT HV Monitor | 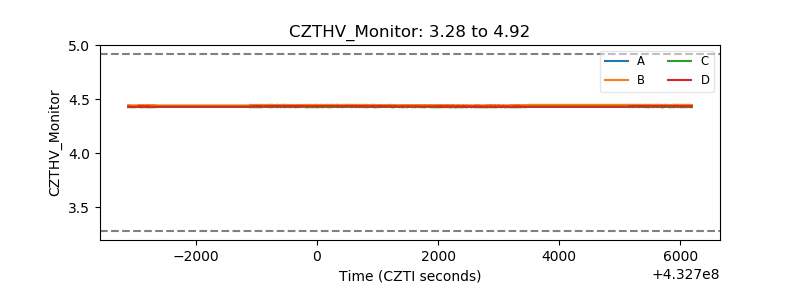 |
| D_VDD | 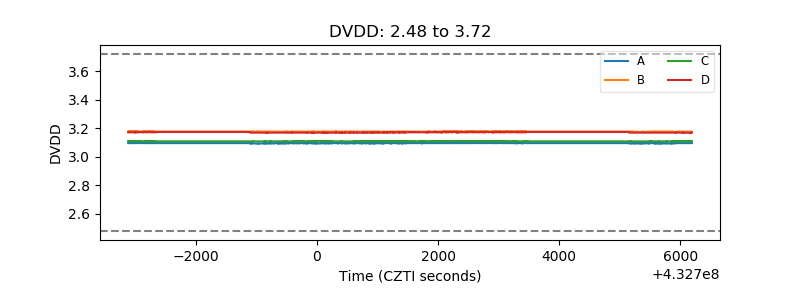 |
| Temperature 1 | 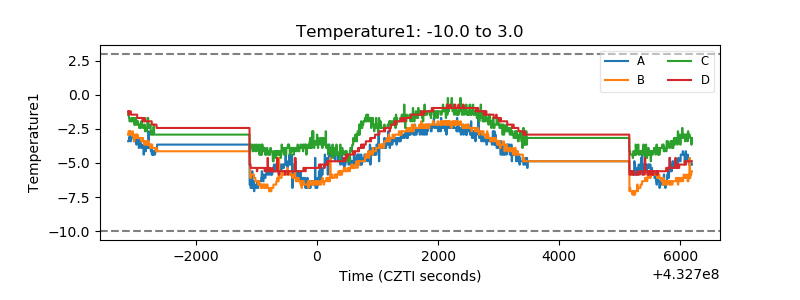 |
| Veto HV Monitor | 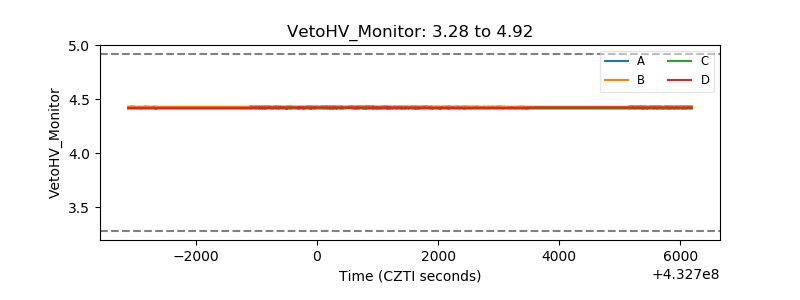 |
| Veto LLD | 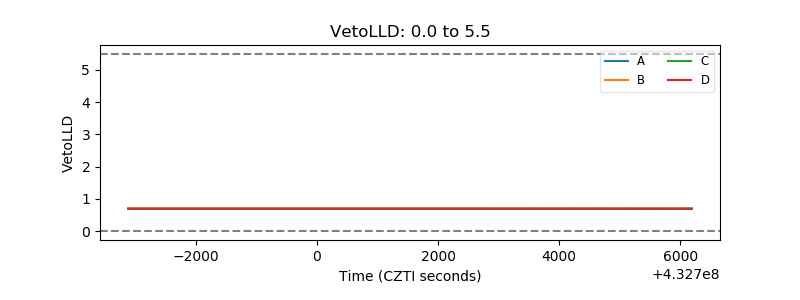 |
| Alpha Counter | 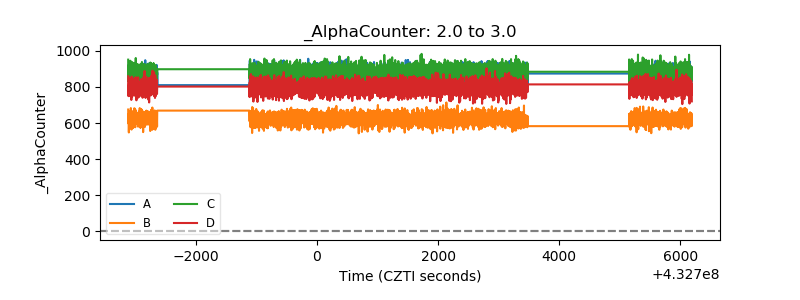 |
| _CPM_Rate | 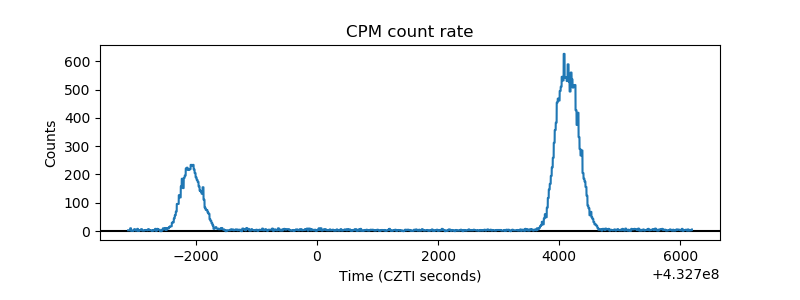 |
| CZT Counter | 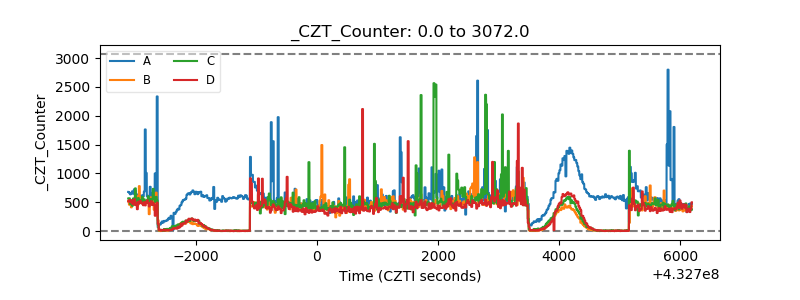 |
| +2.5 Volts monitor | 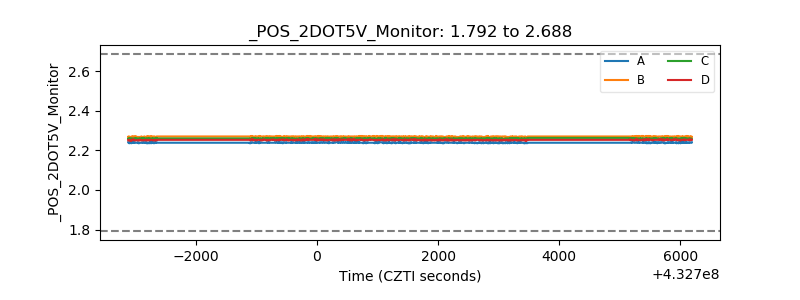 |
| +5 Volts monitor | 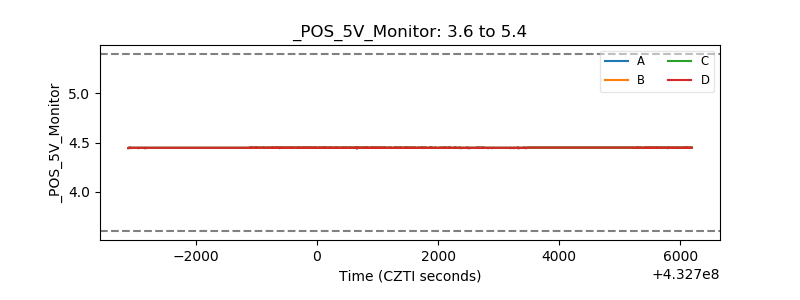 |
| _ROLL_ROT |  |
| _Roll_DEC | 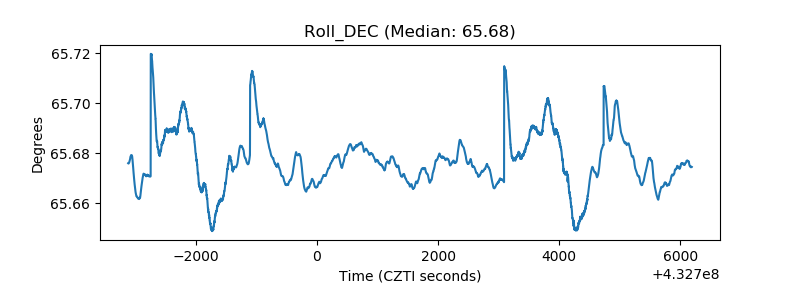 |
| _Roll_RA | 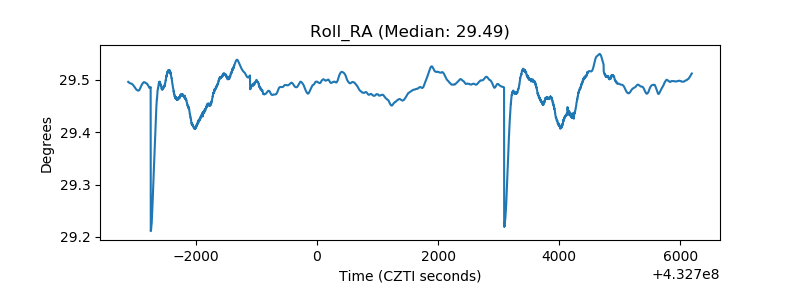 |
| Veto Counter | 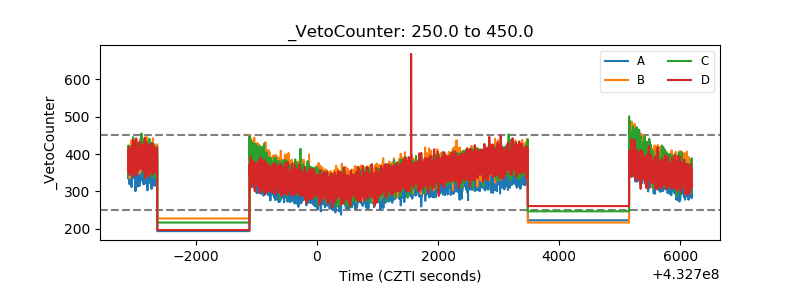 |