| Param | Original file | Final file |
|---|---|---|
| Filename | modeM0/AS1T05_153T01_9000005848_43109cztM0_level2.fits | modeM0/AS1T05_153T01_9000005848_43109cztM0_level2_quad_clean.evt |
| Size (bytes) | 224,637,120 | 62,110,080 |
| Size | 214.2 MB | 59.2 MB |
| Events in quadrant A | 2,662,192 | 406,392 |
| Events in quadrant B | 1,667,323 | 425,866 |
| Events in quadrant C | 1,777,136 | 406,279 |
| Events in quadrant D | 1,909,660 | 372,441 |
| Mode SS | |||
|---|---|---|---|
| Quadrant | BADHDUFLAG | Total packets | Discarded packets |
| A | 0 | 76 | 0 |
| B | 0 | 76 | 0 |
| C | 0 | 76 | 0 |
| D | 0 | 76 | 0 |
| Mode M0 | |||
|---|---|---|---|
| Quadrant | BADHDUFLAG | Total packets | Discarded packets |
| A | 0 | 10365 | 0 |
| B | 0 | 7763 | 0 |
| C | 0 | 7870 | 0 |
| D | 0 | 8563 | 0 |
| Quadrant | Total seconds | Saturated seconds | Saturation percentage |
|---|---|---|---|
| A | 3818 | 190 | 4.976427% |
| B | 3819 | 5 | 0.130924% |
| C | 3819 | 1 | 0.026185% |
| D | 3819 | 43 | 1.125949% |
Noise dominated data is calculated using 1-second bins in cleaned event files. If a bin has >2000 counts, and if more than 50% of those come from <1% of pixels, then it is considered to be noise-dominated and hence unusable.
| Quadrant | # 1 sec bins | Bins with >0 counts | Bins with >2000 counts | High rate bins dominated by noise | Noise dominated (total time) | Noise dominated (detector-on time) | Marked lightcurve |
|---|---|---|---|---|---|---|---|
| A | 3818 | 3818 | 138 | 138 | 3.61% | 3.61% | 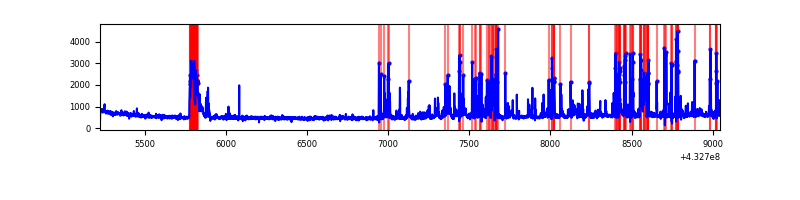 |
| B | 3819 | 3819 | 1 | 1 | 0.03% | 0.03% | 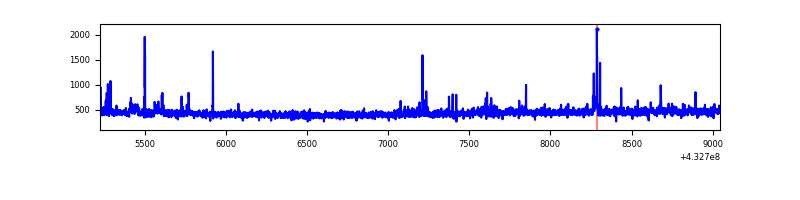 |
| C | 3819 | 3819 | 0 | 0 | 0.00% | 0.00% | 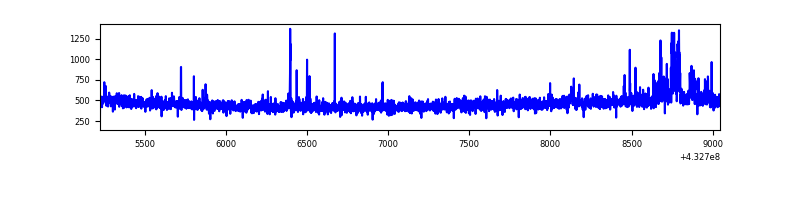 |
| D | 3819 | 3819 | 41 | 41 | 1.07% | 1.07% | 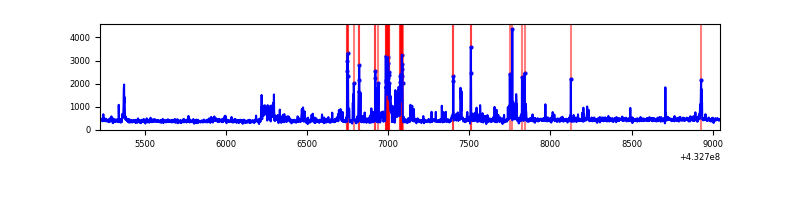 |
Top three noisy pixels from each quadrant. If the there are fewer than three noisy pixels in the level2.evt file, extra rows are filled as -1
| Pixel properties | Quadrant properties | ||||||
|---|---|---|---|---|---|---|---|
| Quadrant | DetID | PixID | Counts | Sigma | Mean | Median | Sigma |
| A | 15 | 222 | 497609 | 5932.89 | 401 | 392 | 83.8 |
| A | 10 | 83 | 336236 | 4007.35 | 401 | 392 | 83.8 |
| A | 15 | 237 | 274443 | 3270.03 | 401 | 392 | 83.8 |
| B | 0 | 229 | 27040 | 341.38 | 403 | 391 | 78.1 |
| B | 5 | 255 | 25752 | 324.88 | 403 | 391 | 78.1 |
| B | 3 | 112 | 13796 | 171.72 | 403 | 391 | 78.1 |
| C | 15 | 214 | 169642 | 1828.95 | 392 | 394 | 92.5 |
| C | 1 | 226 | 31549 | 336.67 | 392 | 394 | 92.5 |
| C | 0 | 239 | 21733 | 230.6 | 392 | 394 | 92.5 |
| D | 1 | 52 | 319931 | 3381.69 | 393 | 382 | 94.5 |
| D | 12 | 233 | 21946 | 228.2 | 393 | 382 | 94.5 |
| D | 2 | 234 | 17894 | 185.32 | 393 | 382 | 94.5 |
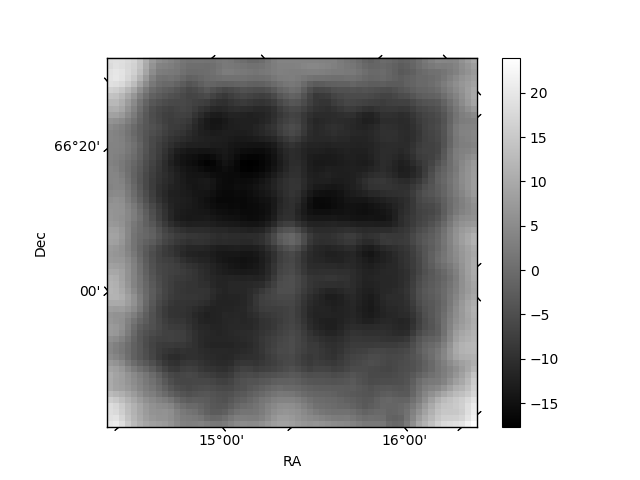
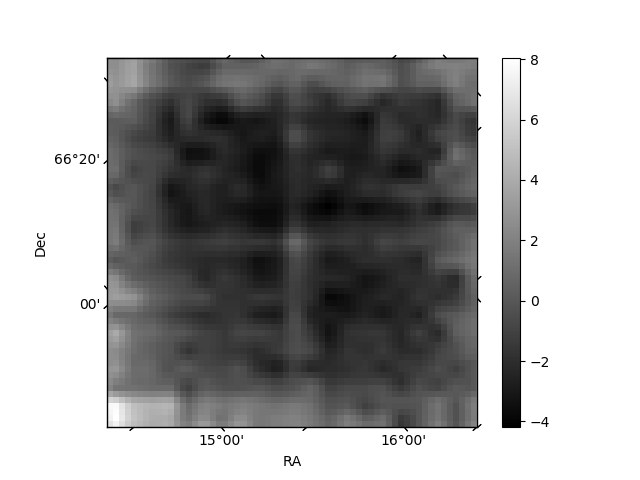
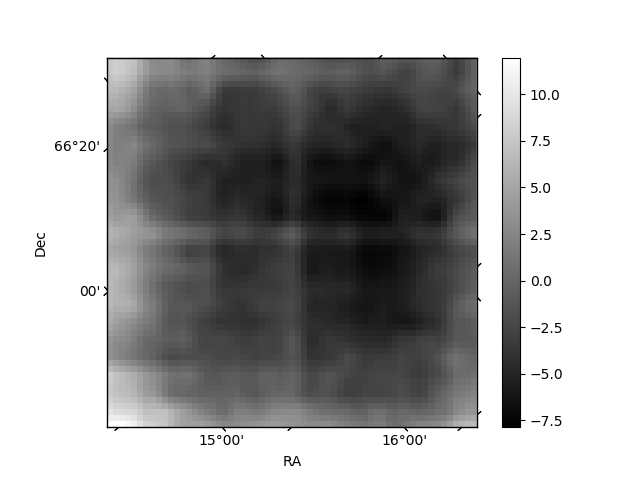
Histogram calculated using DETX and DETY for each event in the final _common_clean file
| Quadrant A | 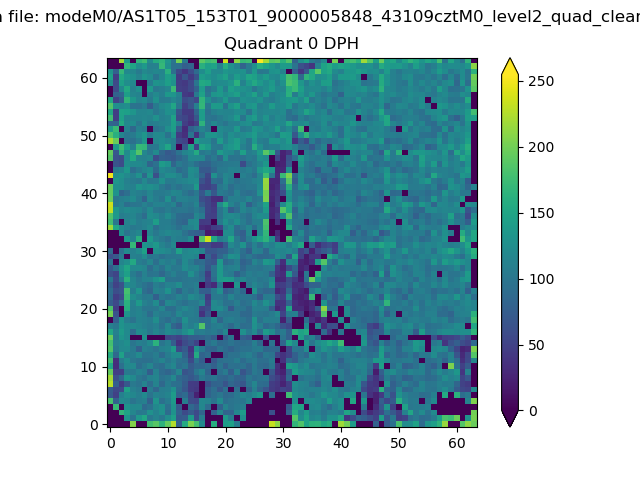 |
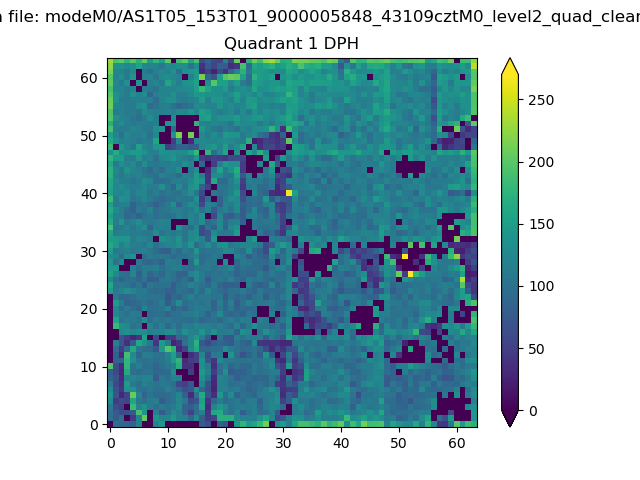 |
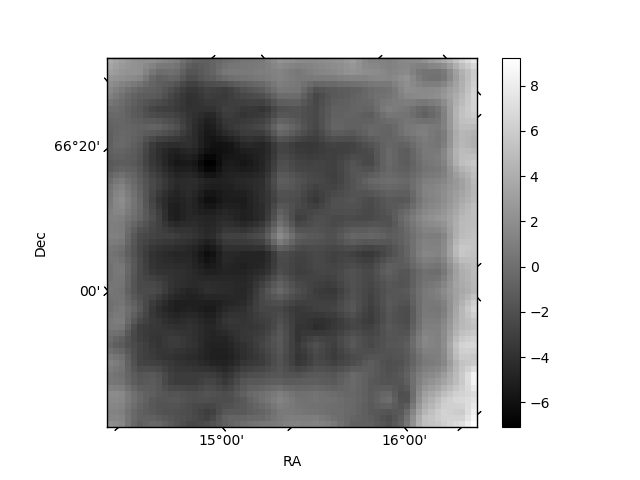
Quadrant B |
|---|---|---|---|
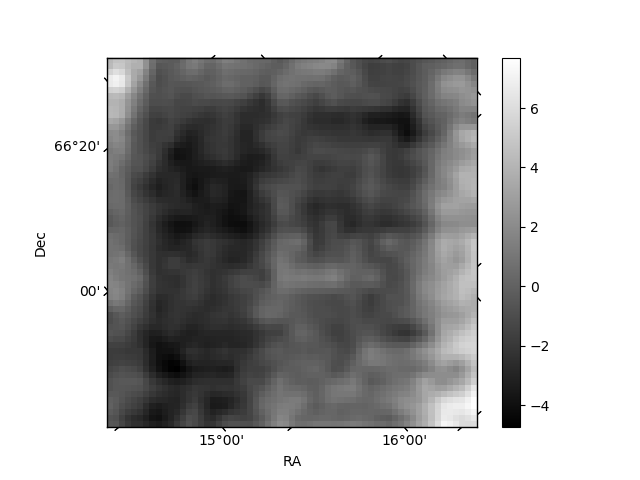
| Quadrant D | 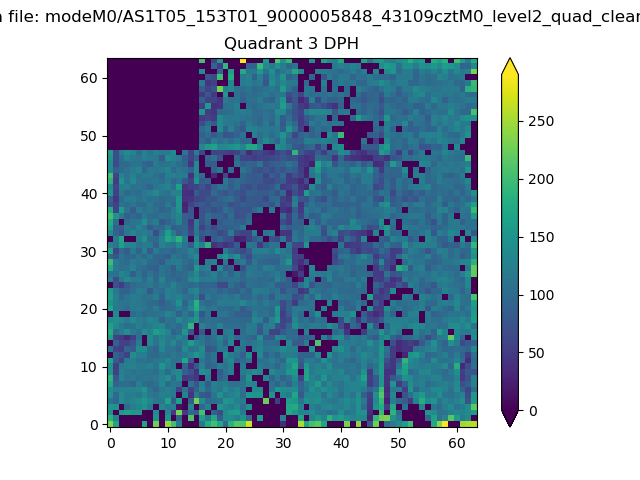 |
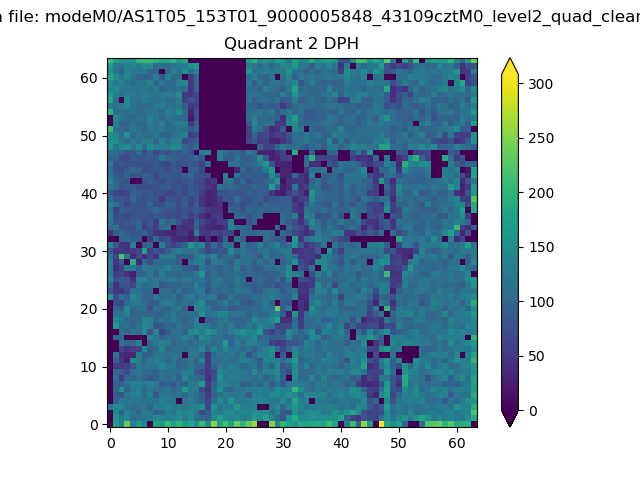 |
Quadrant C |
| Plot type | Count rate plots | Images |
|---|---|---|
| Comparison with Poisson distribution Blue bars denote a histogram of data divided into 1 sec bins. Red curve is a Poisson curve with rate = median count rate of data. |
 |
 |
| Quadrant-wise count rates Data is divided into 100 sec bins |
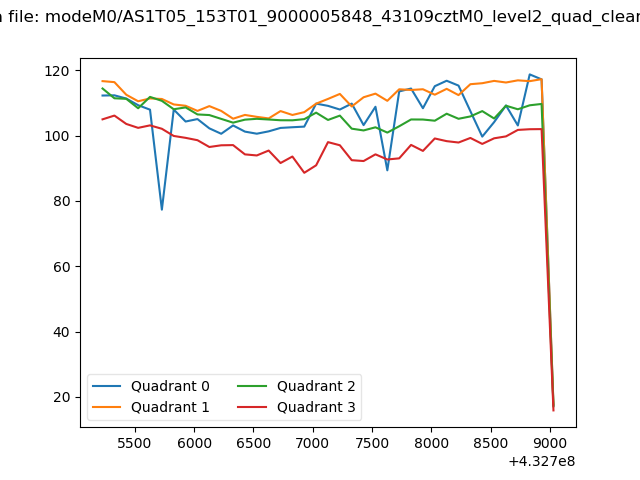 |
|
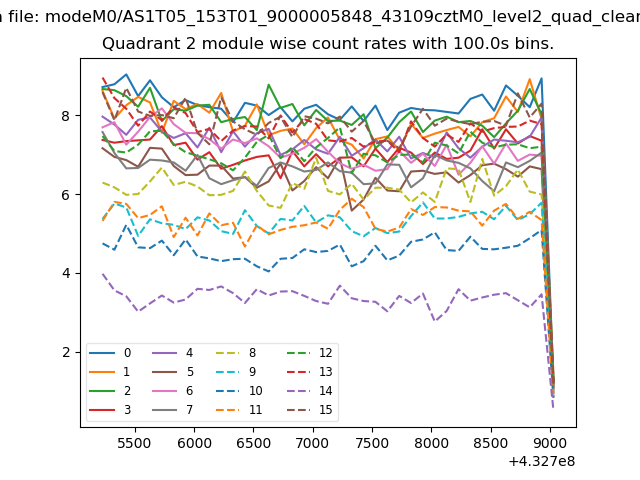
| Module-wise count rates for Quadrant A Data is divided into 100 sec bins |
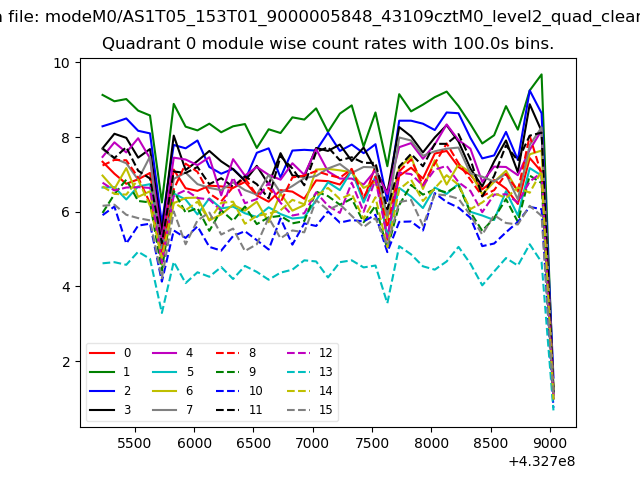 |
 |
| Module-wise count rates for Quadrant B Data is divided into 100 sec bins |
 |
 |
| Module-wise count rates for Quadrant C Data is divided into 100 sec bins |
 |
 |
| Module-wise count rates for Quadrant D Data is divided into 100 sec bins |
 |
 |
| Parameter | Plot |
|---|---|
| CZT HV Monitor | 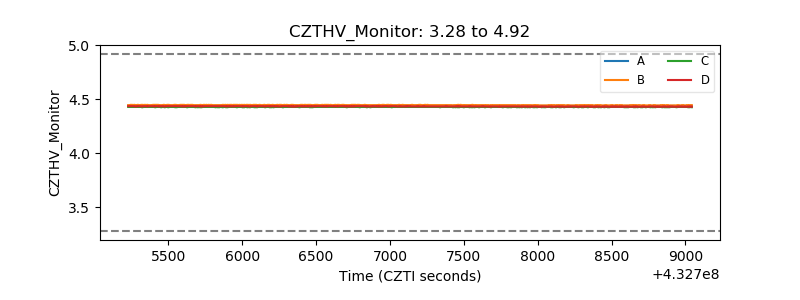 |
| D_VDD | 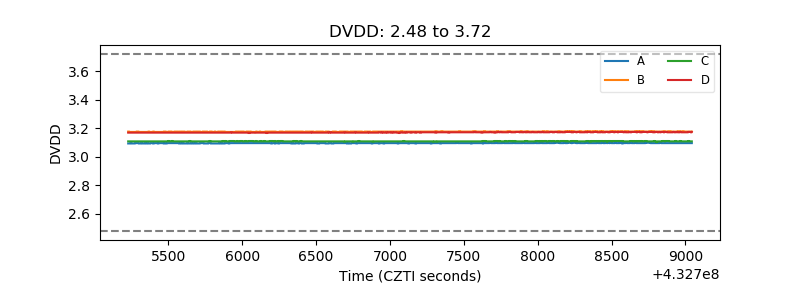 |
| Temperature 1 | 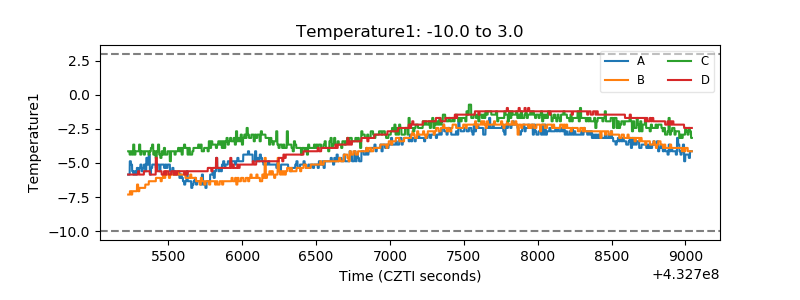 |
| Veto HV Monitor | 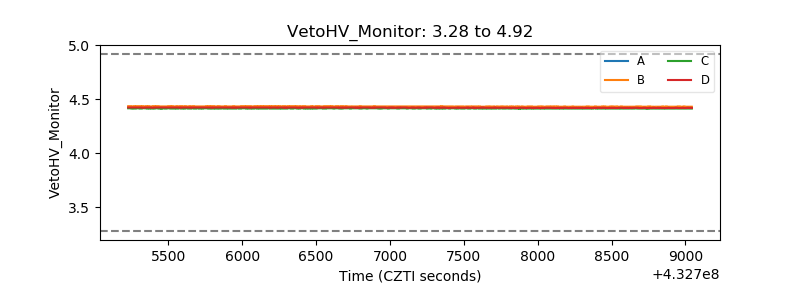 |
| Veto LLD | 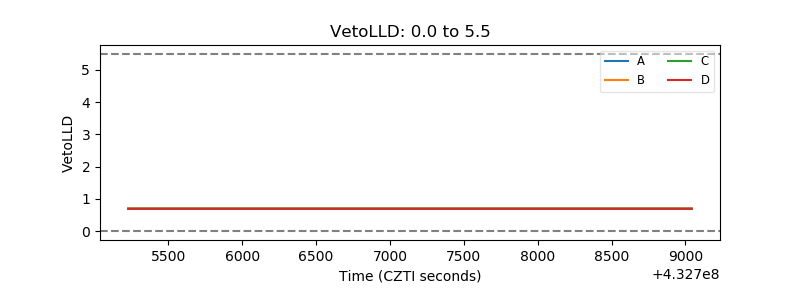 |
| Alpha Counter | 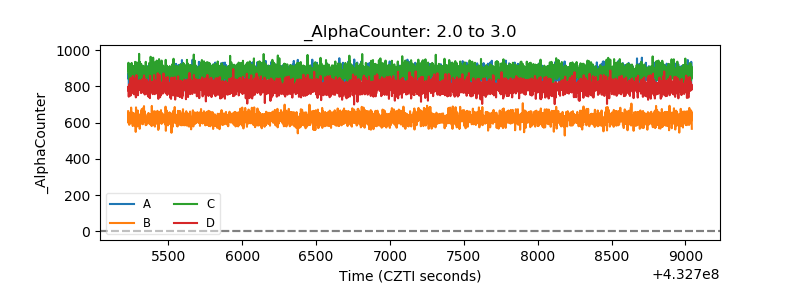 |
| _CPM_Rate | 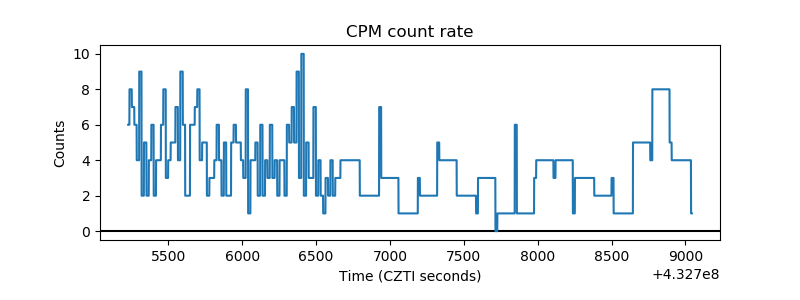 |
| CZT Counter | 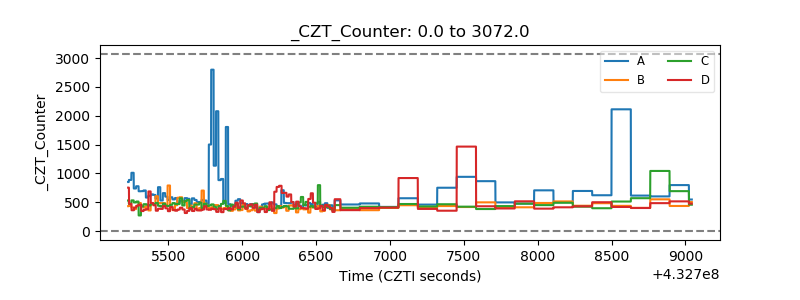 |
| +2.5 Volts monitor | 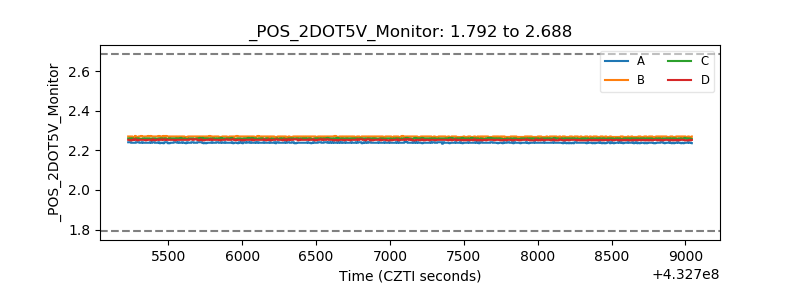 |
| +5 Volts monitor |  |
| _ROLL_ROT | 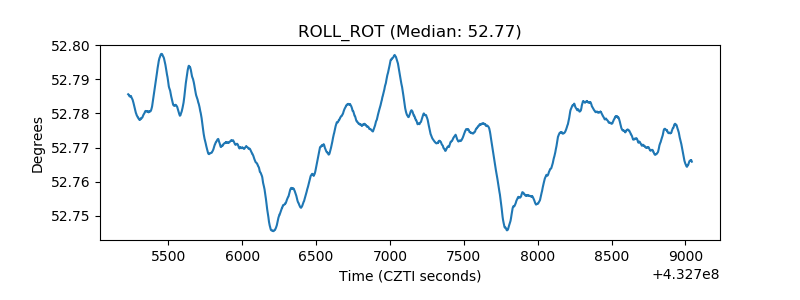 |
| _Roll_DEC | 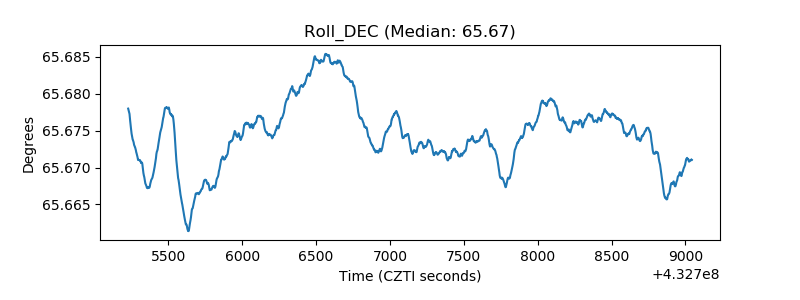 |
| _Roll_RA | 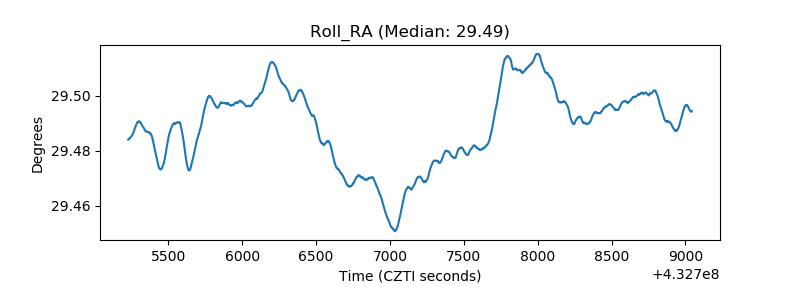 |
| Veto Counter | 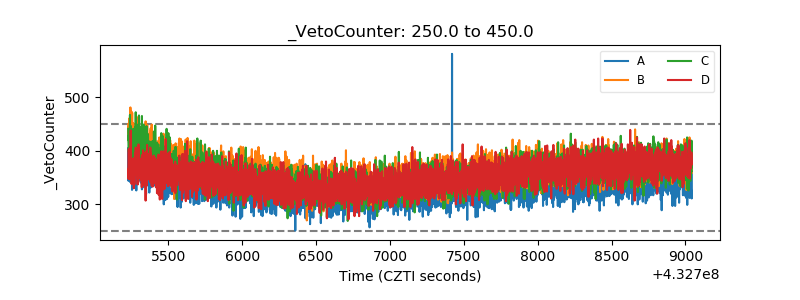 |