| Param | Original file | Final file |
|---|---|---|
| Filename | modeM0/AS1T05_154T01_9000005850_43109cztM0_level2.fits | modeM0/AS1T05_154T01_9000005850_43109cztM0_level2_quad_clean.evt |
| Size (bytes) | 70,931,520 | 20,643,840 |
| Size | 67.6 MB | 19.7 MB |
| Events in quadrant A | 815,397 | 133,058 |
| Events in quadrant B | 527,435 | 140,476 |
| Events in quadrant C | 626,051 | 136,354 |
| Events in quadrant D | 562,258 | 126,476 |
| Mode M0 | |||
|---|---|---|---|
| Quadrant | BADHDUFLAG | Total packets | Discarded packets |
| A | 0 | 3192 | 1 |
| B | 0 | 2364 | 1 |
| C | 0 | 2574 | 1 |
| D | 0 | 2507 | 1 |
| Mode SS | |||
|---|---|---|---|
| Quadrant | BADHDUFLAG | Total packets | Discarded packets |
| A | 0 | 26 | 0 |
| B | 0 | 26 | 0 |
| C | 0 | 26 | 0 |
| D | 0 | 26 | 0 |
| Mode M9 | |||
|---|---|---|---|
| Quadrant | BADHDUFLAG | Total packets | Discarded packets |
| A | 0 | 18 | 0 |
| B | 0 | 18 | 0 |
| C | 0 | 18 | 0 |
| D | 0 | 18 | 0 |
| Quadrant | Total seconds | Saturated seconds | Saturation percentage |
|---|---|---|---|
| A | 1173 | 42 | 3.580563% |
| B | 1173 | 3 | 0.255754% |
| C | 1173 | 1 | 0.085251% |
| D | 1173 | 7 | 0.596760% |
Noise dominated data is calculated using 1-second bins in cleaned event files. If a bin has >2000 counts, and if more than 50% of those come from <1% of pixels, then it is considered to be noise-dominated and hence unusable.
| Quadrant | # 1 sec bins | Bins with >0 counts | Bins with >2000 counts | High rate bins dominated by noise | Noise dominated (total time) | Noise dominated (detector-on time) | Marked lightcurve |
|---|---|---|---|---|---|---|---|
| A | 2966 | 1174 | 22 | 22 | 0.74% | 1.87% | 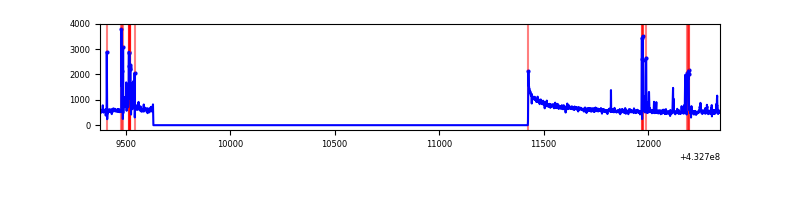 |
| B | 2966 | 1174 | 1 | 1 | 0.03% | 0.09% | 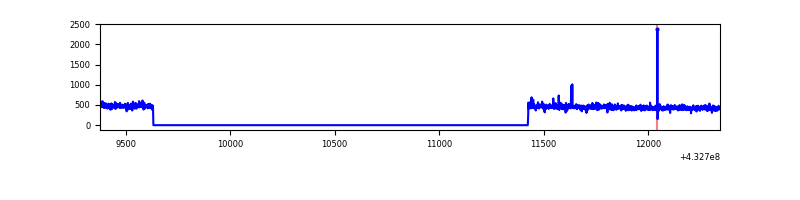 |
| C | 2966 | 1174 | 0 | 0 | 0.00% | 0.00% | 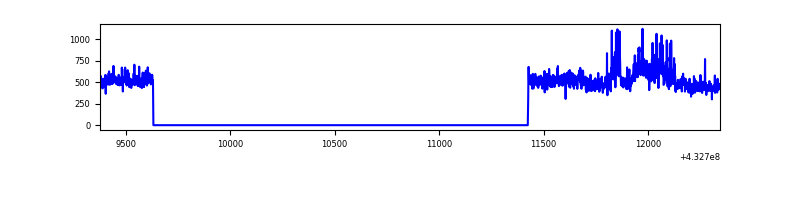 |
| D | 2966 | 1174 | 6 | 6 | 0.20% | 0.51% | 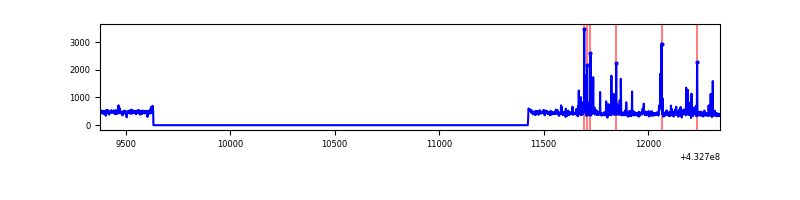 |
Top three noisy pixels from each quadrant. If the there are fewer than three noisy pixels in the level2.evt file, extra rows are filled as -1
| Pixel properties | Quadrant properties | ||||||
|---|---|---|---|---|---|---|---|
| Quadrant | DetID | PixID | Counts | Sigma | Mean | Median | Sigma |
| A | 10 | 83 | 179247 | 6250.44 | 129 | 127 | 28.7 |
| A | 15 | 222 | 125429 | 4372.44 | 129 | 127 | 28.7 |
| A | 15 | 237 | 6429 | 219.91 | 129 | 127 | 28.7 |
| B | 12 | 111 | 3294 | 116.64 | 131 | 128 | 27.1 |
| B | 0 | 229 | 3161 | 111.74 | 131 | 128 | 27.1 |
| B | 3 | 112 | 3122 | 110.3 | 131 | 128 | 27.1 |
| C | 0 | 239 | 63971 | 2027.81 | 127 | 127 | 31.5 |
| C | 15 | 214 | 58147 | 1842.83 | 127 | 127 | 31.5 |
| C | 0 | 207 | 1819 | 53.74 | 127 | 127 | 31.5 |
| D | 2 | 249 | 67785 | 2055.51 | 127 | 122 | 32.9 |
| D | 1 | 52 | 6953 | 207.52 | 127 | 122 | 32.9 |
| D | 2 | 234 | 4252 | 125.46 | 127 | 122 | 32.9 |
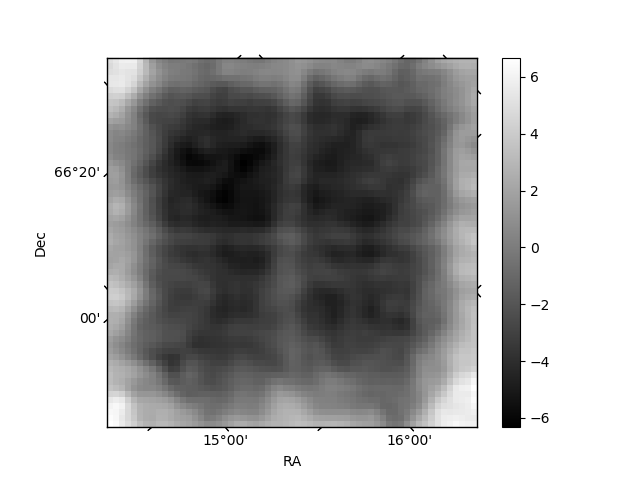
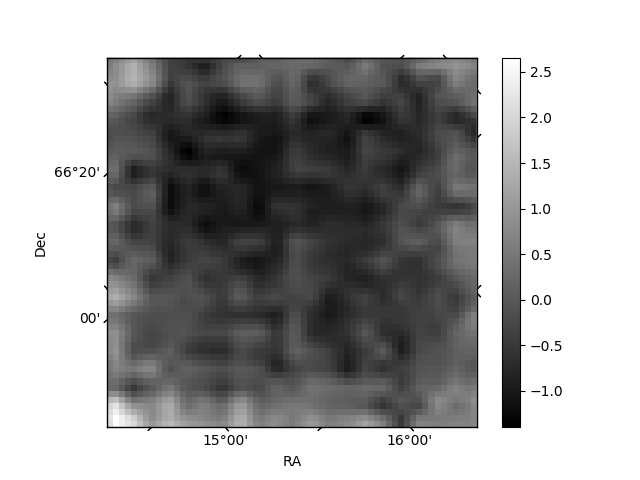
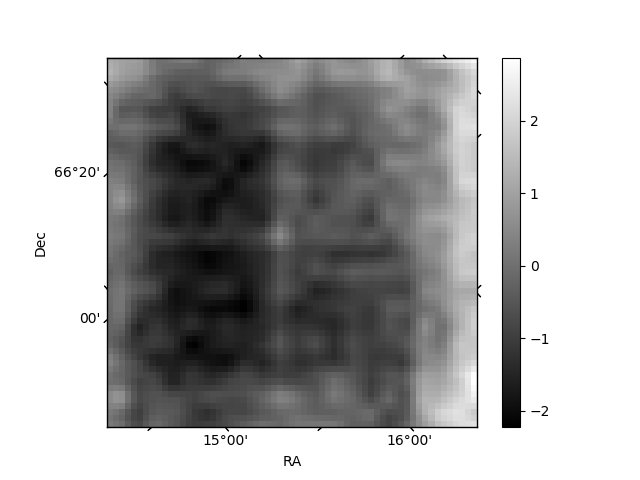
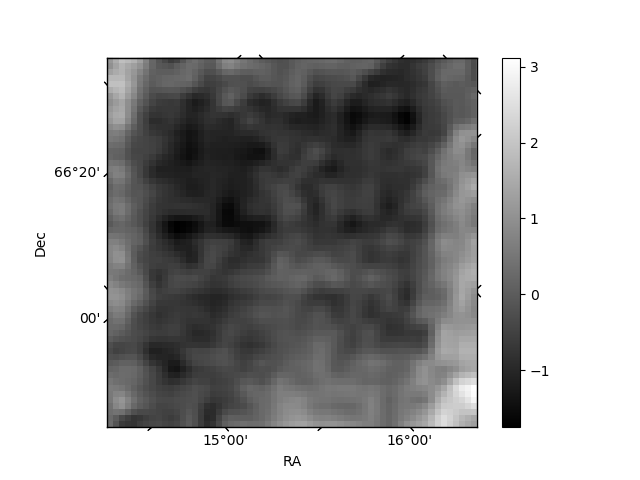
Histogram calculated using DETX and DETY for each event in the final _common_clean file
| Quadrant A | 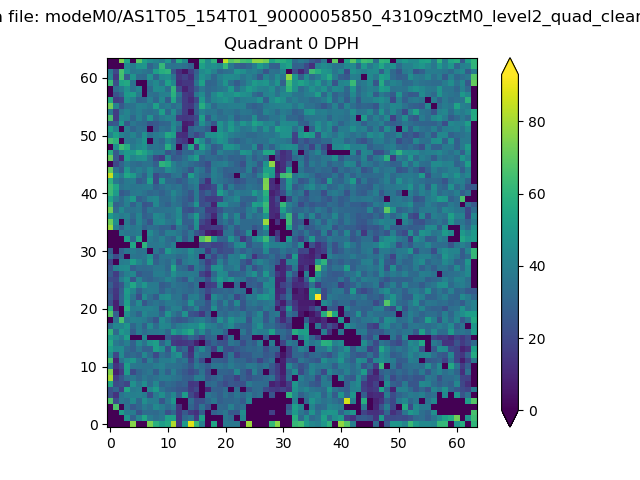 |
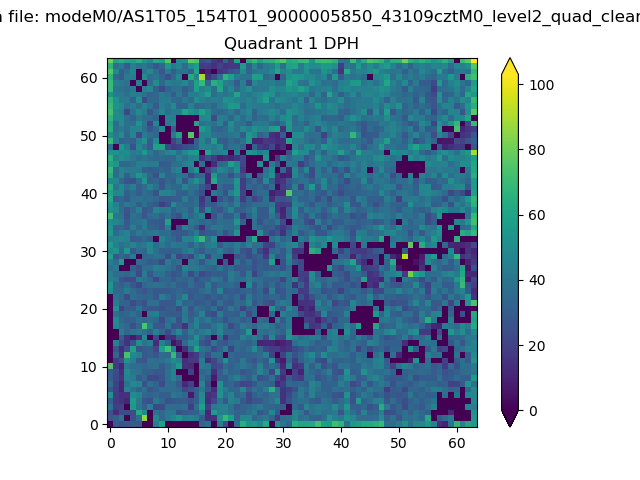 |
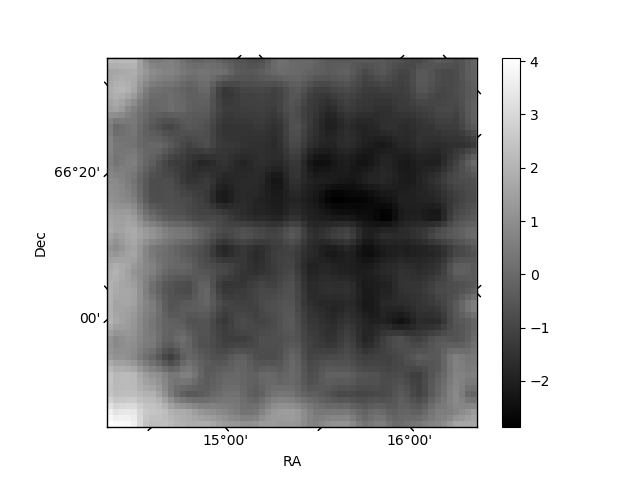
Quadrant B |
|---|---|---|---|
| Quadrant D | 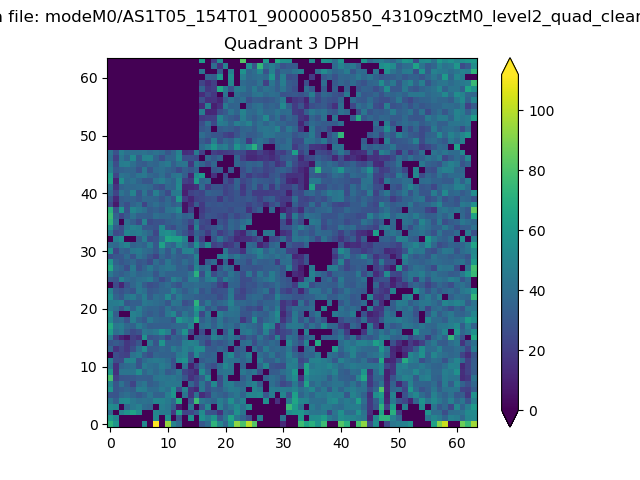 |
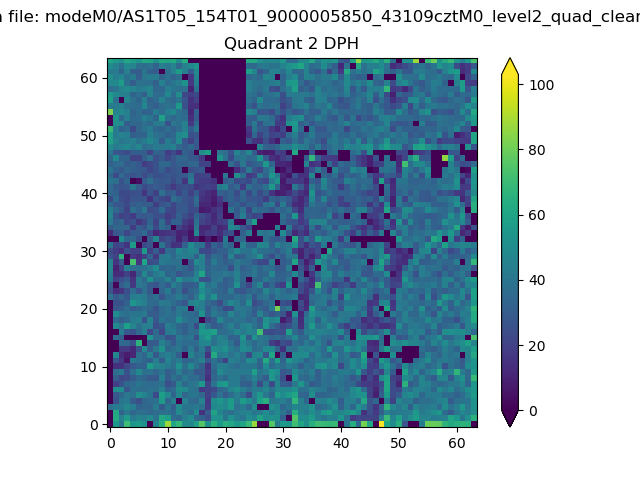 |
Quadrant C |
| Plot type | Count rate plots | Images |
|---|---|---|
| Comparison with Poisson distribution Blue bars denote a histogram of data divided into 1 sec bins. Red curve is a Poisson curve with rate = median count rate of data. |
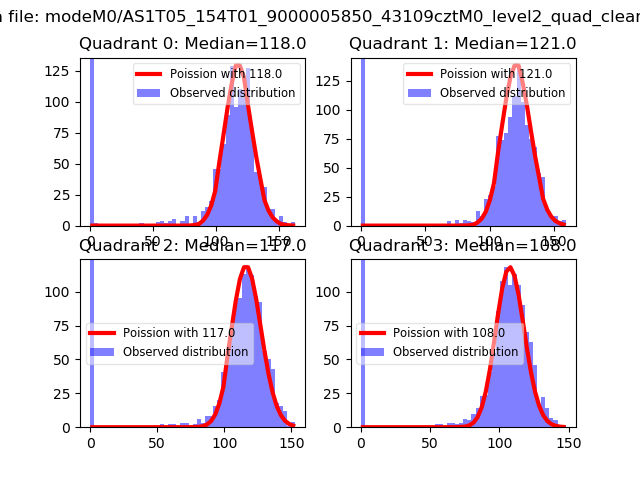 |
 |
| Quadrant-wise count rates Data is divided into 100 sec bins |
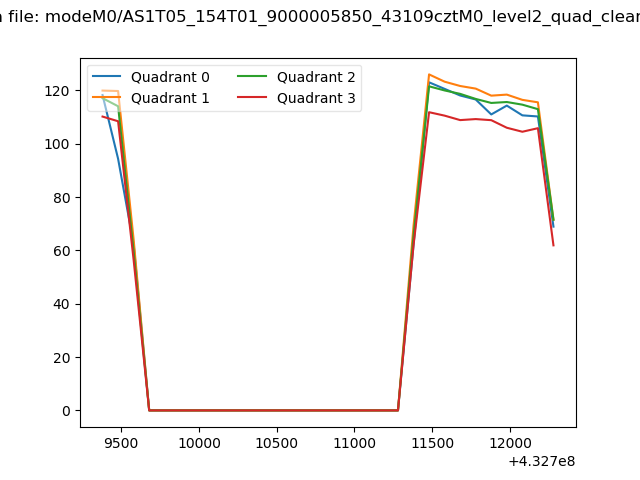 |
|
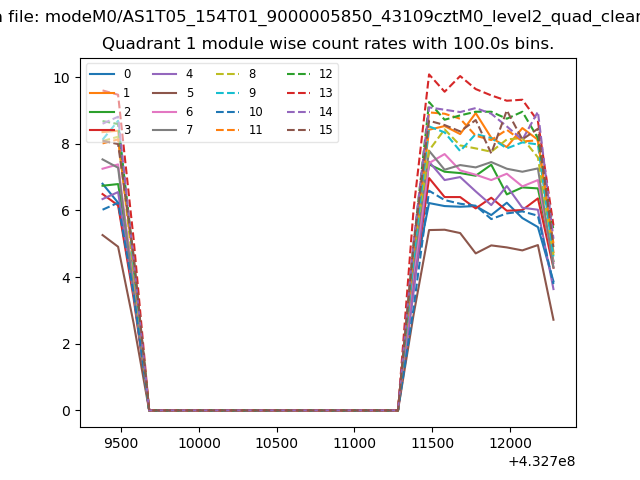
| Module-wise count rates for Quadrant A Data is divided into 100 sec bins |
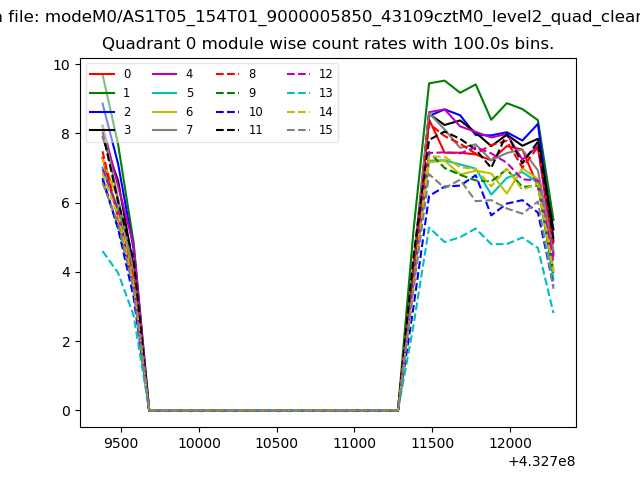 |
 |
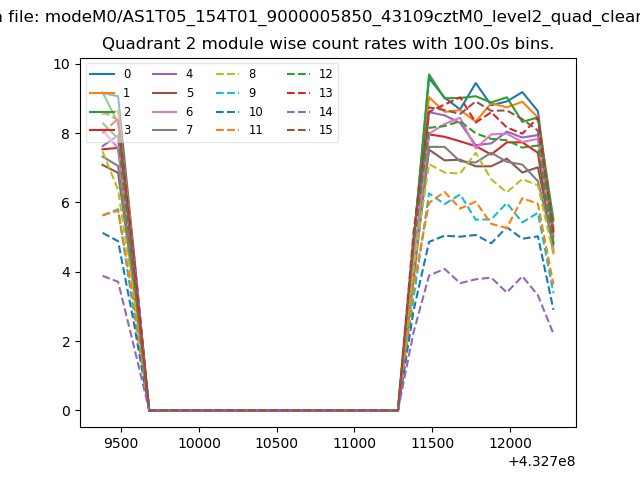
| Module-wise count rates for Quadrant B Data is divided into 100 sec bins |
 |
 |
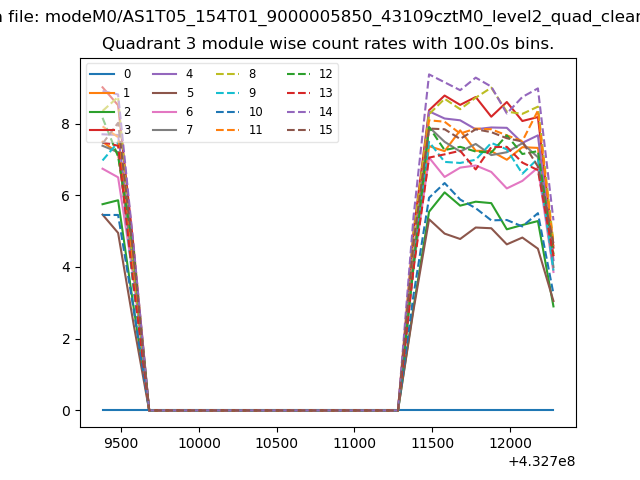
| Module-wise count rates for Quadrant C Data is divided into 100 sec bins |
 |
 |
| Module-wise count rates for Quadrant D Data is divided into 100 sec bins |
 |
 |
| Parameter | Plot |
|---|---|
| CZT HV Monitor | 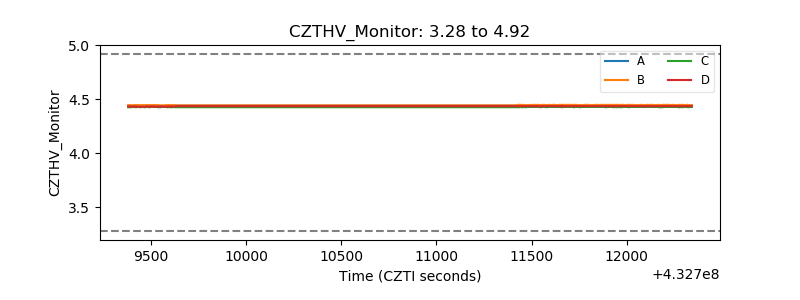 |
| D_VDD | 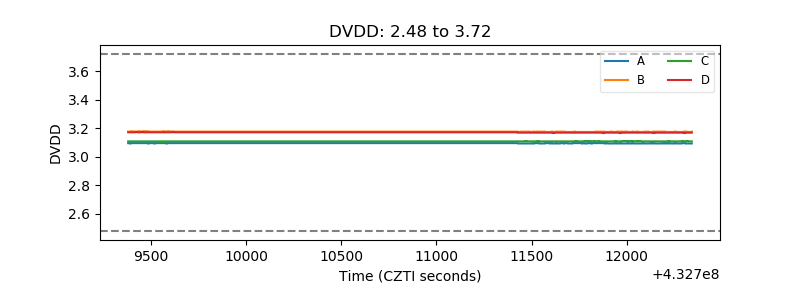 |
| Temperature 1 | 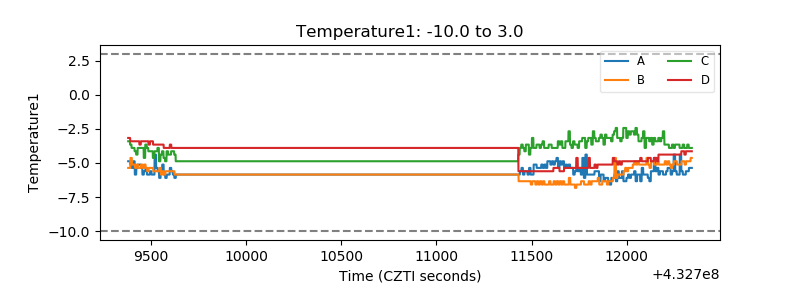 |
| Veto HV Monitor | 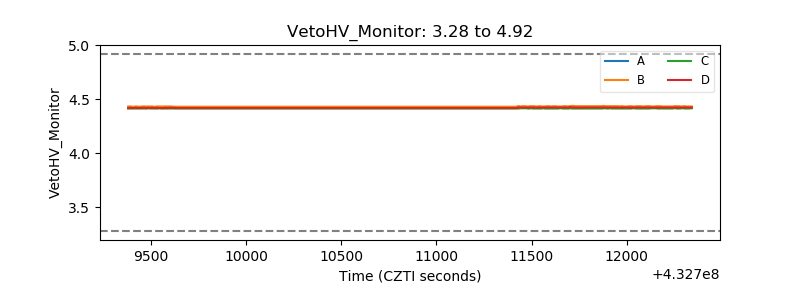 |
| Veto LLD | 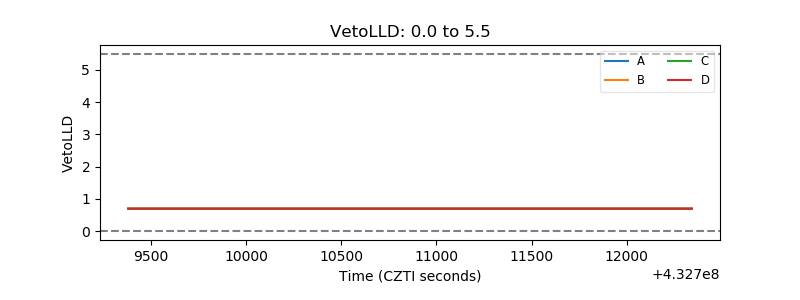 |
| Alpha Counter | 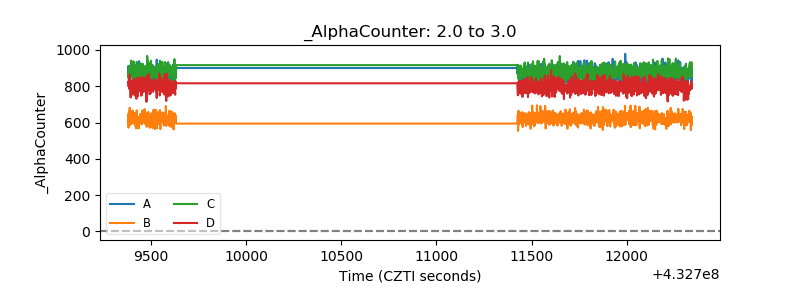 |
| _CPM_Rate | 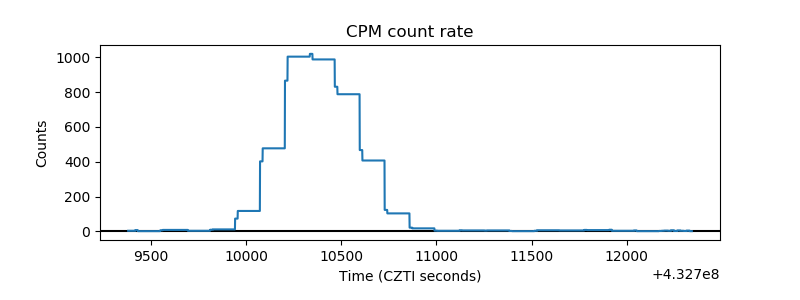 |
| CZT Counter | 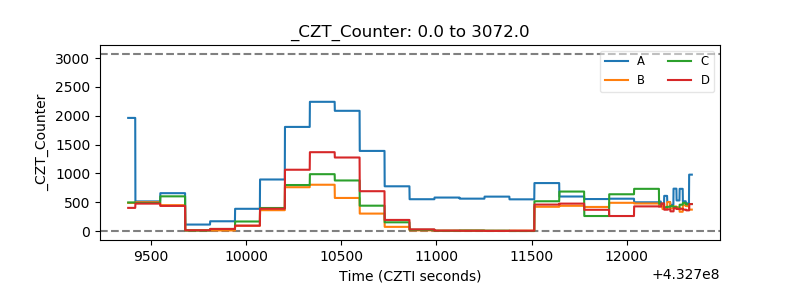 |
| +2.5 Volts monitor | 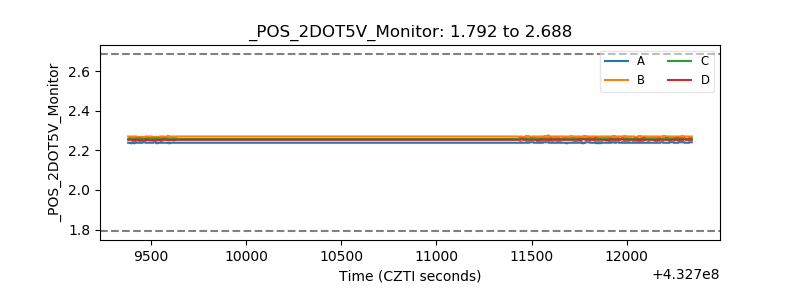 |
| +5 Volts monitor | 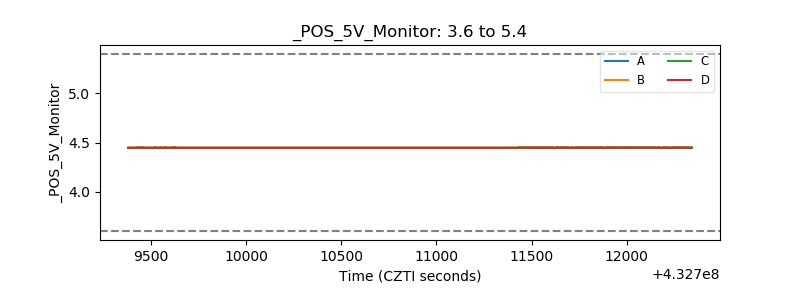 |
| _ROLL_ROT |  |
| _Roll_DEC | 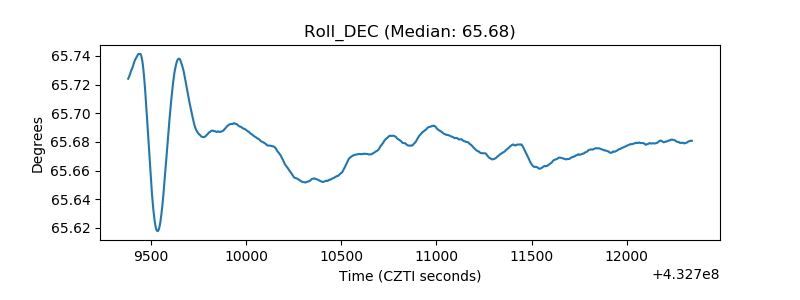 |
| _Roll_RA | 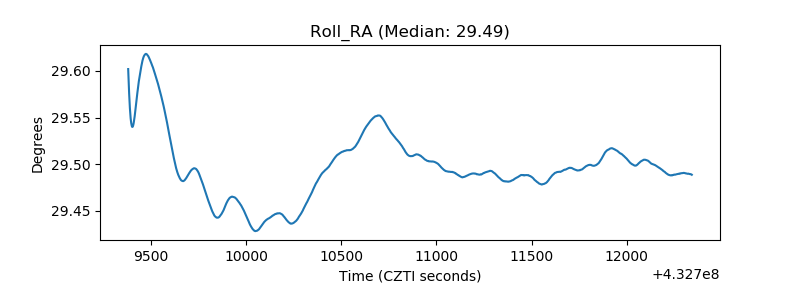 |
| Veto Counter |  |