| Param | Original file | Final file |
|---|---|---|
| Filename | modeM0/AS1T05_154T01_9000005850_43110cztM0_level2.fits | modeM0/AS1T05_154T01_9000005850_43110cztM0_level2_quad_clean.evt |
| Size (bytes) | 305,824,320 | 87,183,360 |
| Size | 291.7 MB | 83.1 MB |
| Events in quadrant A | 3,673,702 | 566,137 |
| Events in quadrant B | 2,266,406 | 607,395 |
| Events in quadrant C | 2,549,431 | 574,704 |
| Events in quadrant D | 2,432,094 | 532,917 |
| Mode M0 | |||
|---|---|---|---|
| Quadrant | BADHDUFLAG | Total packets | Discarded packets |
| A | 0 | 14085 | 72 |
| B | 0 | 10359 | 74 |
| C | 0 | 10866 | 88 |
| D | 0 | 10960 | 97 |
| Mode SS | |||
|---|---|---|---|
| Quadrant | BADHDUFLAG | Total packets | Discarded packets |
| A | 0 | 106 | 0 |
| B | 0 | 106 | 0 |
| C | 0 | 106 | 0 |
| D | 0 | 106 | 0 |
| Mode M9 | |||
|---|---|---|---|
| Quadrant | BADHDUFLAG | Total packets | Discarded packets |
| A | 0 | 21 | 0 |
| B | 0 | 22 | 0 |
| C | 0 | 22 | 0 |
| D | 0 | 22 | 0 |
| Quadrant | Total seconds | Saturated seconds | Saturation percentage |
|---|---|---|---|
| A | 5118 | 303 | 5.920281% |
| B | 5113 | 7 | 0.136906% |
| C | 5118 | 9 | 0.175850% |
| D | 5113 | 24 | 0.469392% |
Noise dominated data is calculated using 1-second bins in cleaned event files. If a bin has >2000 counts, and if more than 50% of those come from <1% of pixels, then it is considered to be noise-dominated and hence unusable.
| Quadrant | # 1 sec bins | Bins with >0 counts | Bins with >2000 counts | High rate bins dominated by noise | Noise dominated (total time) | Noise dominated (detector-on time) | Marked lightcurve |
|---|---|---|---|---|---|---|---|
| A | 7098 | 5131 | 218 | 218 | 3.07% | 4.25% | 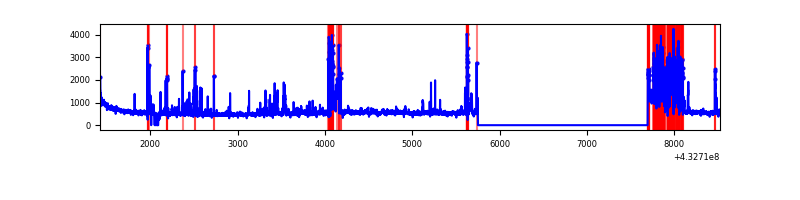 |
| B | 7098 | 5123 | 0 | 0 | 0.00% | 0.00% | 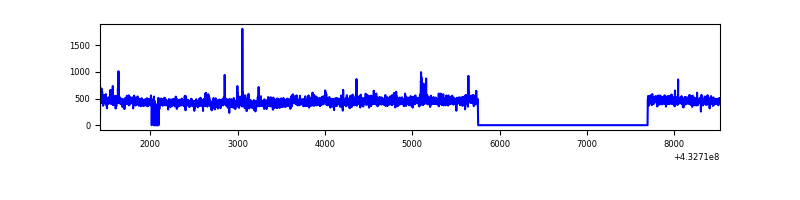 |
| C | 7098 | 5128 | 4 | 4 | 0.06% | 0.08% | 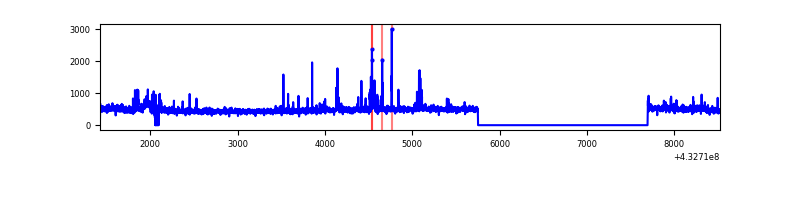 |
| D | 7098 | 5121 | 25 | 25 | 0.35% | 0.49% | 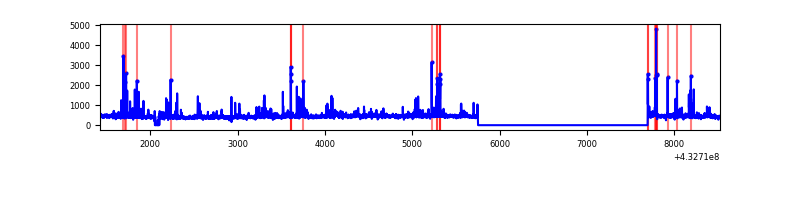 |
Top three noisy pixels from each quadrant. If the there are fewer than three noisy pixels in the level2.evt file, extra rows are filled as -1
| Pixel properties | Quadrant properties | ||||||
|---|---|---|---|---|---|---|---|
| Quadrant | DetID | PixID | Counts | Sigma | Mean | Median | Sigma |
| A | 15 | 222 | 820884 | 7214.62 | 559 | 547 | 113.7 |
| A | 10 | 83 | 538021 | 4726.92 | 559 | 547 | 113.7 |
| A | 15 | 237 | 146735 | 1285.68 | 559 | 547 | 113.7 |
| B | 3 | 112 | 19941 | 179.25 | 563 | 548 | 108.2 |
| B | 0 | 189 | 17665 | 158.21 | 563 | 548 | 108.2 |
| B | 0 | 229 | 17651 | 158.08 | 563 | 548 | 108.2 |
| C | 15 | 214 | 234470 | 1834.02 | 548 | 550 | 127.5 |
| C | 0 | 239 | 78860 | 613.98 | 548 | 550 | 127.5 |
| C | 14 | 254 | 64795 | 503.71 | 548 | 550 | 127.5 |
| D | 1 | 52 | 113260 | 846.54 | 551 | 535 | 133.2 |
| D | 2 | 249 | 112816 | 843.21 | 551 | 535 | 133.2 |
| D | 12 | 233 | 28940 | 213.32 | 551 | 535 | 133.2 |
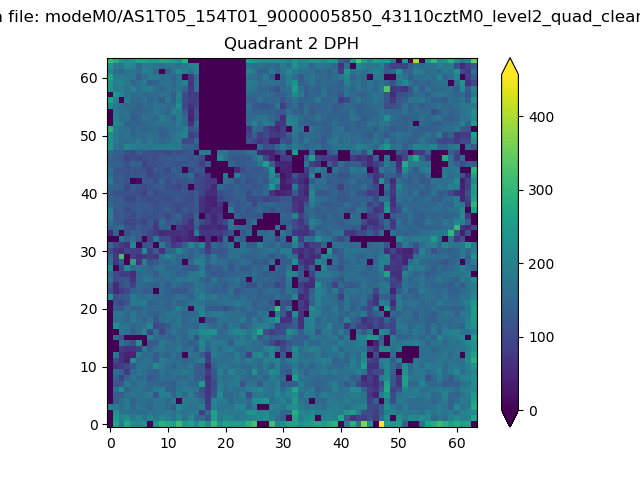
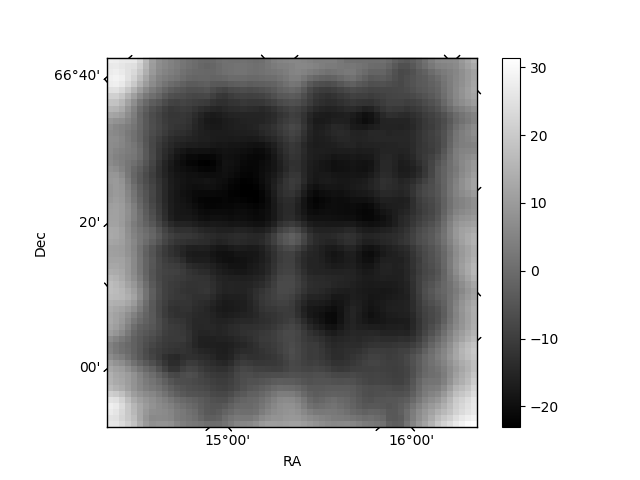
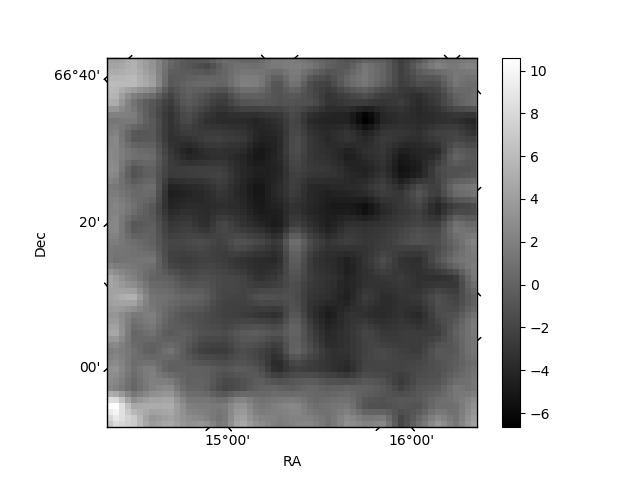
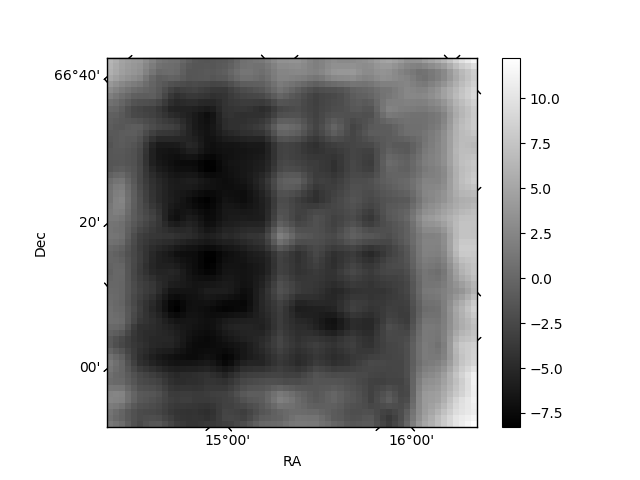
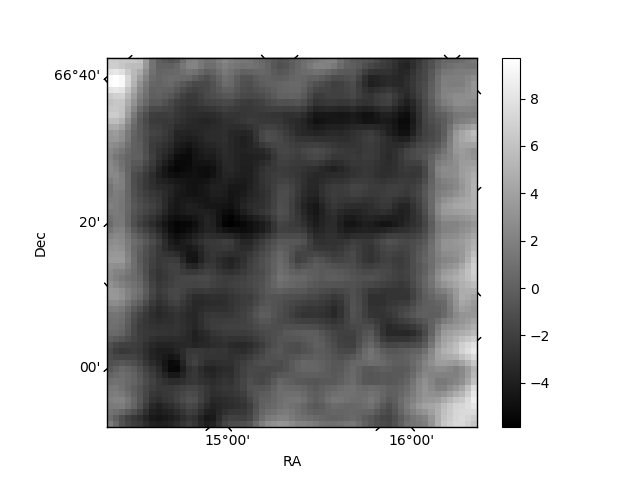
Histogram calculated using DETX and DETY for each event in the final _common_clean file
| Quadrant A | 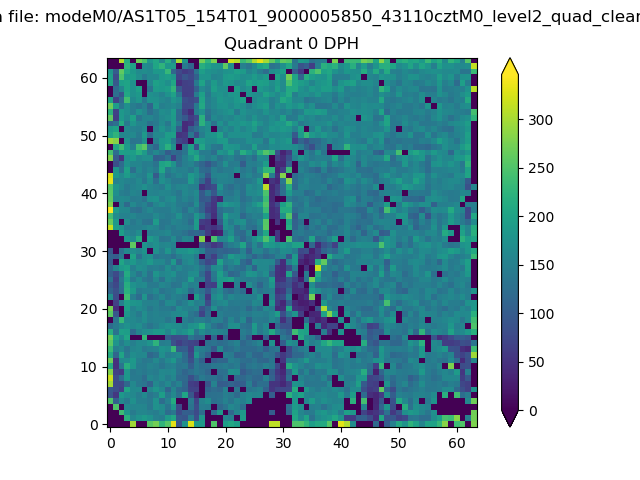 |
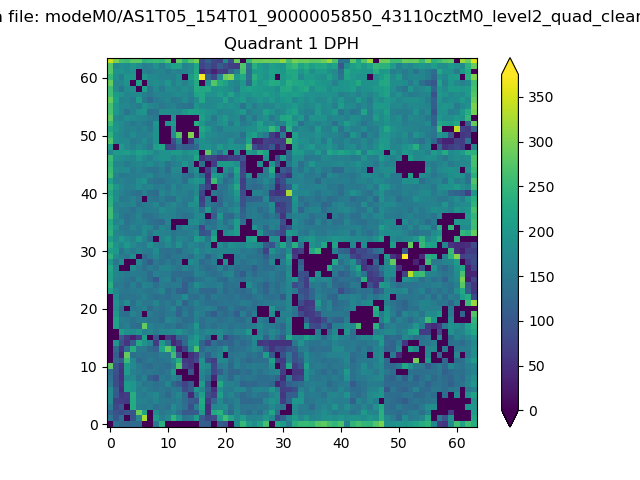 |
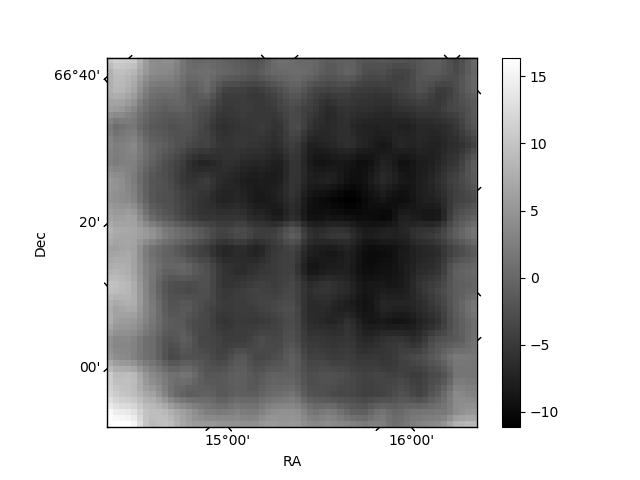
Quadrant B |
|---|---|---|---|
| Quadrant D | 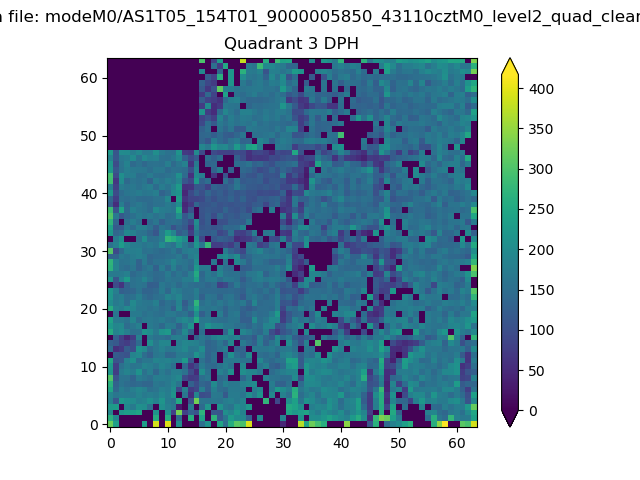 |
 |
Quadrant C |
| Plot type | Count rate plots | Images |
|---|---|---|
| Comparison with Poisson distribution Blue bars denote a histogram of data divided into 1 sec bins. Red curve is a Poisson curve with rate = median count rate of data. |
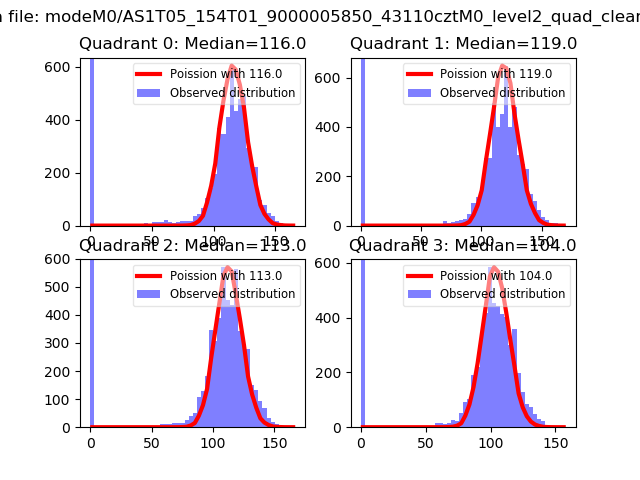 |
 |
| Quadrant-wise count rates Data is divided into 100 sec bins |
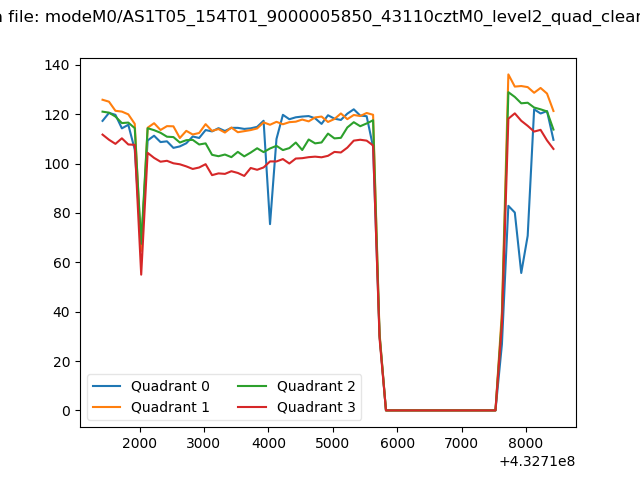 |
|
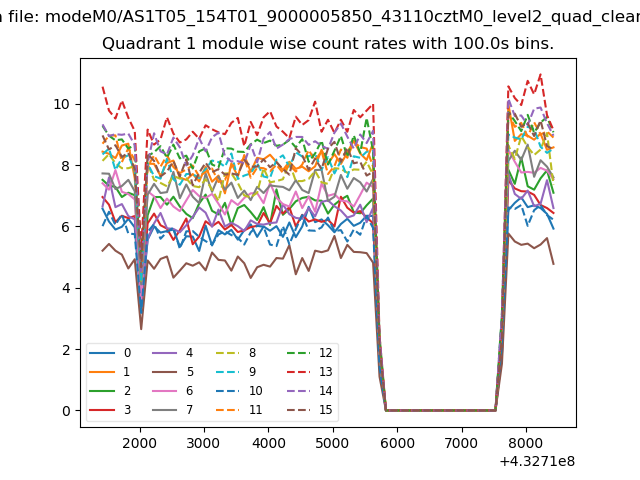
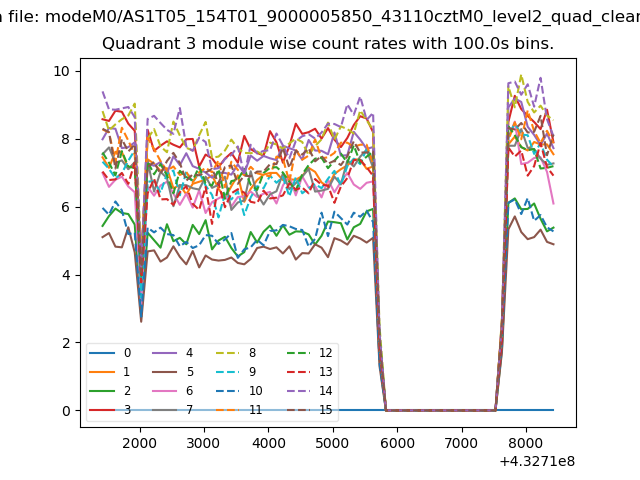
| Module-wise count rates for Quadrant A Data is divided into 100 sec bins |
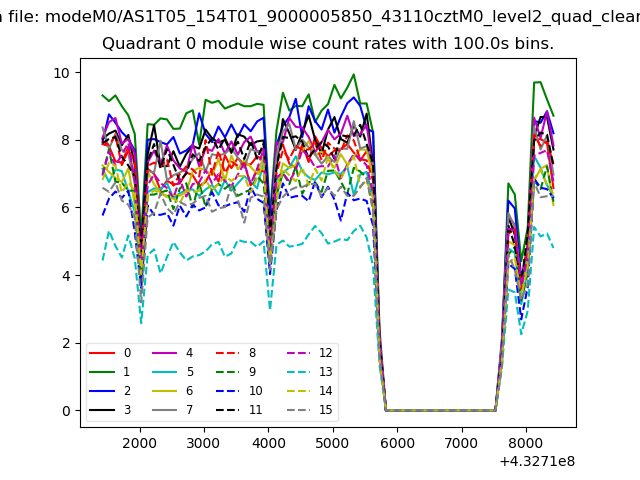 |
 |
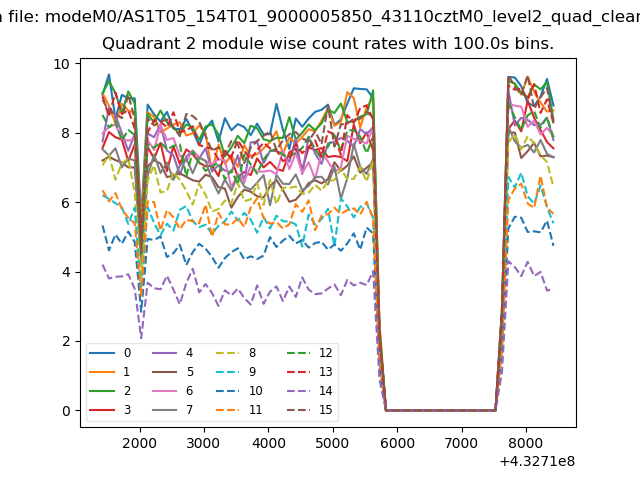
| Module-wise count rates for Quadrant B Data is divided into 100 sec bins |
 |
 |
| Module-wise count rates for Quadrant C Data is divided into 100 sec bins |
 |
 |
| Module-wise count rates for Quadrant D Data is divided into 100 sec bins |
 |
 |
| Parameter | Plot |
|---|---|
| CZT HV Monitor | 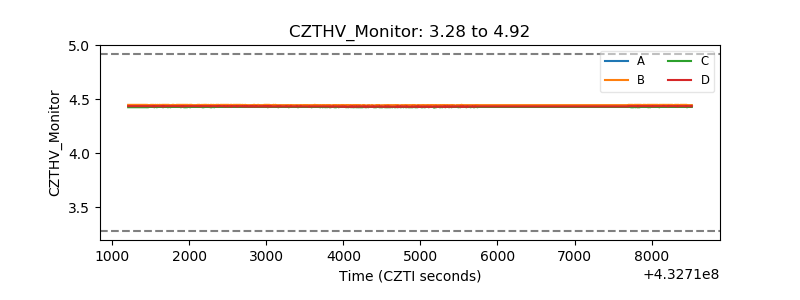 |
| D_VDD | 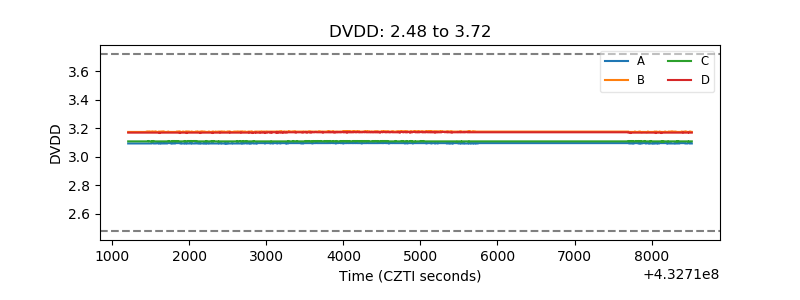 |
| Temperature 1 |  |
| Veto HV Monitor | 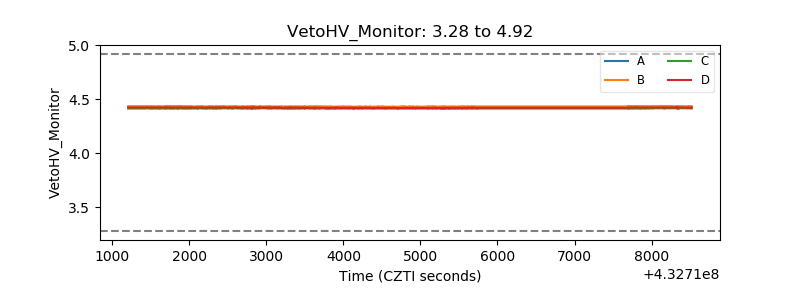 |
| Veto LLD | 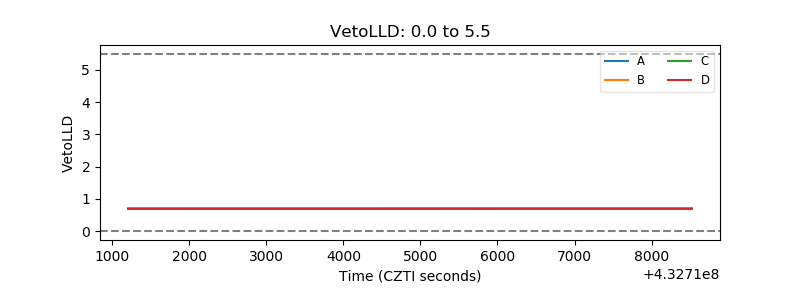 |
| Alpha Counter | 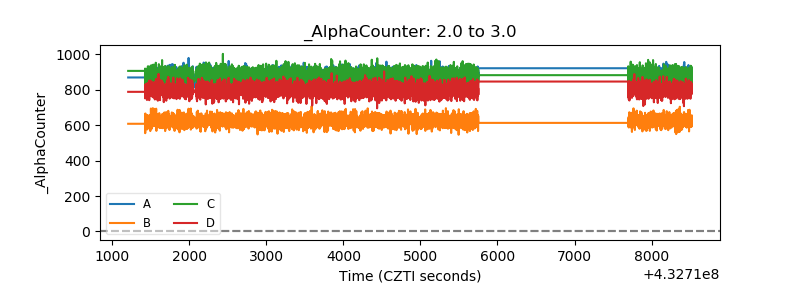 |
| _CPM_Rate | 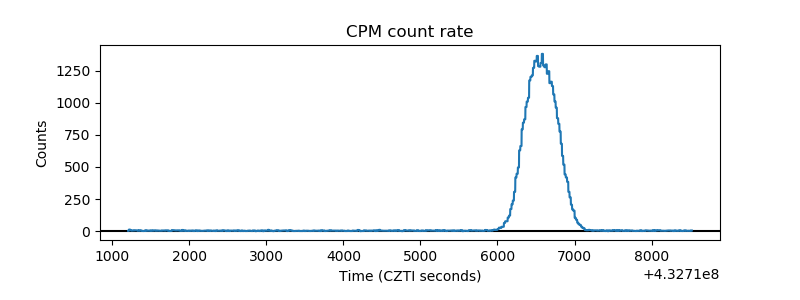 |
| CZT Counter | 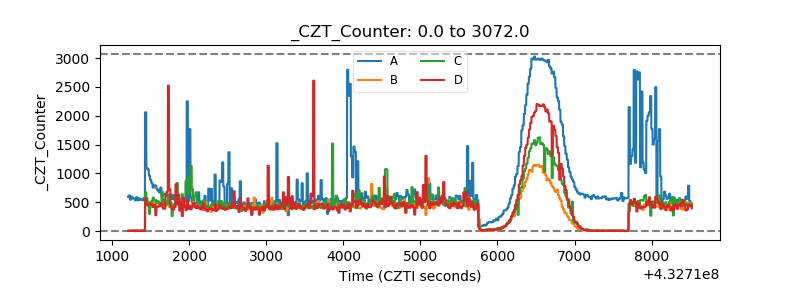 |
| +2.5 Volts monitor | 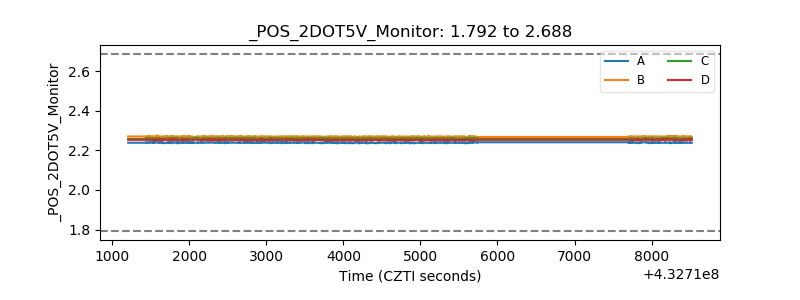 |
| +5 Volts monitor | 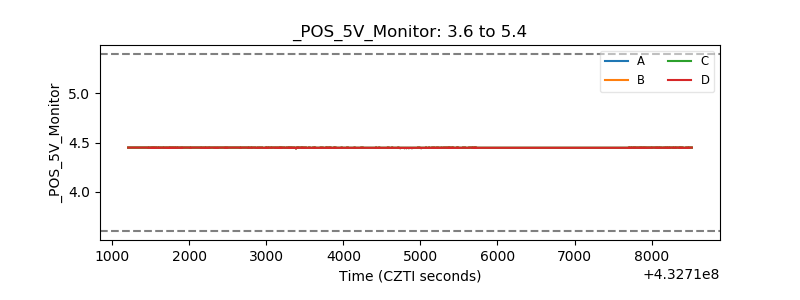 |
| _ROLL_ROT | 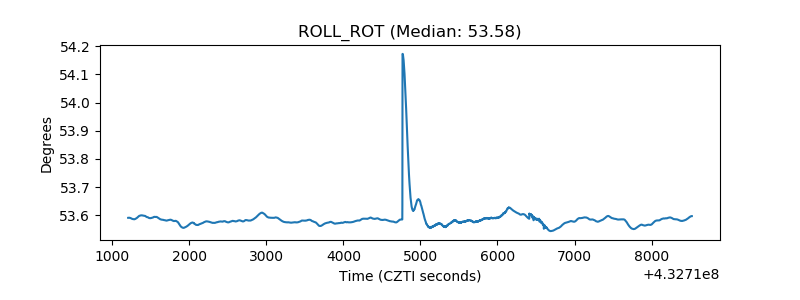 |
| _Roll_DEC | 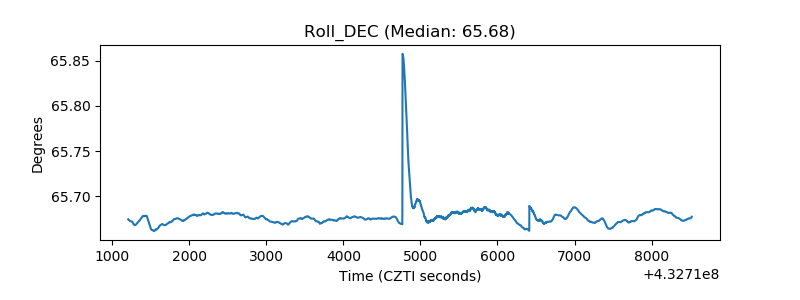 |
| _Roll_RA | 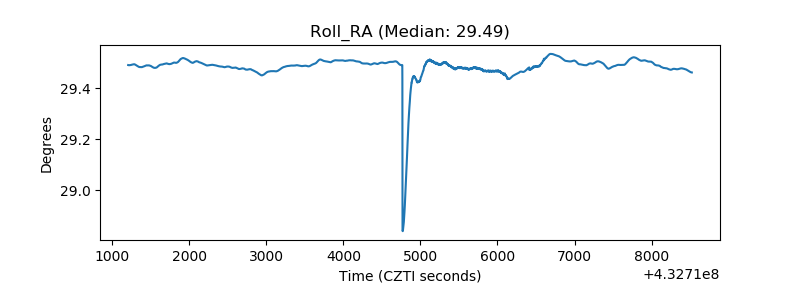 |
| Veto Counter | 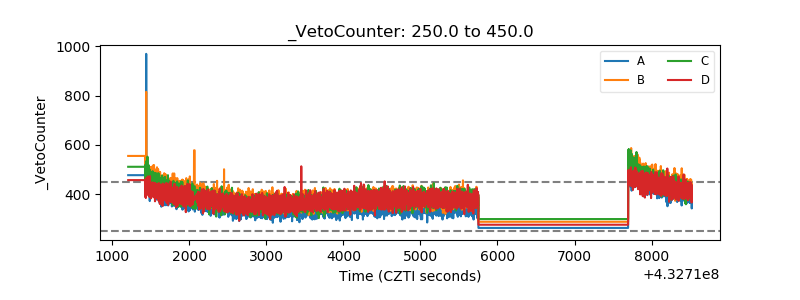 |