| Param | Original file | Final file |
|---|---|---|
| Filename | modeM0/AS1T05_154T01_9000005850_43111cztM0_level2.fits | modeM0/AS1T05_154T01_9000005850_43111cztM0_level2_quad_clean.evt |
| Size (bytes) | 364,919,040 | 86,304,960 |
| Size | 348.0 MB | 82.3 MB |
| Events in quadrant A | 5,680,119 | 500,486 |
| Events in quadrant B | 2,310,124 | 628,546 |
| Events in quadrant C | 2,448,362 | 587,232 |
| Events in quadrant D | 2,677,172 | 544,500 |
| Mode M0 | |||
|---|---|---|---|
| Quadrant | BADHDUFLAG | Total packets | Discarded packets |
| A | 0 | 20140 | 2 |
| B | 0 | 10219 | 2 |
| C | 0 | 10274 | 2 |
| D | 0 | 11417 | 2 |
| Mode SS | |||
|---|---|---|---|
| Quadrant | BADHDUFLAG | Total packets | Discarded packets |
| A | 0 | 102 | 0 |
| B | 0 | 102 | 0 |
| C | 0 | 102 | 0 |
| D | 0 | 102 | 0 |
| Mode M9 | |||
|---|---|---|---|
| Quadrant | BADHDUFLAG | Total packets | Discarded packets |
| A | 0 | 26 | 0 |
| B | 0 | 27 | 0 |
| C | 0 | 27 | 0 |
| D | 0 | 27 | 0 |
| Quadrant | Total seconds | Saturated seconds | Saturation percentage |
|---|---|---|---|
| A | 5033 | 1130 | 22.451818% |
| B | 5033 | 15 | 0.298033% |
| C | 5033 | 7 | 0.139082% |
| D | 5033 | 54 | 1.072919% |
Noise dominated data is calculated using 1-second bins in cleaned event files. If a bin has >2000 counts, and if more than 50% of those come from <1% of pixels, then it is considered to be noise-dominated and hence unusable.
| Quadrant | # 1 sec bins | Bins with >0 counts | Bins with >2000 counts | High rate bins dominated by noise | Noise dominated (total time) | Noise dominated (detector-on time) | Marked lightcurve |
|---|---|---|---|---|---|---|---|
| A | 7065 | 5034 | 931 | 931 | 13.18% | 18.49% | 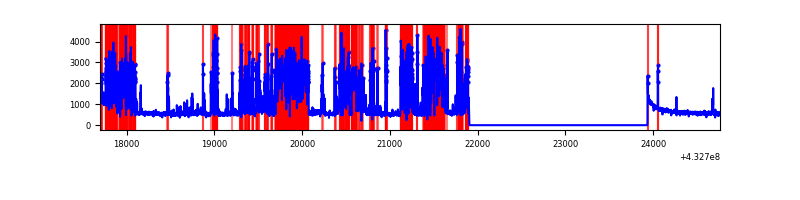 |
| B | 7065 | 5034 | 5 | 5 | 0.07% | 0.10% | 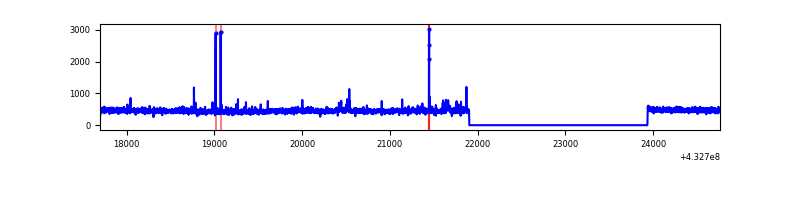 |
| C | 7065 | 5034 | 2 | 2 | 0.03% | 0.04% | 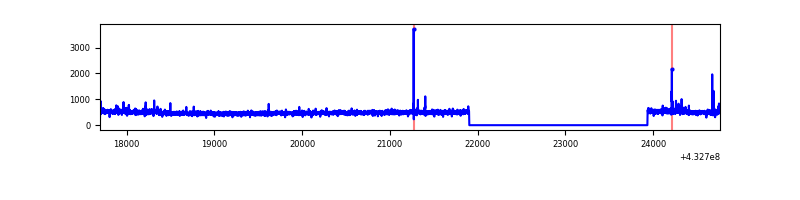 |
| D | 7065 | 5034 | 51 | 51 | 0.72% | 1.01% | 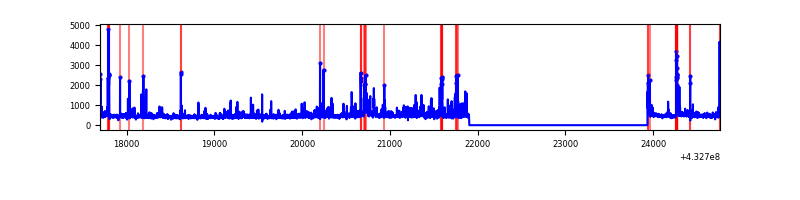 |
Top three noisy pixels from each quadrant. If the there are fewer than three noisy pixels in the level2.evt file, extra rows are filled as -1
| Pixel properties | Quadrant properties | ||||||
|---|---|---|---|---|---|---|---|
| Quadrant | DetID | PixID | Counts | Sigma | Mean | Median | Sigma |
| A | 15 | 222 | 2976682 | 27989.36 | 522 | 512 | 106.3 |
| A | 10 | 83 | 513541 | 4824.78 | 522 | 512 | 106.3 |
| A | 15 | 237 | 162603 | 1524.38 | 522 | 512 | 106.3 |
| B | 0 | 229 | 34231 | 308.52 | 570 | 556 | 109.1 |
| B | 3 | 112 | 31553 | 283.99 | 570 | 556 | 109.1 |
| B | 12 | 111 | 13400 | 117.67 | 570 | 556 | 109.1 |
| C | 15 | 214 | 231030 | 1809.6 | 553 | 556 | 127.4 |
| C | 14 | 254 | 33735 | 260.51 | 553 | 556 | 127.4 |
| C | 0 | 207 | 7461 | 54.21 | 553 | 556 | 127.4 |
| D | 1 | 52 | 324455 | 2404.55 | 557 | 541 | 134.7 |
| D | 2 | 249 | 63273 | 465.69 | 557 | 541 | 134.7 |
| D | 12 | 6 | 57015 | 419.23 | 557 | 541 | 134.7 |
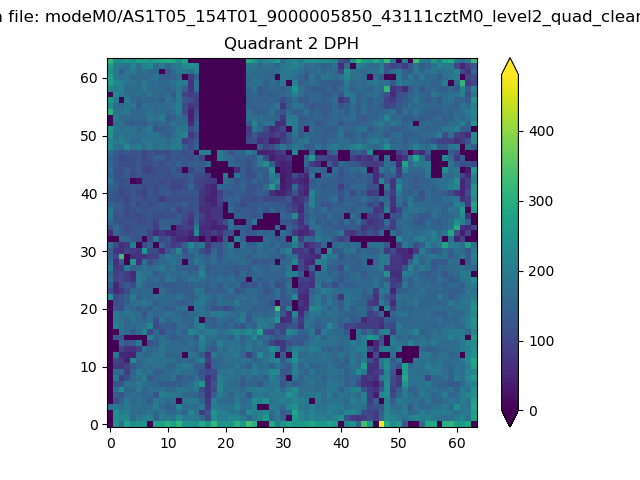
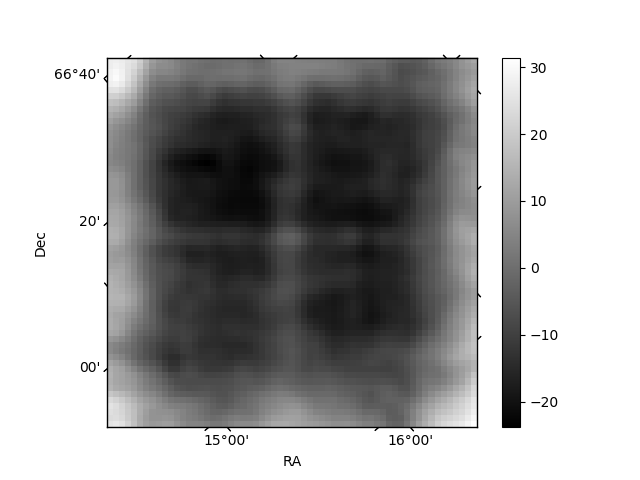
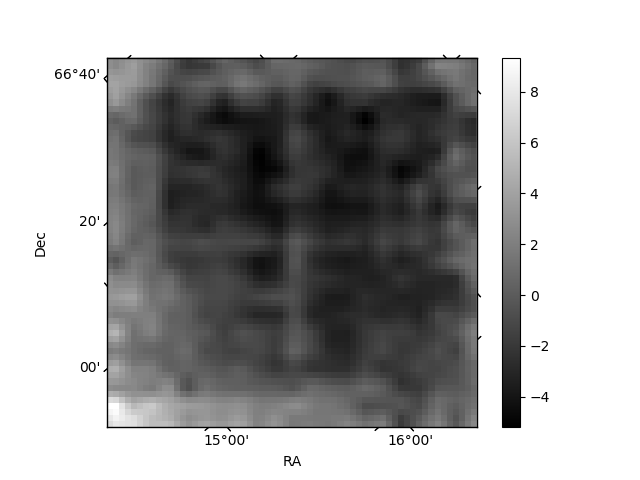
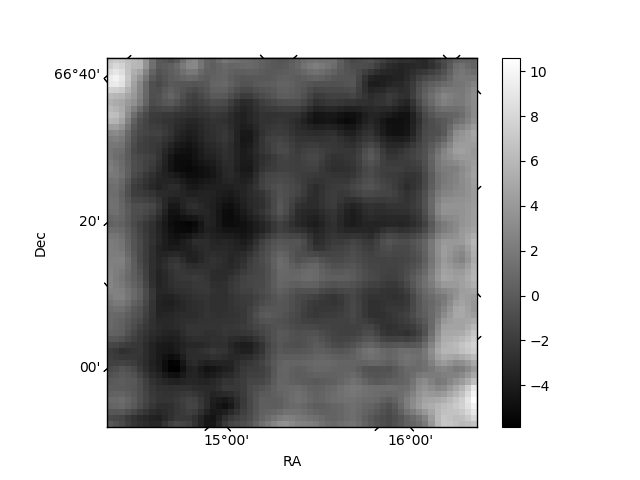
Histogram calculated using DETX and DETY for each event in the final _common_clean file
| Quadrant A | 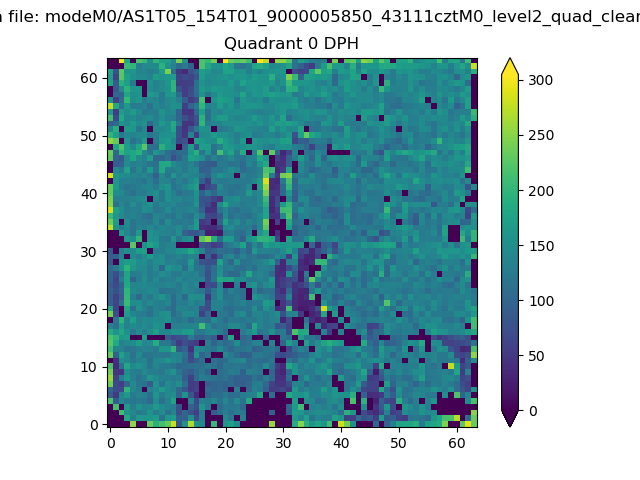 |
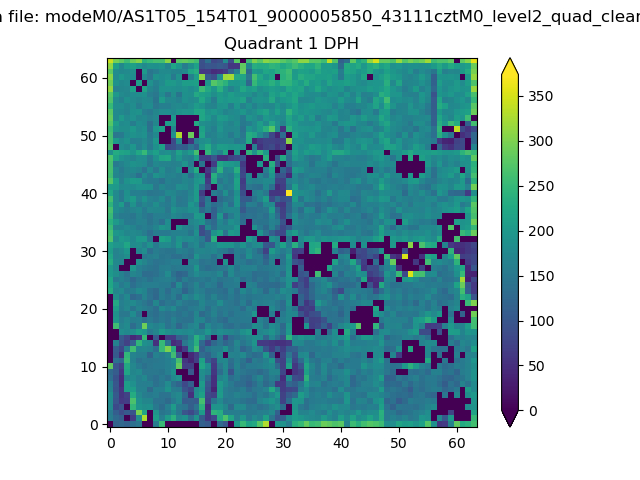 |
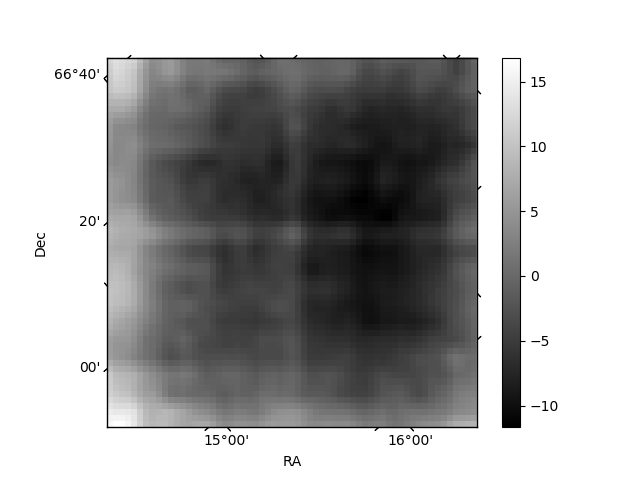
Quadrant B |
|---|---|---|---|
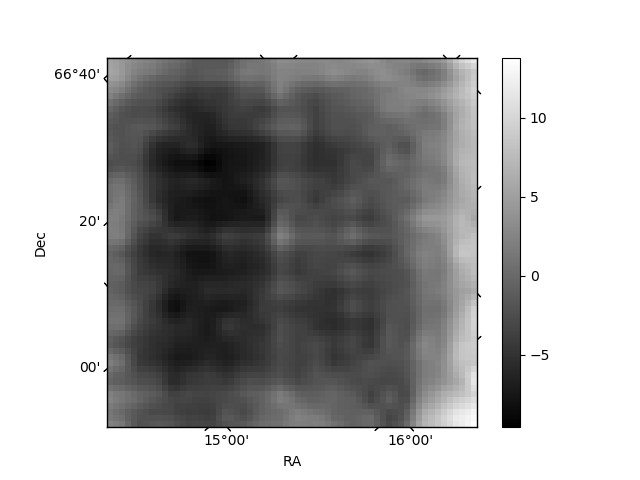
| Quadrant D | 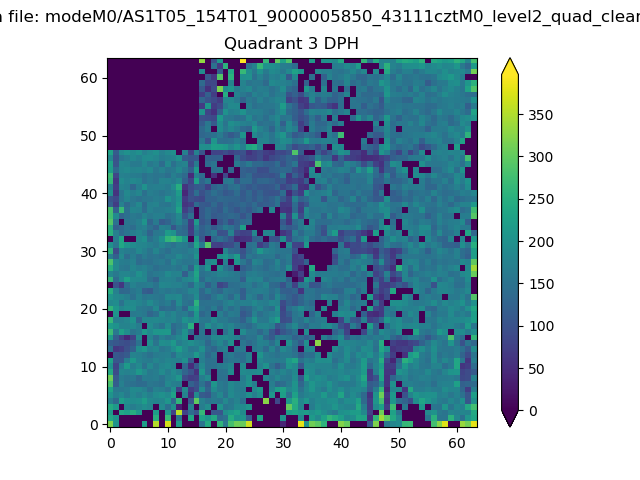 |
 |
Quadrant C |
| Plot type | Count rate plots | Images |
|---|---|---|
| Comparison with Poisson distribution Blue bars denote a histogram of data divided into 1 sec bins. Red curve is a Poisson curve with rate = median count rate of data. |
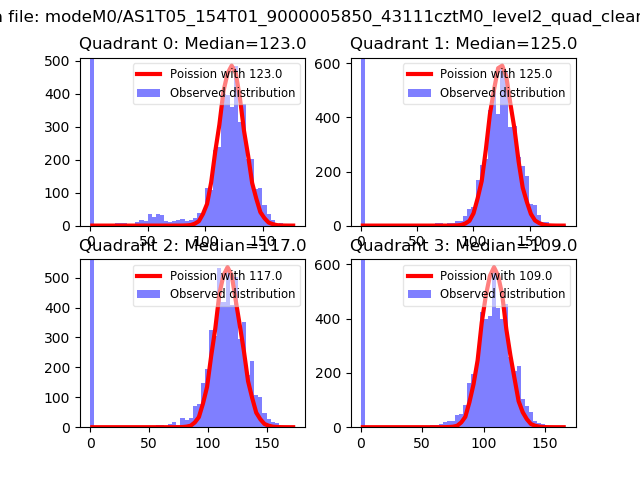 |
 |
| Quadrant-wise count rates Data is divided into 100 sec bins |
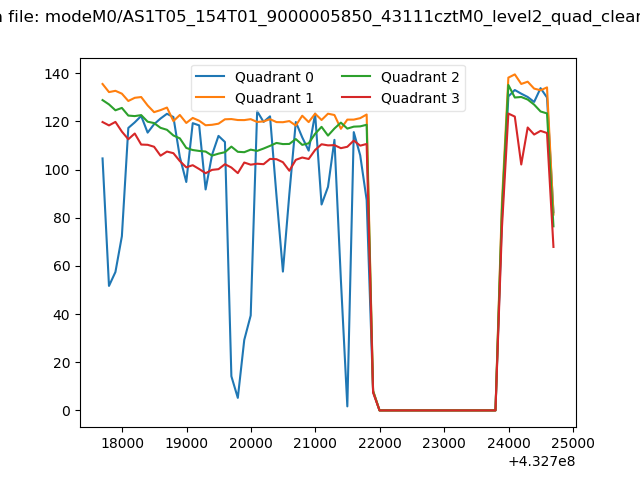 |
|
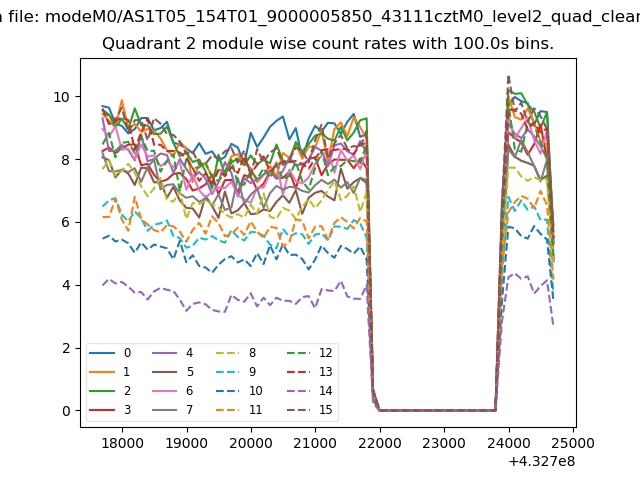
| Module-wise count rates for Quadrant A Data is divided into 100 sec bins |
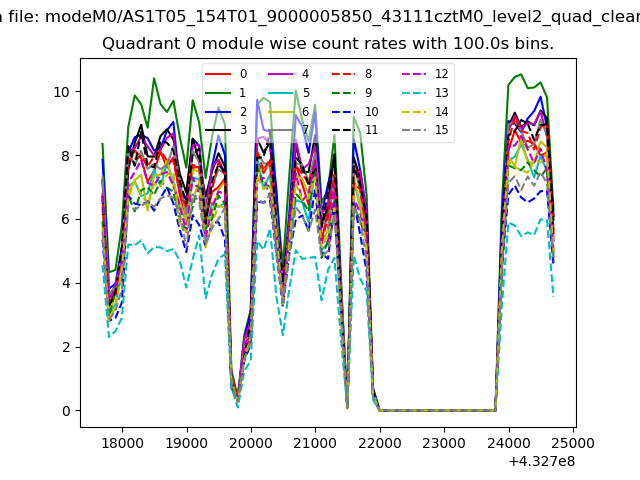 |
 |
| Module-wise count rates for Quadrant B Data is divided into 100 sec bins |
 |
 |
| Module-wise count rates for Quadrant C Data is divided into 100 sec bins |
 |
 |
| Module-wise count rates for Quadrant D Data is divided into 100 sec bins |
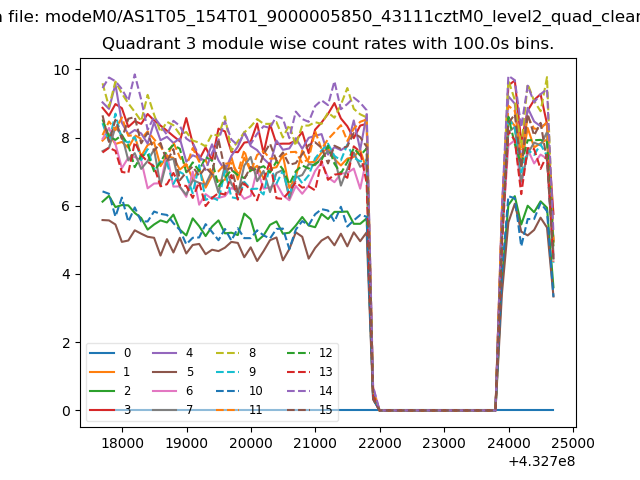 |
 |
| Parameter | Plot |
|---|---|
| CZT HV Monitor | 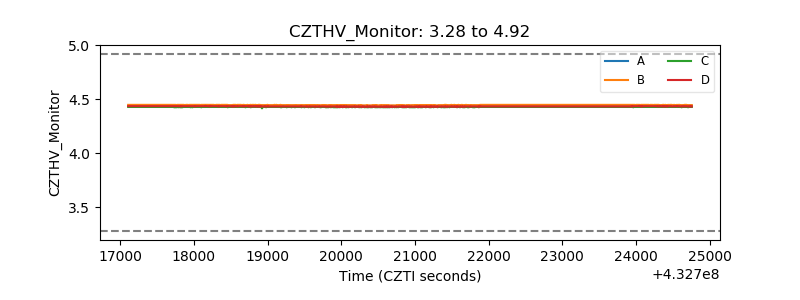 |
| D_VDD | 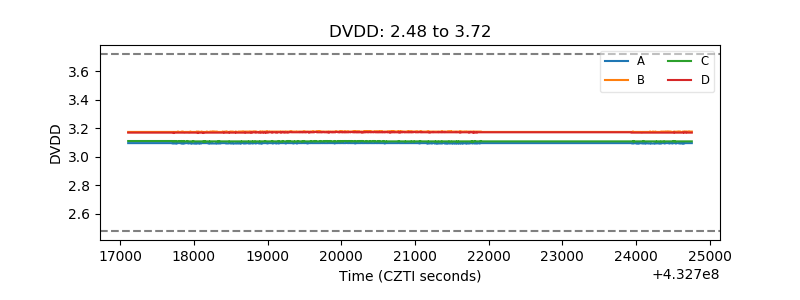 |
| Temperature 1 | 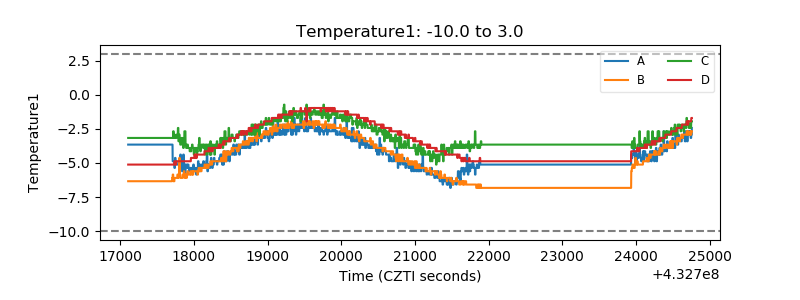 |
| Veto HV Monitor | 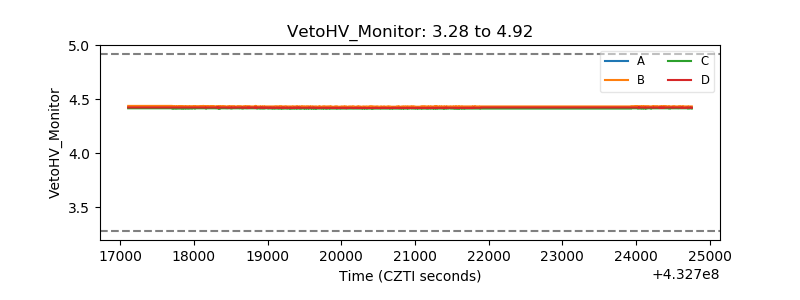 |
| Veto LLD | 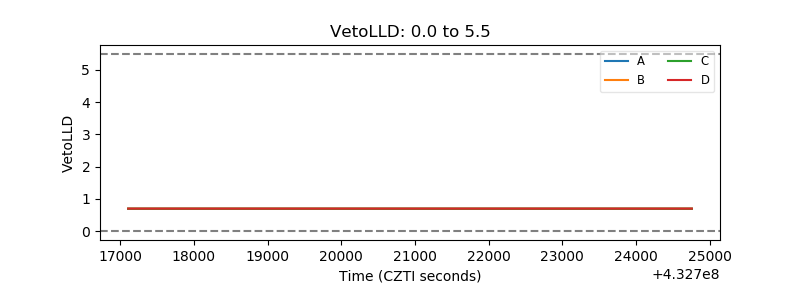 |
| Alpha Counter | 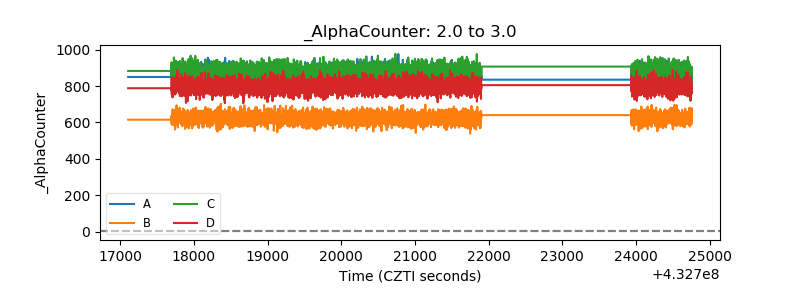 |
| _CPM_Rate | 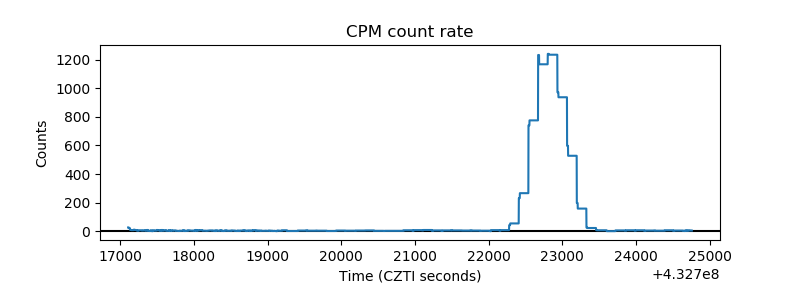 |
| CZT Counter | 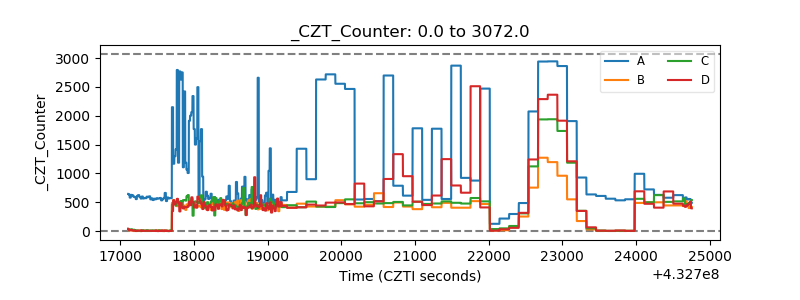 |
| +2.5 Volts monitor | 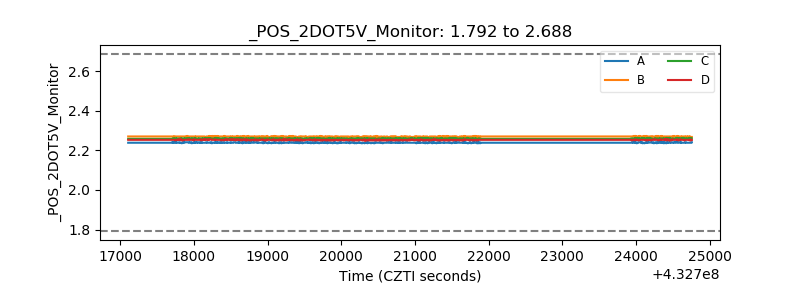 |
| +5 Volts monitor | 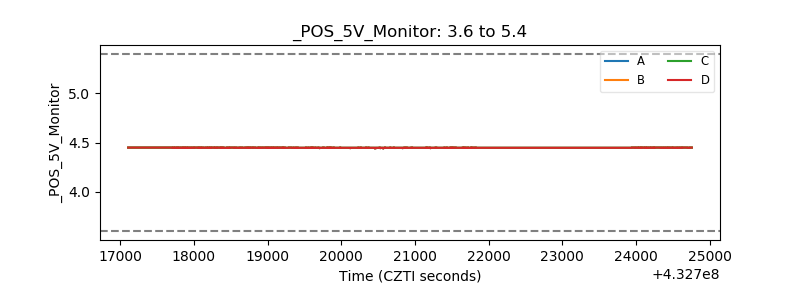 |
| _ROLL_ROT | 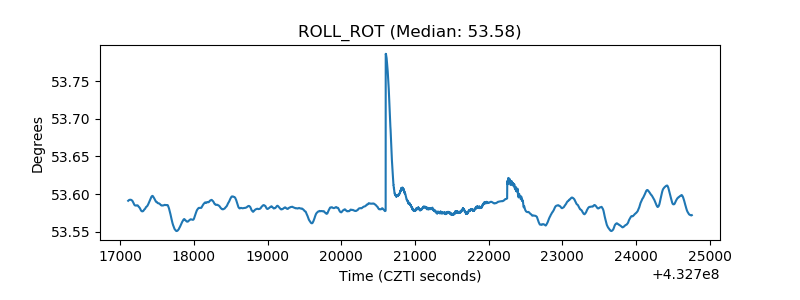 |
| _Roll_DEC | 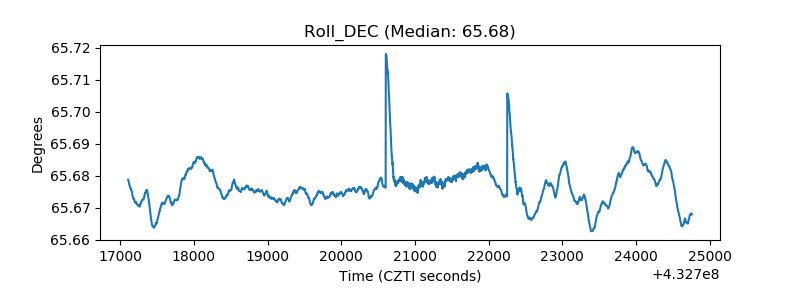 |
| _Roll_RA | 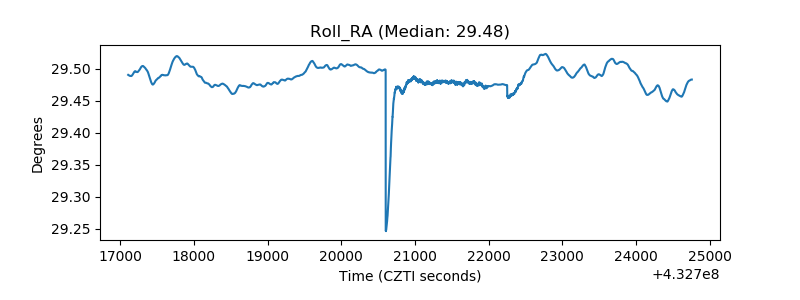 |
| Veto Counter | 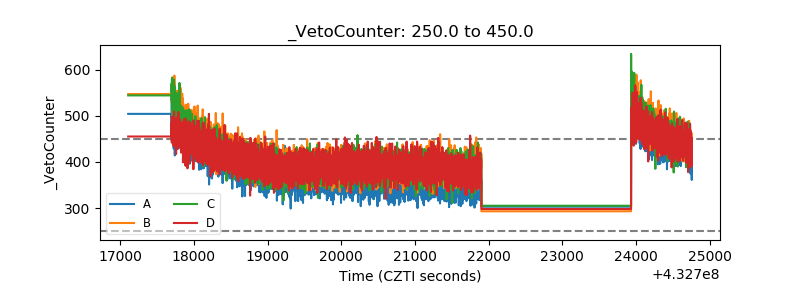 |