| Param | Original file | Final file |
|---|---|---|
| Filename | modeM0/AS1T05_154T01_9000005850_43113cztM0_level2.fits | modeM0/AS1T05_154T01_9000005850_43113cztM0_level2_quad_clean.evt |
| Size (bytes) | 591,321,600 | 166,320,000 |
| Size | 563.9 MB | 158.6 MB |
| Events in quadrant A | 6,146,574 | 1,142,440 |
| Events in quadrant B | 4,384,543 | 1,162,568 |
| Events in quadrant C | 4,610,650 | 1,087,289 |
| Events in quadrant D | 6,014,613 | 989,313 |
| Mode M0 | |||
|---|---|---|---|
| Quadrant | BADHDUFLAG | Total packets | Discarded packets |
| A | 0 | 23868 | 3 |
| B | 0 | 19301 | 3 |
| C | 0 | 19397 | 3 |
| D | 0 | 24129 | 3 |
| Mode SS | |||
|---|---|---|---|
| Quadrant | BADHDUFLAG | Total packets | Discarded packets |
| A | 0 | 194 | 0 |
| B | 0 | 194 | 0 |
| C | 0 | 194 | 0 |
| D | 0 | 194 | 0 |
| Mode M9 | |||
|---|---|---|---|
| Quadrant | BADHDUFLAG | Total packets | Discarded packets |
| A | 0 | 51 | 0 |
| B | 0 | 52 | 0 |
| C | 0 | 52 | 0 |
| D | 0 | 52 | 0 |
| Quadrant | Total seconds | Saturated seconds | Saturation percentage |
|---|---|---|---|
| A | 9437 | 268 | 2.839886% |
| B | 9437 | 29 | 0.307301% |
| C | 9437 | 15 | 0.158949% |
| D | 9437 | 342 | 3.624033% |
Noise dominated data is calculated using 1-second bins in cleaned event files. If a bin has >2000 counts, and if more than 50% of those come from <1% of pixels, then it is considered to be noise-dominated and hence unusable.
| Quadrant | # 1 sec bins | Bins with >0 counts | Bins with >2000 counts | High rate bins dominated by noise | Noise dominated (total time) | Noise dominated (detector-on time) | Marked lightcurve |
|---|---|---|---|---|---|---|---|
| A | 13684 | 9439 | 182 | 182 | 1.33% | 1.93% | 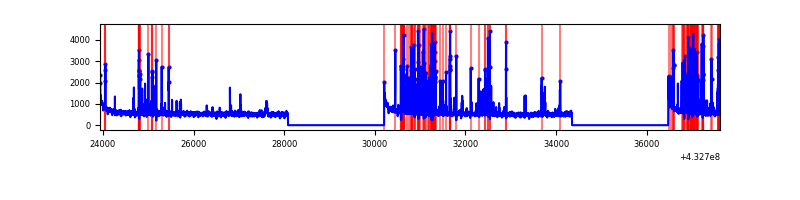 |
| B | 13684 | 9439 | 11 | 11 | 0.08% | 0.12% | 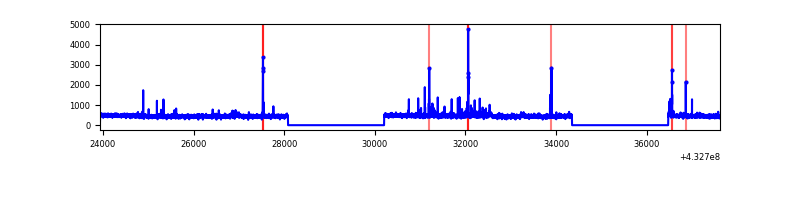 |
| C | 13684 | 9439 | 8 | 8 | 0.06% | 0.08% | 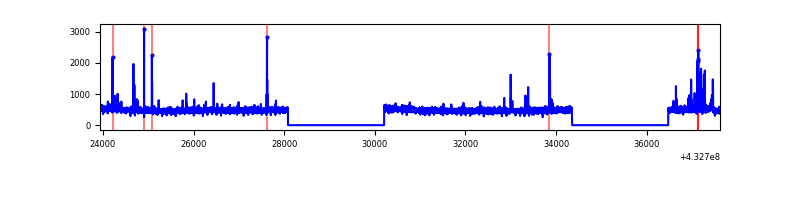 |
| D | 13684 | 9439 | 309 | 309 | 2.26% | 3.27% | 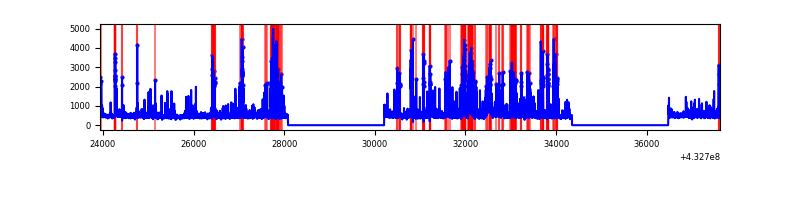 |
Top three noisy pixels from each quadrant. If the there are fewer than three noisy pixels in the level2.evt file, extra rows are filled as -1
| Pixel properties | Quadrant properties | ||||||
|---|---|---|---|---|---|---|---|
| Quadrant | DetID | PixID | Counts | Sigma | Mean | Median | Sigma |
| A | 10 | 83 | 1006632 | 4674.1 | 1068 | 1048 | 215.1 |
| A | 15 | 237 | 921037 | 4276.24 | 1068 | 1048 | 215.1 |
| A | 15 | 222 | 41093 | 186.13 | 1068 | 1048 | 215.1 |
| B | 0 | 229 | 95114 | 473.88 | 1053 | 1022 | 198.6 |
| B | 3 | 112 | 73377 | 364.41 | 1053 | 1022 | 198.6 |
| B | 0 | 189 | 40312 | 197.88 | 1053 | 1022 | 198.6 |
| C | 15 | 214 | 423292 | 1796.94 | 1032 | 1039 | 235.0 |
| C | 14 | 254 | 120864 | 509.93 | 1032 | 1039 | 235.0 |
| C | 15 | 159 | 15941 | 63.42 | 1032 | 1039 | 235.0 |
| D | 1 | 52 | 1224184 | 4966.93 | 1028 | 1001 | 246.3 |
| D | 12 | 218 | 252383 | 1020.78 | 1028 | 1001 | 246.3 |
| D | 12 | 33 | 148201 | 597.73 | 1028 | 1001 | 246.3 |
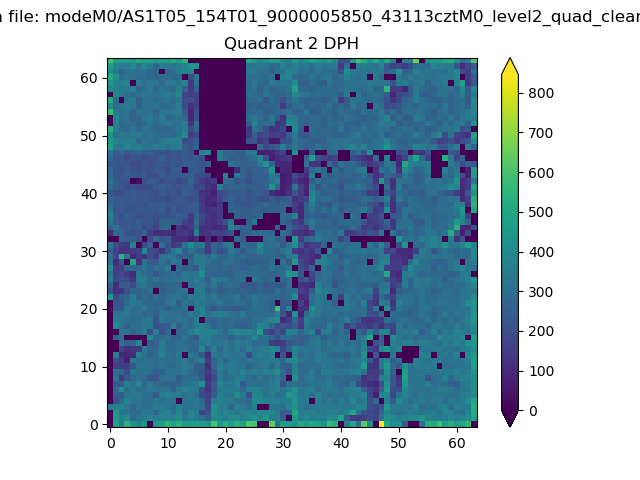
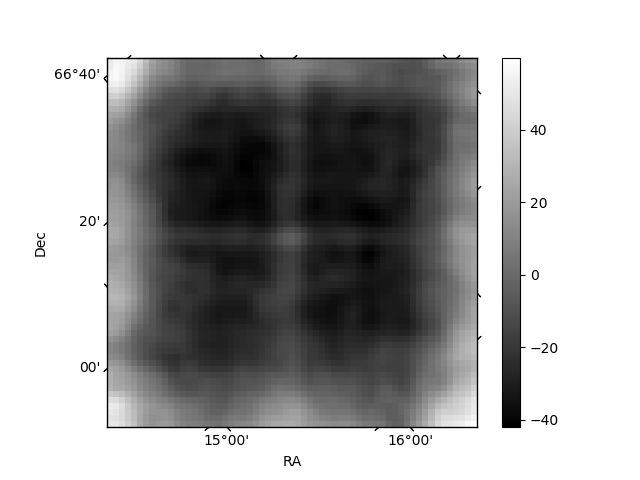
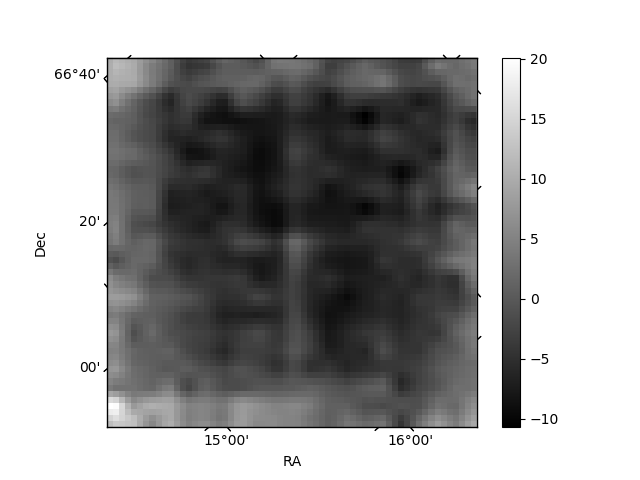
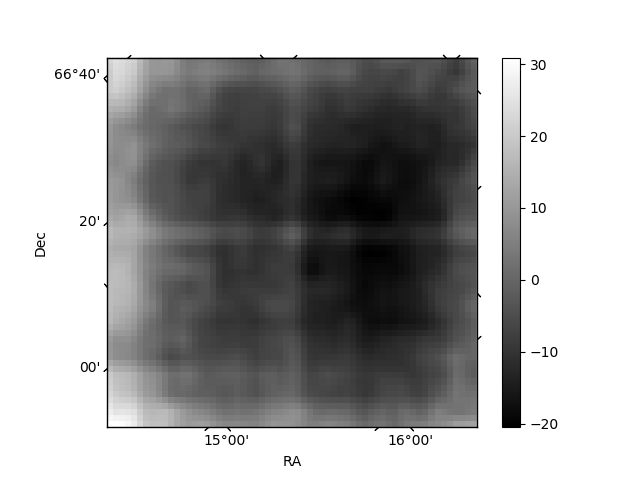
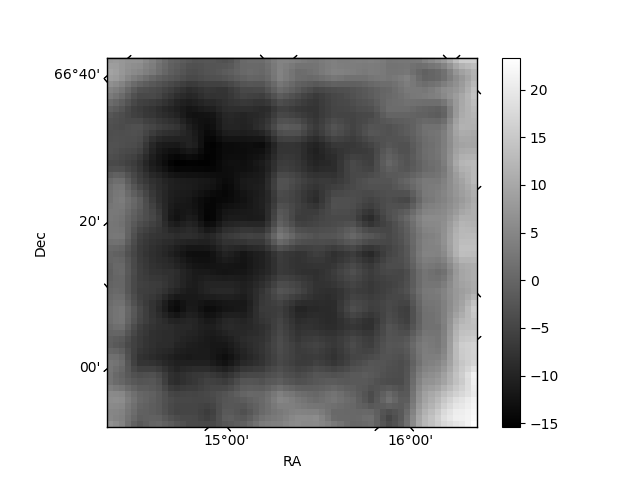
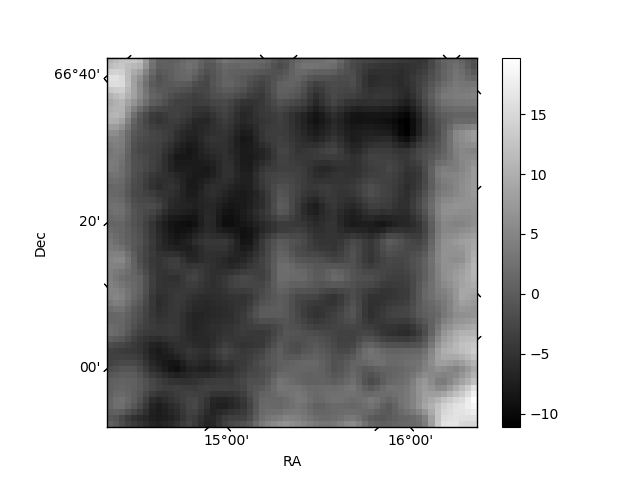
Histogram calculated using DETX and DETY for each event in the final _common_clean file
| Quadrant A | 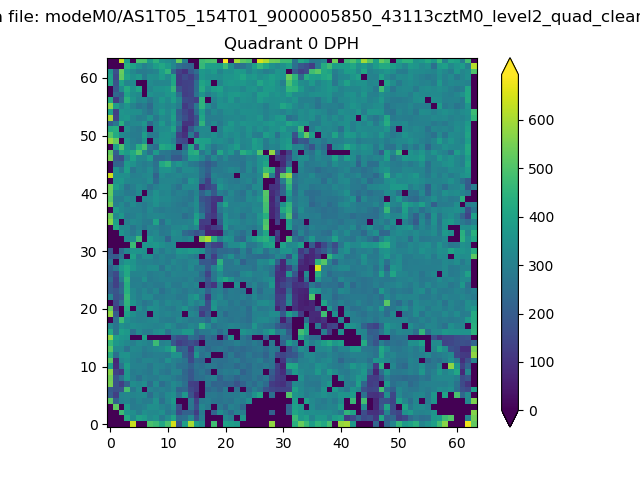 |
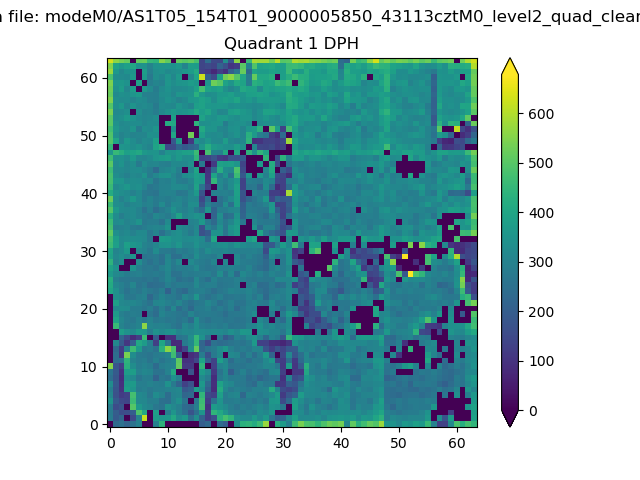 |
Quadrant B |
|---|---|---|---|
| Quadrant D | 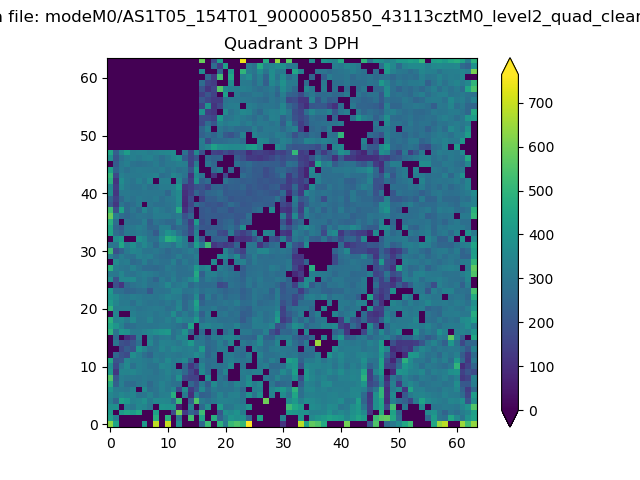 |
 |
Quadrant C |
| Plot type | Count rate plots | Images |
|---|---|---|
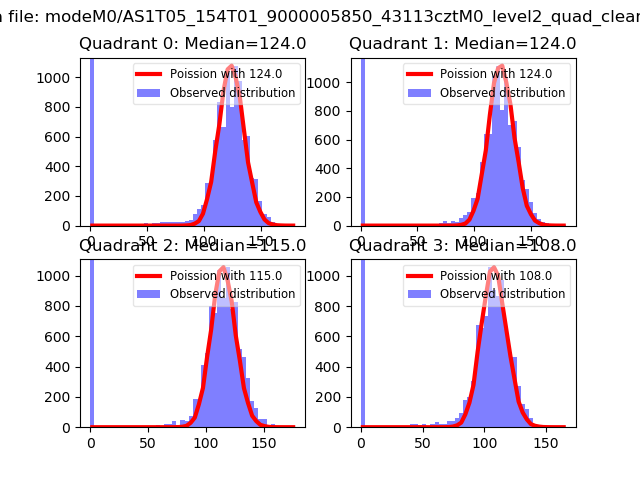
| Comparison with Poisson distribution Blue bars denote a histogram of data divided into 1 sec bins. Red curve is a Poisson curve with rate = median count rate of data. |
 |
 |
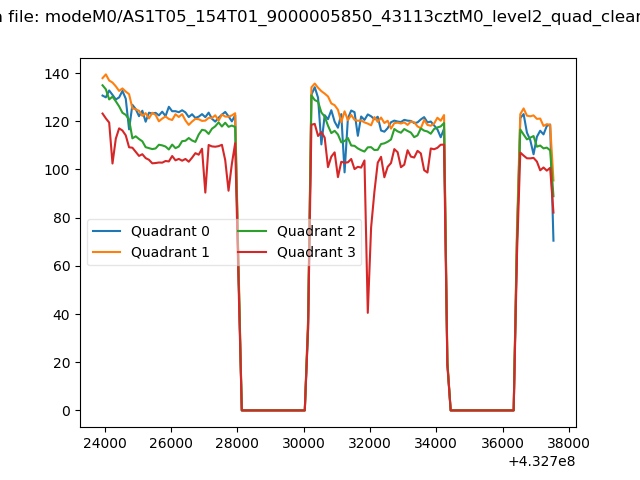
| Quadrant-wise count rates Data is divided into 100 sec bins |
 |
|
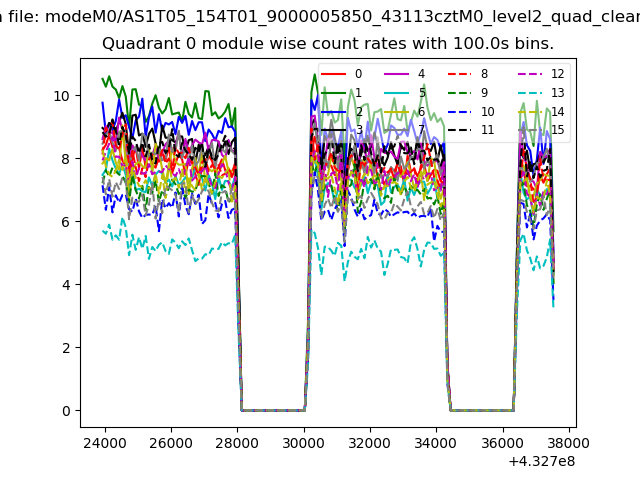
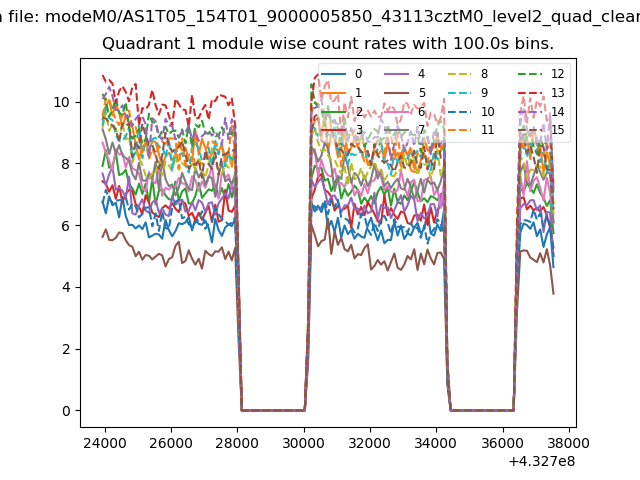
| Module-wise count rates for Quadrant A Data is divided into 100 sec bins |
 |
 |
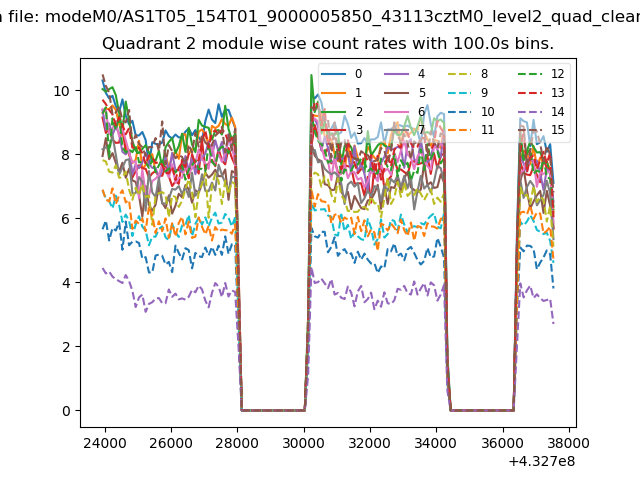
| Module-wise count rates for Quadrant B Data is divided into 100 sec bins |
 |
 |
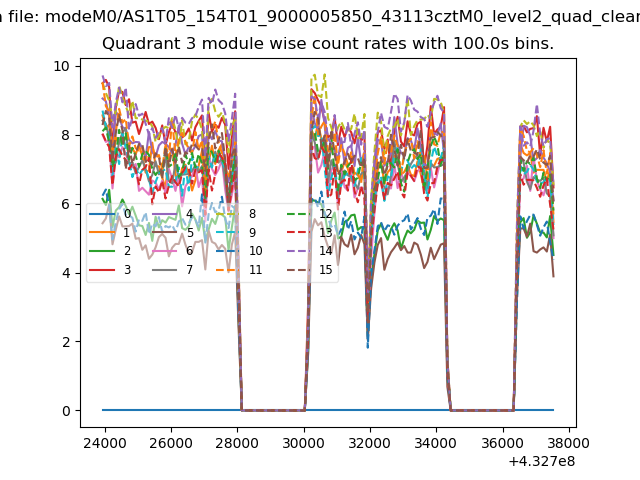
| Module-wise count rates for Quadrant C Data is divided into 100 sec bins |
 |
 |
| Module-wise count rates for Quadrant D Data is divided into 100 sec bins |
 |
 |
| Parameter | Plot |
|---|---|
| CZT HV Monitor |  |
| D_VDD | 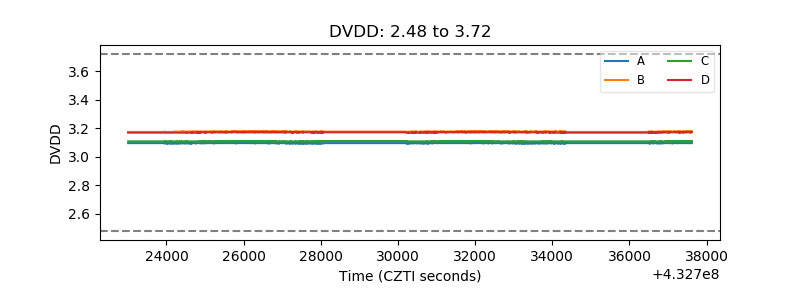 |
| Temperature 1 | 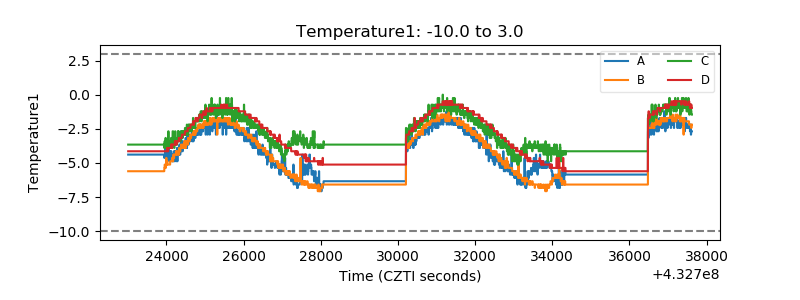 |
| Veto HV Monitor | 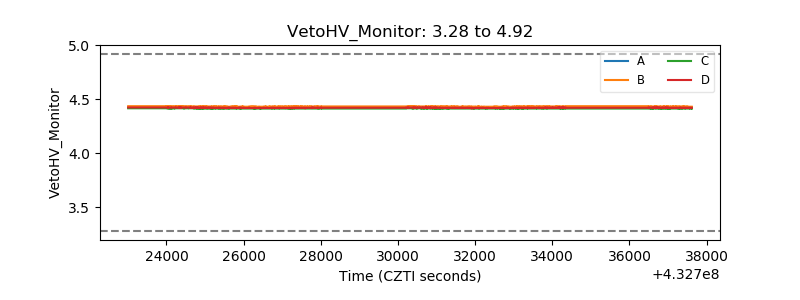 |
| Veto LLD | 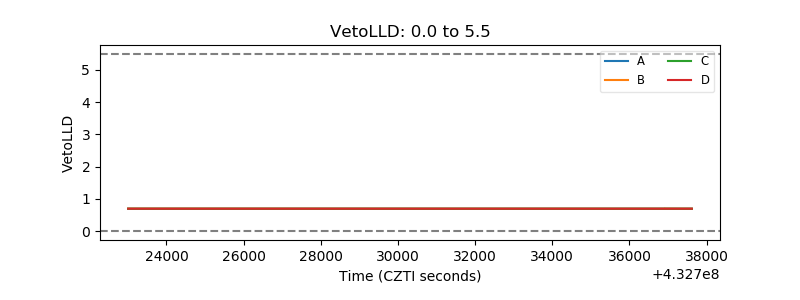 |
| Alpha Counter | 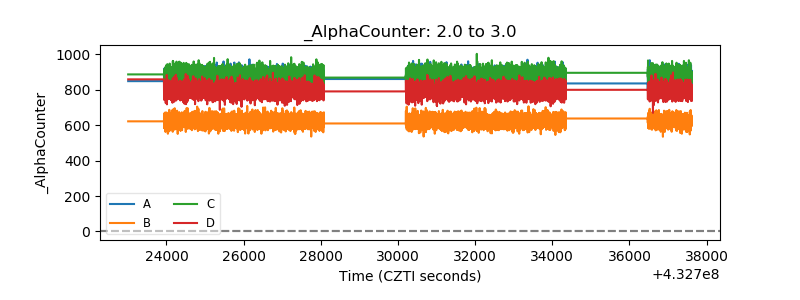 |
| _CPM_Rate | 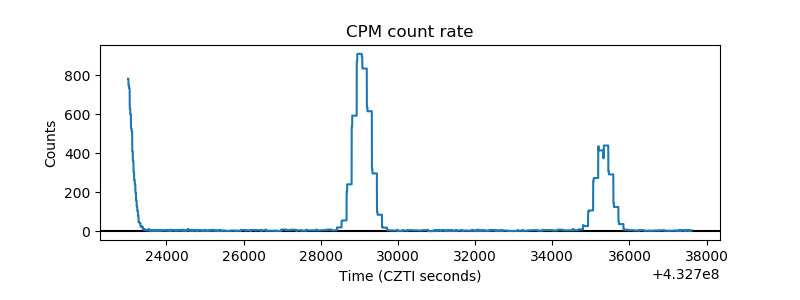 |
| CZT Counter | 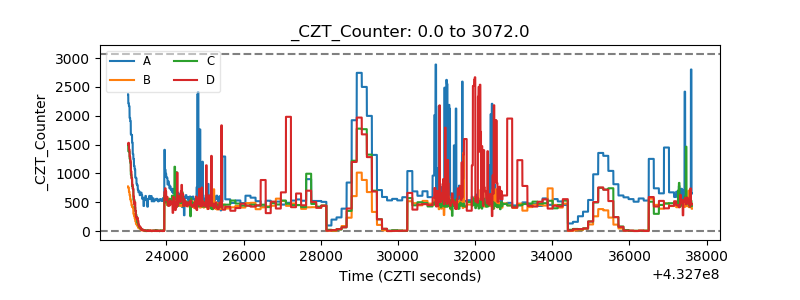 |
| +2.5 Volts monitor |  |
| +5 Volts monitor | 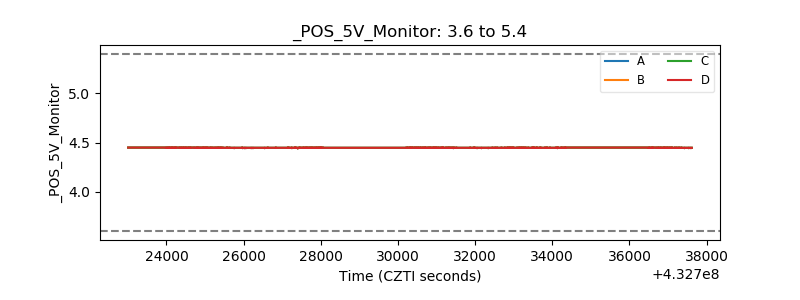 |
| _ROLL_ROT | 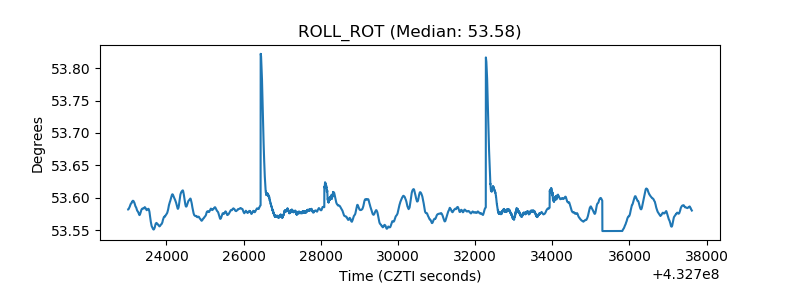 |
| _Roll_DEC | 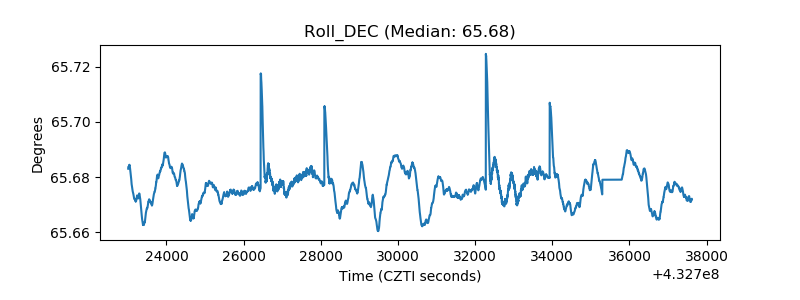 |
| _Roll_RA |  |
| Veto Counter | 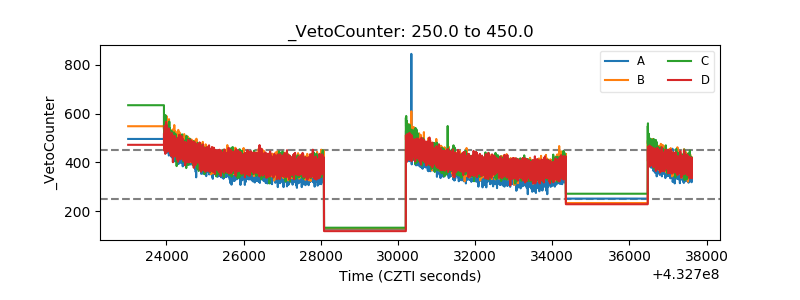 |