| Param | Original file | Final file |
|---|---|---|
| Filename | modeM0/AS1T05_154T01_9000005850_43114cztM0_level2.fits | modeM0/AS1T05_154T01_9000005850_43114cztM0_level2_quad_clean.evt |
| Size (bytes) | 302,906,880 | 83,704,320 |
| Size | 288.9 MB | 79.8 MB |
| Events in quadrant A | 3,283,233 | 564,395 |
| Events in quadrant B | 2,255,650 | 580,367 |
| Events in quadrant C | 2,436,743 | 546,368 |
| Events in quadrant D | 2,848,216 | 493,975 |
| Mode M0 | |||
|---|---|---|---|
| Quadrant | BADHDUFLAG | Total packets | Discarded packets |
| A | 0 | 12950 | 1 |
| B | 0 | 10180 | 1 |
| C | 0 | 10391 | 1 |
| D | 0 | 11920 | 1 |
| Mode SS | |||
|---|---|---|---|
| Quadrant | BADHDUFLAG | Total packets | Discarded packets |
| A | 0 | 102 | 0 |
| B | 0 | 102 | 0 |
| C | 0 | 102 | 0 |
| D | 0 | 102 | 0 |
| Mode M9 | |||
|---|---|---|---|
| Quadrant | BADHDUFLAG | Total packets | Discarded packets |
| A | 0 | 21 | 0 |
| B | 0 | 21 | 0 |
| C | 0 | 21 | 0 |
| D | 0 | 21 | 0 |
| Quadrant | Total seconds | Saturated seconds | Saturation percentage |
|---|---|---|---|
| A | 4982 | 188 | 3.773585% |
| B | 4982 | 11 | 0.220795% |
| C | 4983 | 9 | 0.180614% |
| D | 4983 | 179 | 3.592214% |
Noise dominated data is calculated using 1-second bins in cleaned event files. If a bin has >2000 counts, and if more than 50% of those come from <1% of pixels, then it is considered to be noise-dominated and hence unusable.
| Quadrant | # 1 sec bins | Bins with >0 counts | Bins with >2000 counts | High rate bins dominated by noise | Noise dominated (total time) | Noise dominated (detector-on time) | Marked lightcurve |
|---|---|---|---|---|---|---|---|
| A | 7045 | 4983 | 122 | 122 | 1.73% | 2.45% | 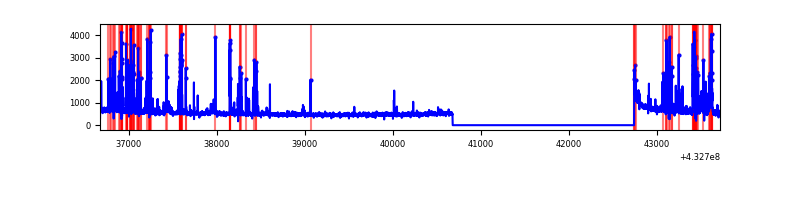 |
| B | 7045 | 4983 | 4 | 4 | 0.06% | 0.08% | 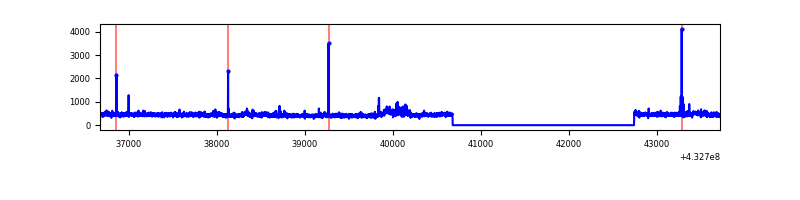 |
| C | 7046 | 4984 | 7 | 7 | 0.10% | 0.14% | 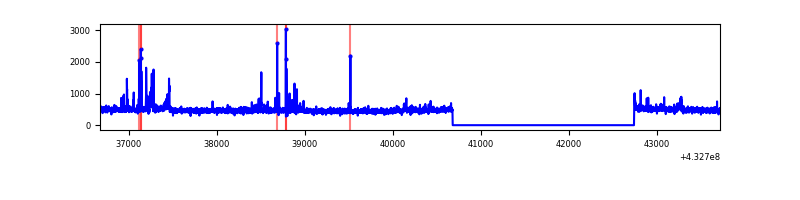 |
| D | 7046 | 4984 | 153 | 153 | 2.17% | 3.07% | 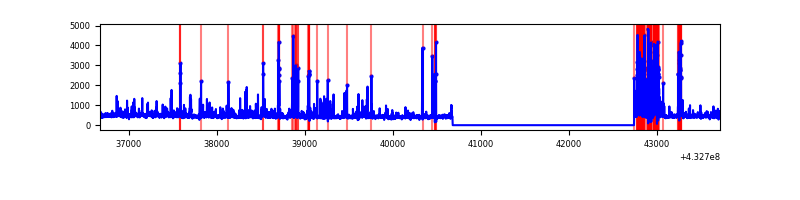 |
Top three noisy pixels from each quadrant. If the there are fewer than three noisy pixels in the level2.evt file, extra rows are filled as -1
| Pixel properties | Quadrant properties | ||||||
|---|---|---|---|---|---|---|---|
| Quadrant | DetID | PixID | Counts | Sigma | Mean | Median | Sigma |
| A | 15 | 237 | 639031 | 5800.23 | 534 | 523 | 110.1 |
| A | 10 | 83 | 505534 | 4587.54 | 534 | 523 | 110.1 |
| A | 15 | 222 | 35027 | 313.44 | 534 | 523 | 110.1 |
| B | 0 | 229 | 101355 | 977.46 | 535 | 519 | 103.2 |
| B | 0 | 189 | 13806 | 128.8 | 535 | 519 | 103.2 |
| B | 0 | 230 | 13569 | 126.5 | 535 | 519 | 103.2 |
| C | 15 | 214 | 221415 | 1819.38 | 528 | 530 | 121.4 |
| C | 14 | 254 | 102726 | 841.76 | 528 | 530 | 121.4 |
| C | 3 | 233 | 29734 | 240.55 | 528 | 530 | 121.4 |
| D | 1 | 52 | 680493 | 5346.32 | 519 | 504 | 127.2 |
| D | 12 | 33 | 56318 | 438.83 | 519 | 504 | 127.2 |
| D | 12 | 233 | 29887 | 231.02 | 519 | 504 | 127.2 |
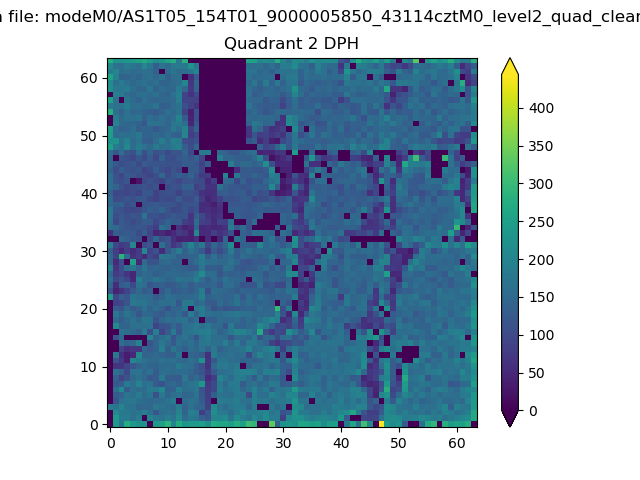
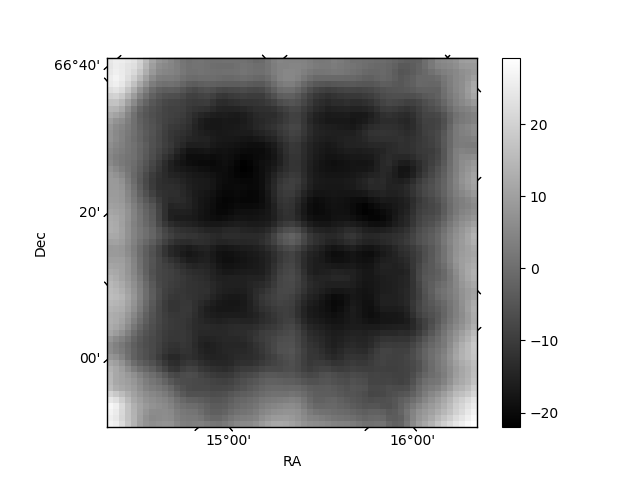
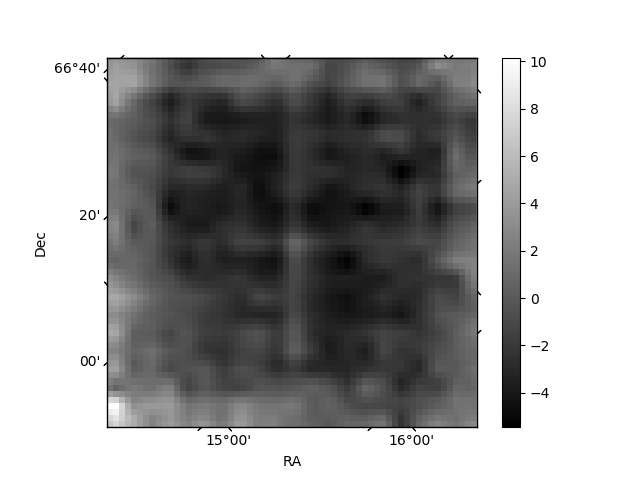
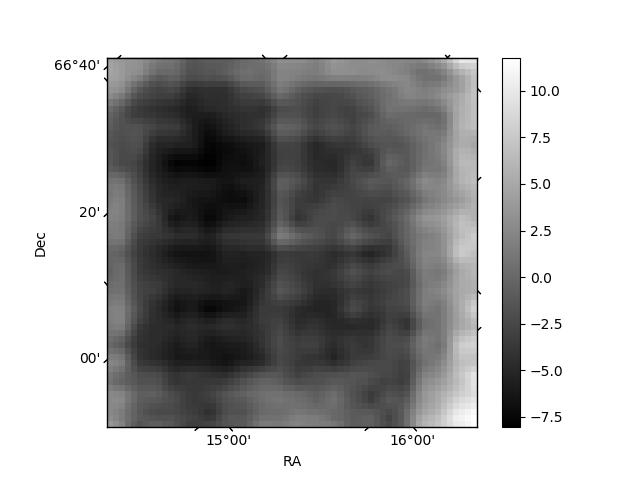
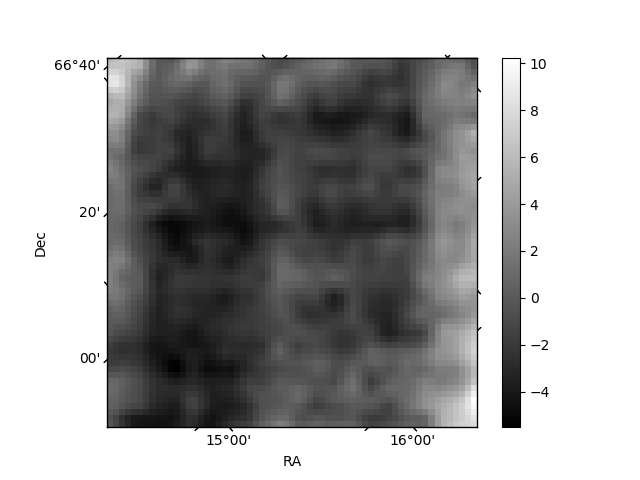
Histogram calculated using DETX and DETY for each event in the final _common_clean file
| Quadrant A | 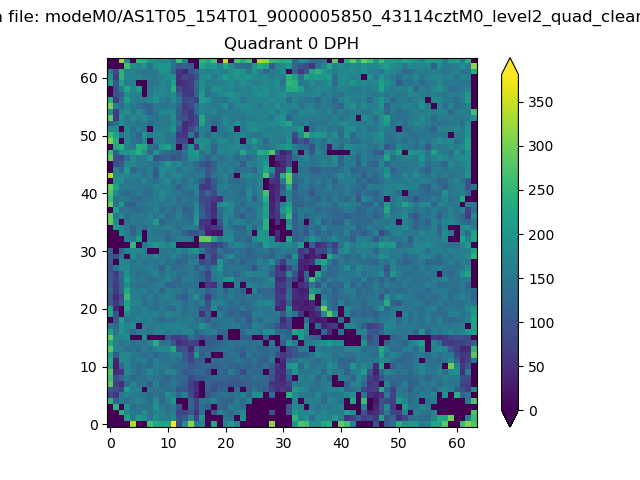 |
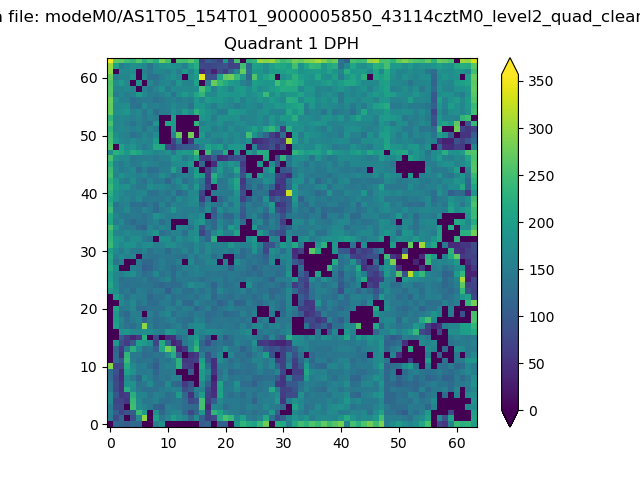 |
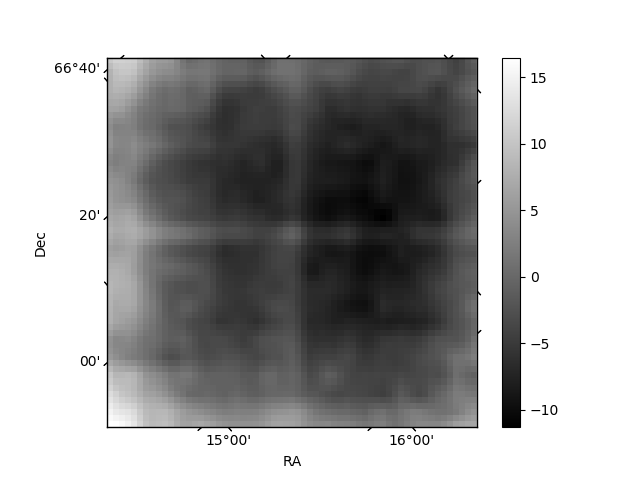
Quadrant B |
|---|---|---|---|
| Quadrant D | 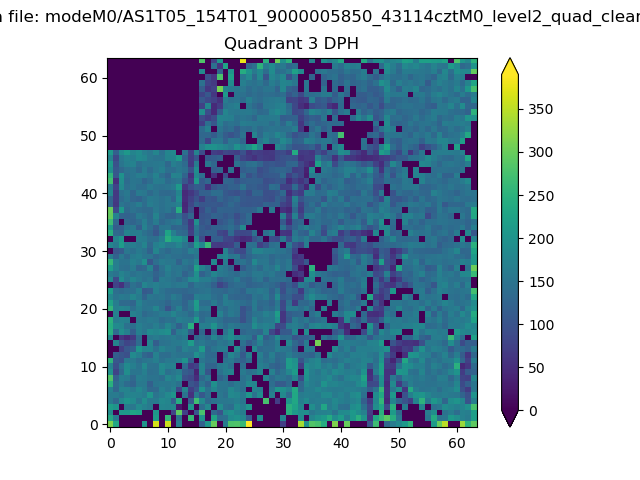 |
 |
Quadrant C |
| Plot type | Count rate plots | Images |
|---|---|---|
| Comparison with Poisson distribution Blue bars denote a histogram of data divided into 1 sec bins. Red curve is a Poisson curve with rate = median count rate of data. |
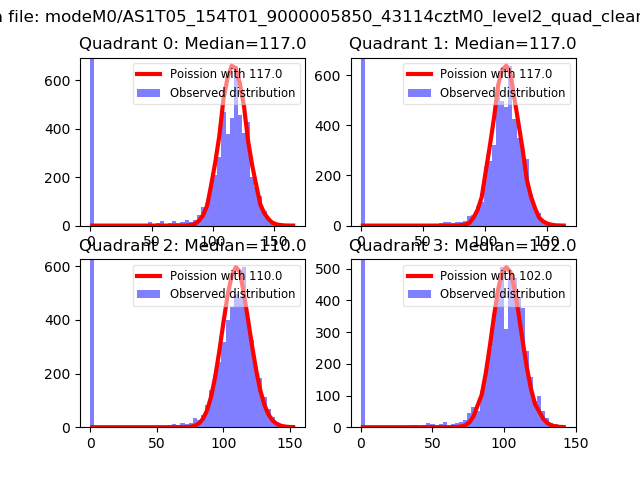 |
 |
| Quadrant-wise count rates Data is divided into 100 sec bins |
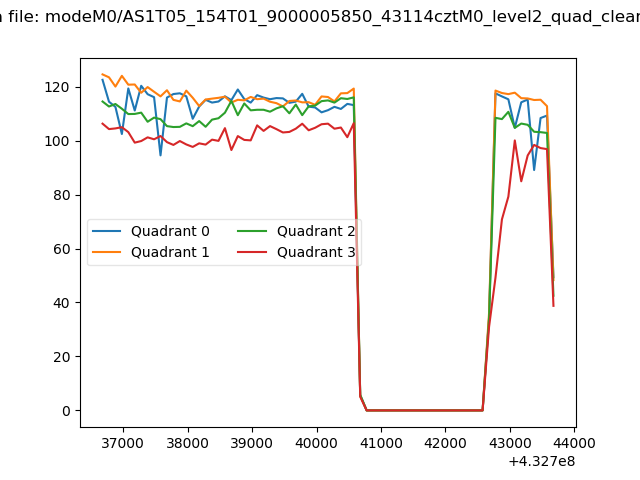 |
|
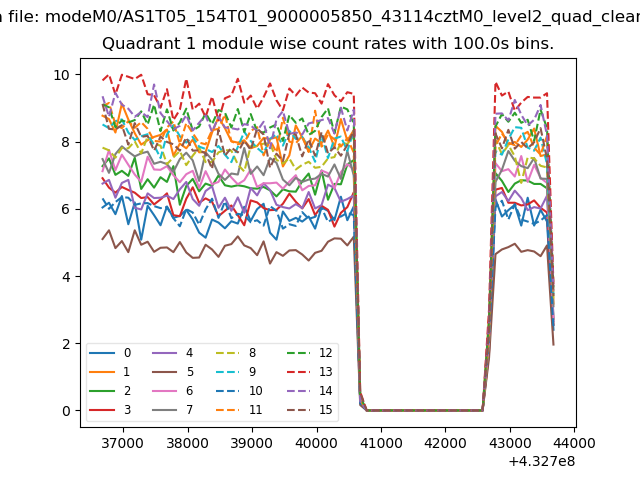
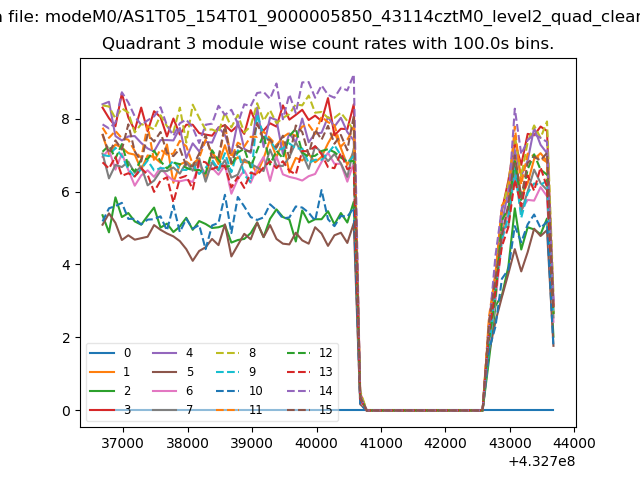
| Module-wise count rates for Quadrant A Data is divided into 100 sec bins |
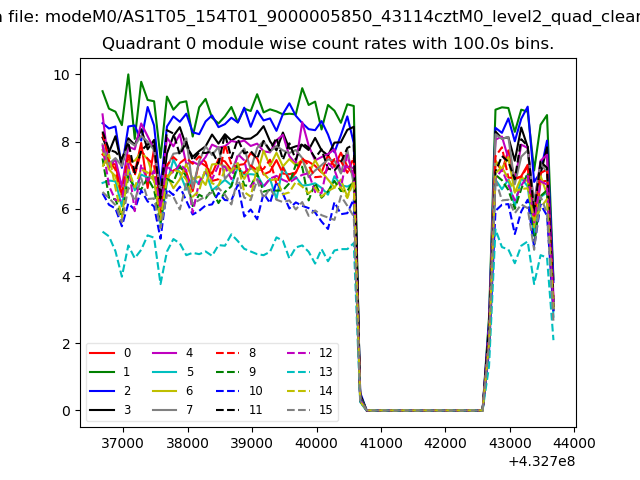 |
 |
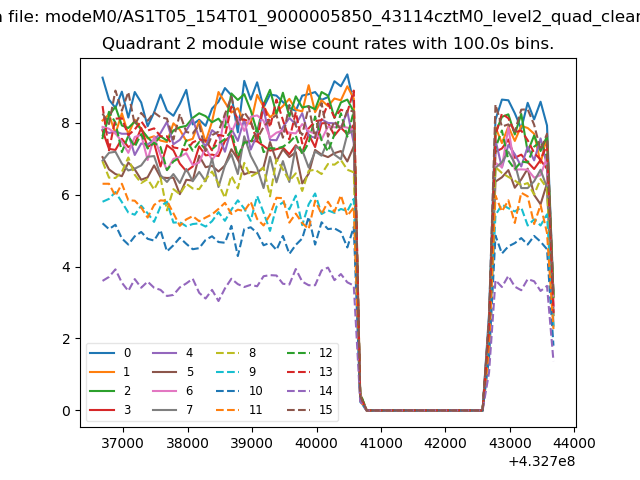
| Module-wise count rates for Quadrant B Data is divided into 100 sec bins |
 |
 |
| Module-wise count rates for Quadrant C Data is divided into 100 sec bins |
 |
 |
| Module-wise count rates for Quadrant D Data is divided into 100 sec bins |
 |
 |
| Parameter | Plot |
|---|---|
| CZT HV Monitor | 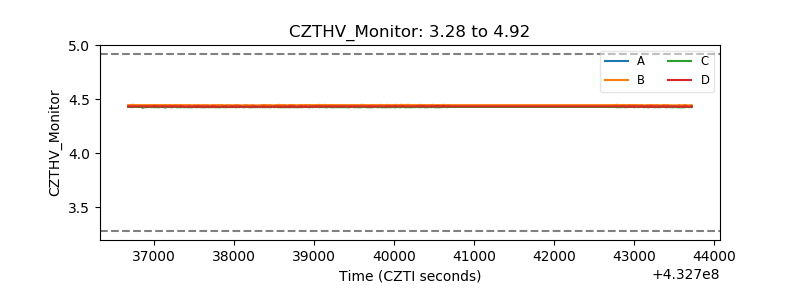 |
| D_VDD | 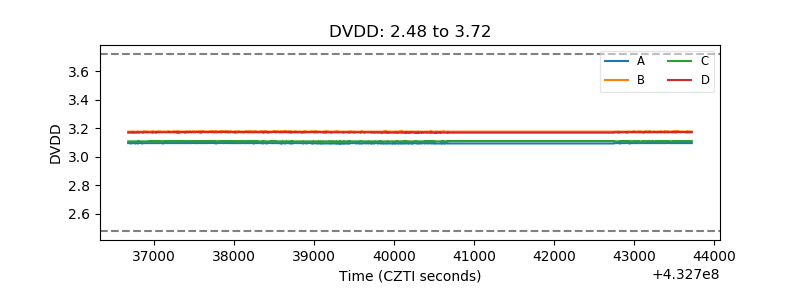 |
| Temperature 1 | 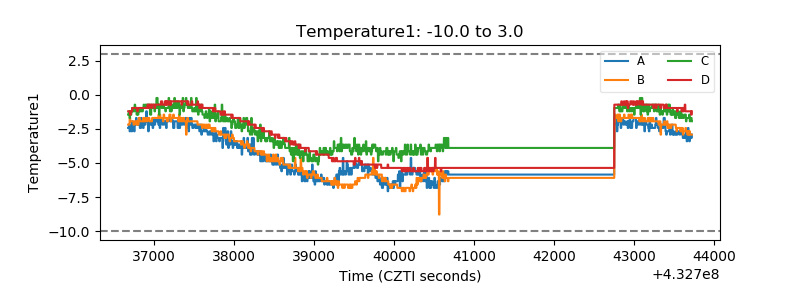 |
| Veto HV Monitor | 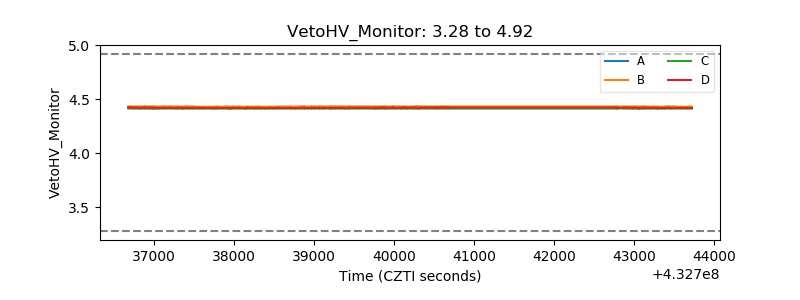 |
| Veto LLD | 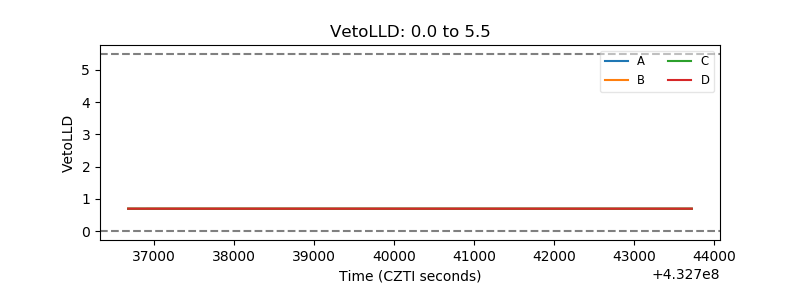 |
| Alpha Counter | 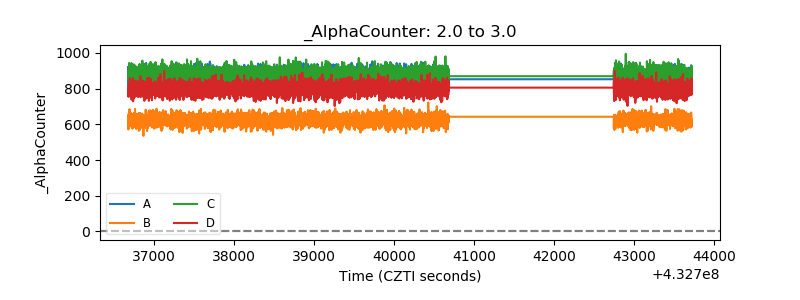 |
| _CPM_Rate | 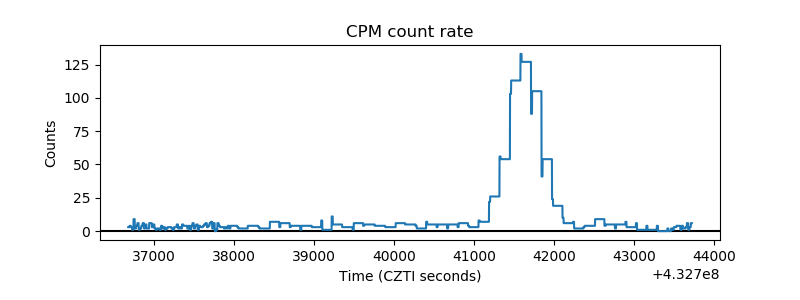 |
| CZT Counter | 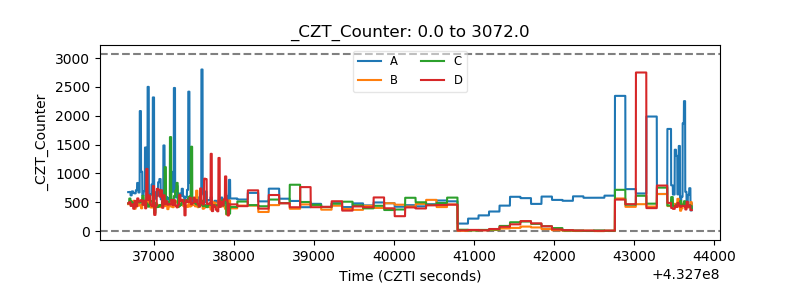 |
| +2.5 Volts monitor | 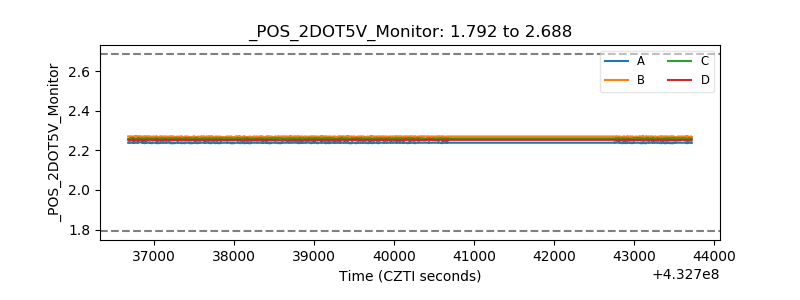 |
| +5 Volts monitor | 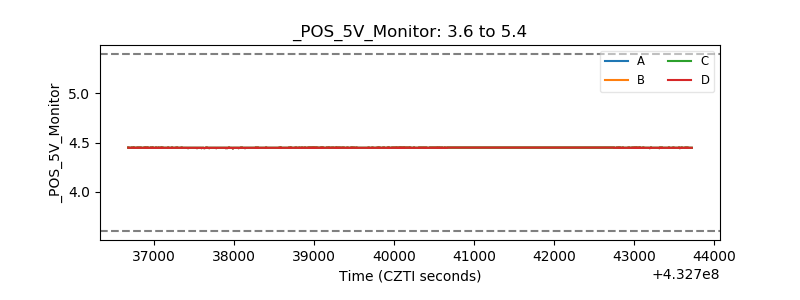 |
| _ROLL_ROT | 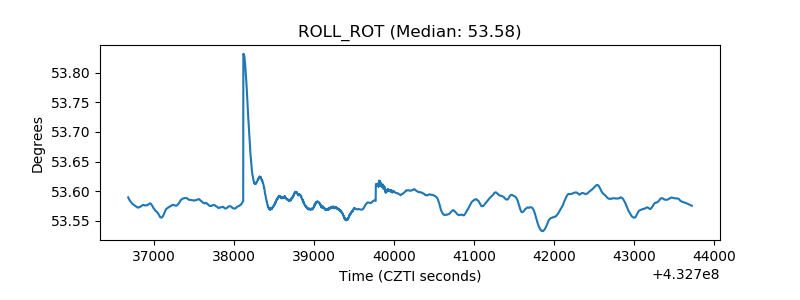 |
| _Roll_DEC | 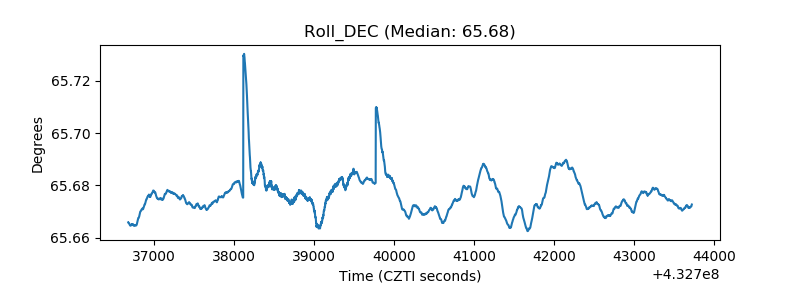 |
| _Roll_RA | 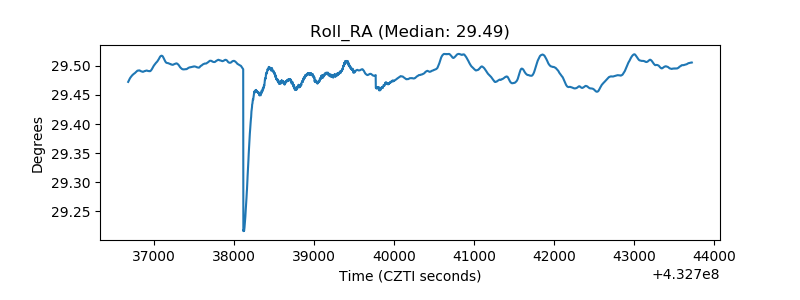 |
| Veto Counter | 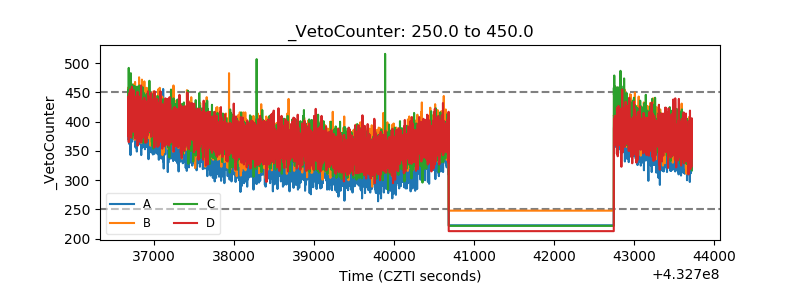 |