| Param | Original file | Final file |
|---|---|---|
| Filename | modeM0/AS1T05_154T01_9000005850_43115cztM0_level2.fits | modeM0/AS1T05_154T01_9000005850_43115cztM0_level2_quad_clean.evt |
| Size (bytes) | 320,276,160 | 86,840,640 |
| Size | 305.4 MB | 82.8 MB |
| Events in quadrant A | 3,452,998 | 577,994 |
| Events in quadrant B | 2,308,160 | 596,739 |
| Events in quadrant C | 2,548,849 | 569,213 |
| Events in quadrant D | 3,130,147 | 512,646 |
| Mode M0 | |||
|---|---|---|---|
| Quadrant | BADHDUFLAG | Total packets | Discarded packets |
| A | 0 | 13725 | 2 |
| B | 0 | 10798 | 2 |
| C | 0 | 11072 | 2 |
| D | 0 | 13320 | 4 |
| Mode SS | |||
|---|---|---|---|
| Quadrant | BADHDUFLAG | Total packets | Discarded packets |
| A | 0 | 108 | 0 |
| B | 0 | 108 | 0 |
| C | 0 | 108 | 0 |
| D | 0 | 108 | 0 |
| Mode M9 | |||
|---|---|---|---|
| Quadrant | BADHDUFLAG | Total packets | Discarded packets |
| A | 0 | 23 | 0 |
| B | 0 | 24 | 0 |
| C | 0 | 24 | 0 |
| D | 0 | 24 | 0 |
| Quadrant | Total seconds | Saturated seconds | Saturation percentage |
|---|---|---|---|
| A | 5328 | 204 | 3.828829% |
| B | 5328 | 9 | 0.168919% |
| C | 5328 | 12 | 0.225225% |
| D | 5327 | 249 | 4.674301% |
Noise dominated data is calculated using 1-second bins in cleaned event files. If a bin has >2000 counts, and if more than 50% of those come from <1% of pixels, then it is considered to be noise-dominated and hence unusable.
| Quadrant | # 1 sec bins | Bins with >0 counts | Bins with >2000 counts | High rate bins dominated by noise | Noise dominated (total time) | Noise dominated (detector-on time) | Marked lightcurve |
|---|---|---|---|---|---|---|---|
| A | 7120 | 5329 | 134 | 134 | 1.88% | 2.51% | 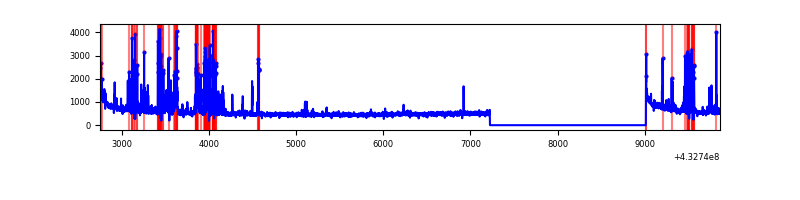 |
| B | 7120 | 5329 | 3 | 3 | 0.04% | 0.06% | 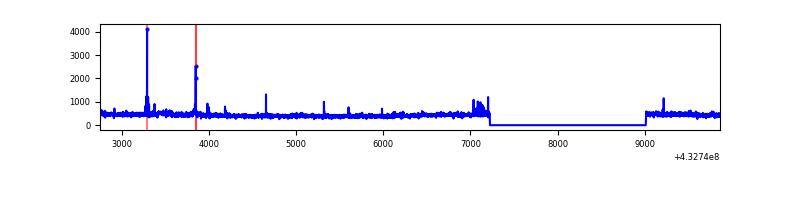 |
| C | 7120 | 5329 | 11 | 11 | 0.15% | 0.21% | 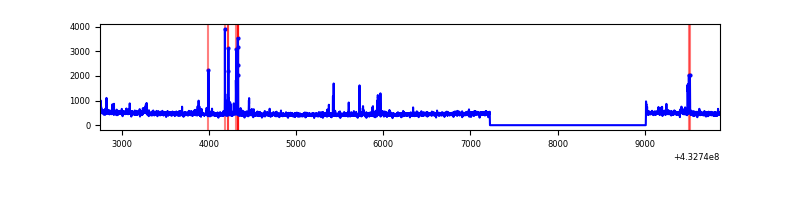 |
| D | 7119 | 5328 | 210 | 210 | 2.95% | 3.94% | 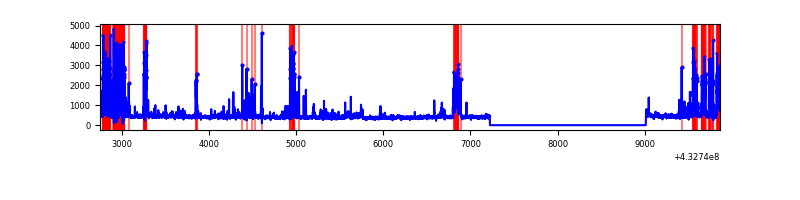 |
Top three noisy pixels from each quadrant. If the there are fewer than three noisy pixels in the level2.evt file, extra rows are filled as -1
| Pixel properties | Quadrant properties | ||||||
|---|---|---|---|---|---|---|---|
| Quadrant | DetID | PixID | Counts | Sigma | Mean | Median | Sigma |
| A | 15 | 237 | 632847 | 5568.29 | 551 | 539 | 113.6 |
| A | 10 | 83 | 594114 | 5227.2 | 551 | 539 | 113.6 |
| A | 15 | 222 | 66210 | 578.31 | 551 | 539 | 113.6 |
| B | 0 | 229 | 53034 | 482.73 | 558 | 542 | 108.7 |
| B | 3 | 112 | 21338 | 191.25 | 558 | 542 | 108.7 |
| B | 0 | 230 | 15539 | 137.92 | 558 | 542 | 108.7 |
| C | 15 | 214 | 239973 | 1872.37 | 550 | 552 | 127.9 |
| C | 14 | 254 | 117893 | 917.65 | 550 | 552 | 127.9 |
| C | 3 | 233 | 29645 | 227.52 | 550 | 552 | 127.9 |
| D | 1 | 52 | 709008 | 5347.79 | 541 | 527 | 132.5 |
| D | 10 | 118 | 218544 | 1645.65 | 541 | 527 | 132.5 |
| D | 5 | 32 | 43555 | 324.79 | 541 | 527 | 132.5 |
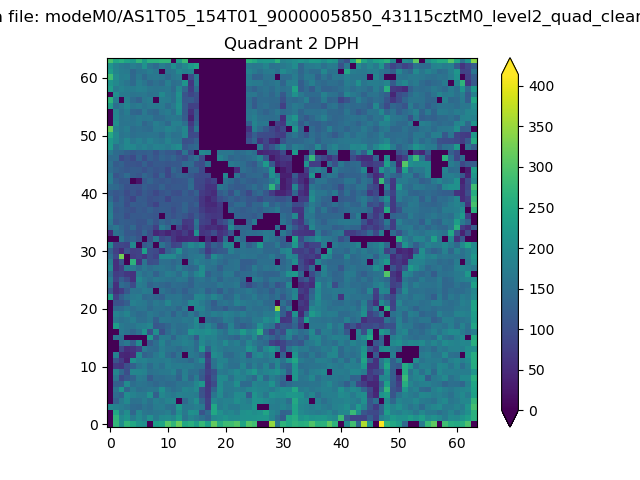
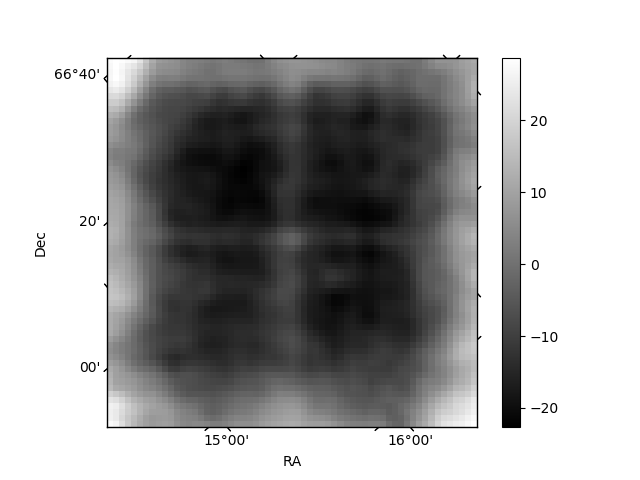
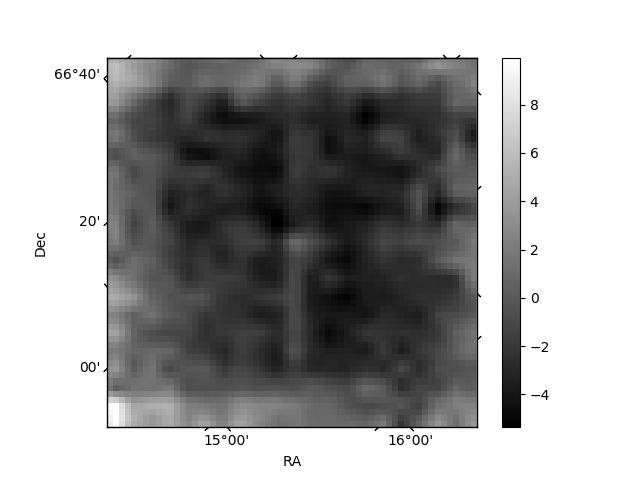
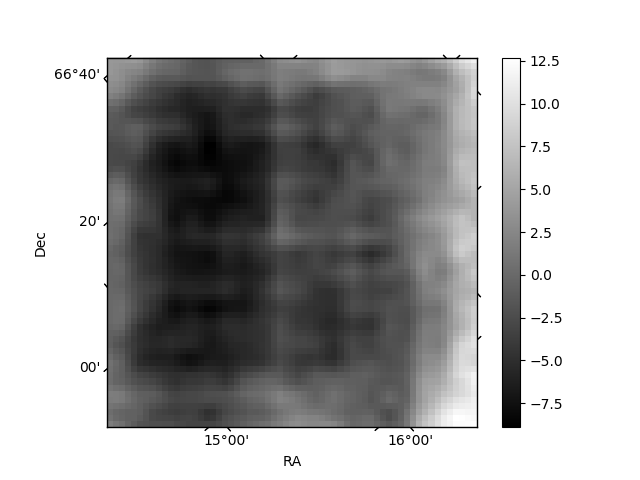
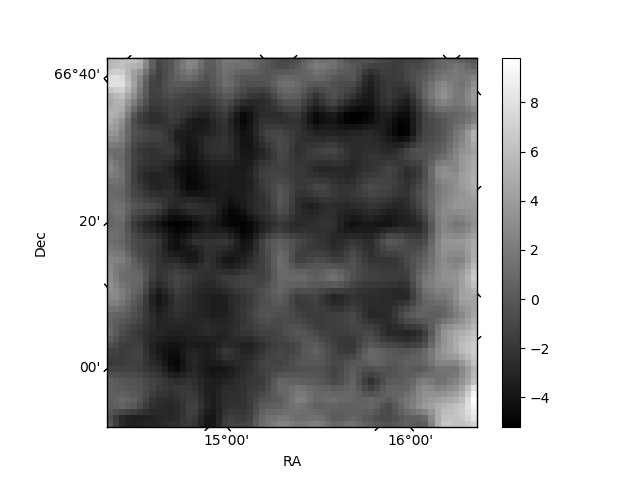
Histogram calculated using DETX and DETY for each event in the final _common_clean file
| Quadrant A | 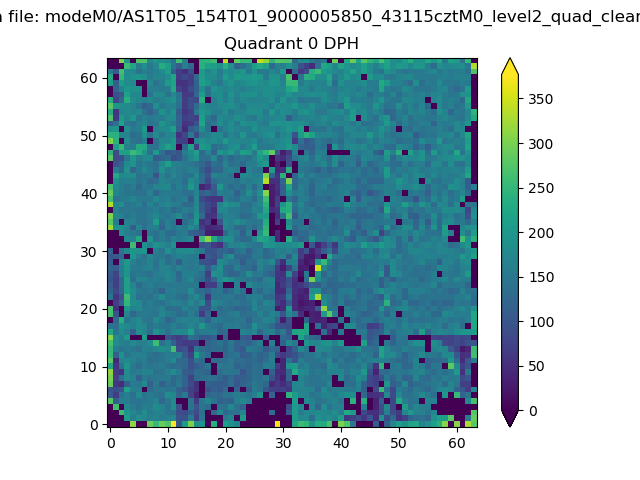 |
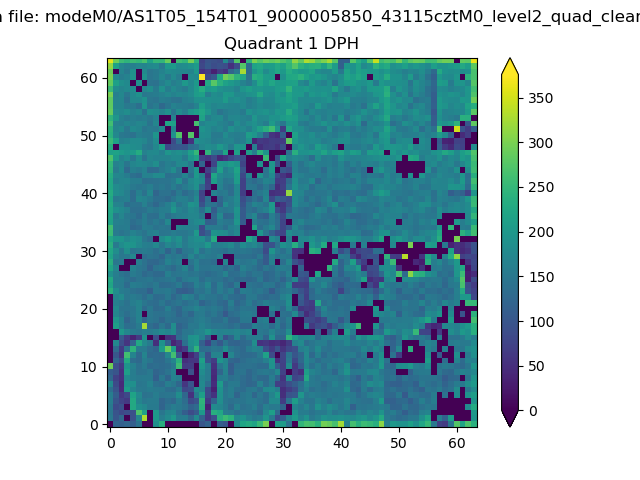 |
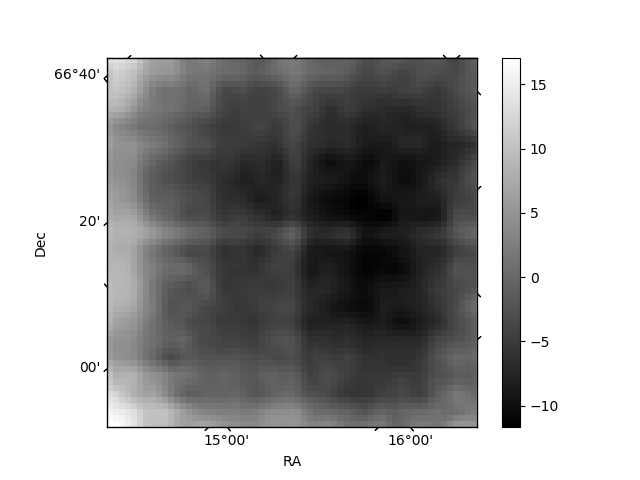
Quadrant B |
|---|---|---|---|
| Quadrant D | 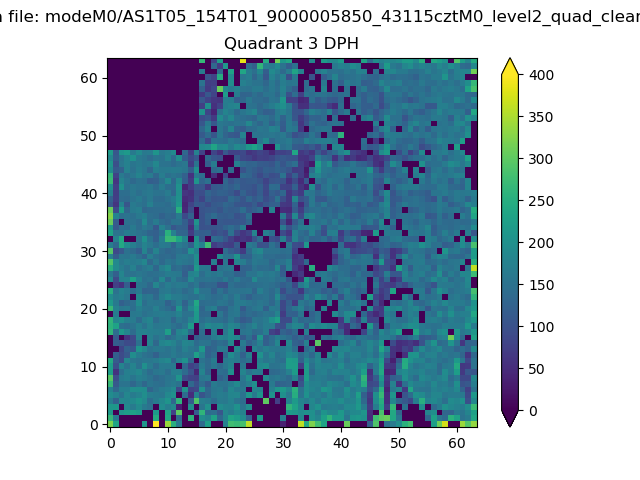 |
 |
Quadrant C |
| Plot type | Count rate plots | Images |
|---|---|---|
| Comparison with Poisson distribution Blue bars denote a histogram of data divided into 1 sec bins. Red curve is a Poisson curve with rate = median count rate of data. |
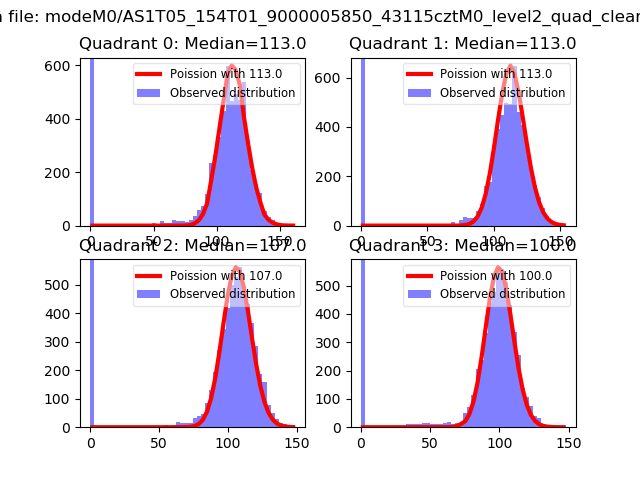 |
 |
| Quadrant-wise count rates Data is divided into 100 sec bins |
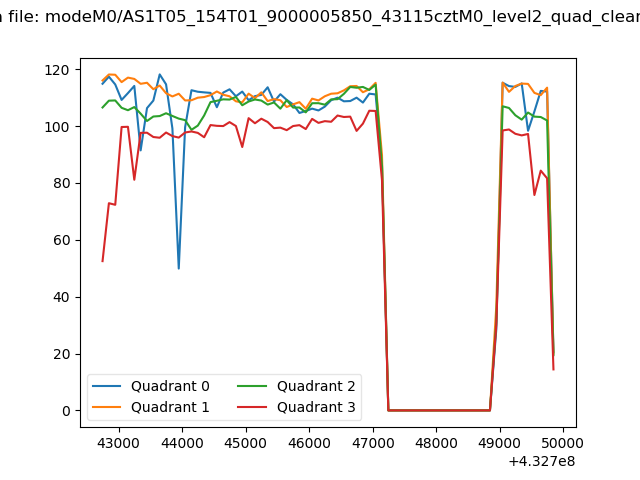 |
|
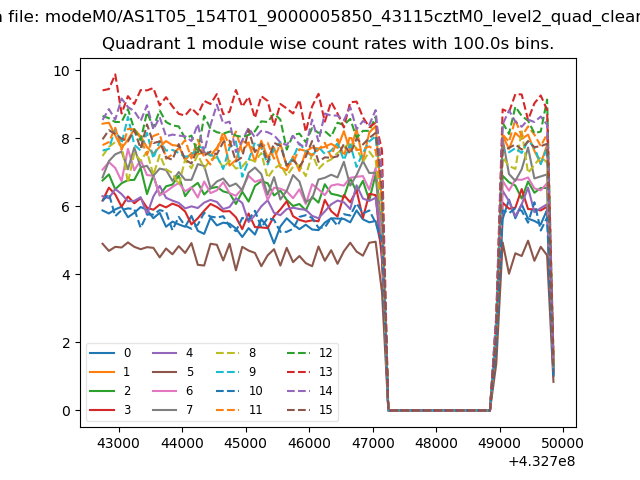
| Module-wise count rates for Quadrant A Data is divided into 100 sec bins |
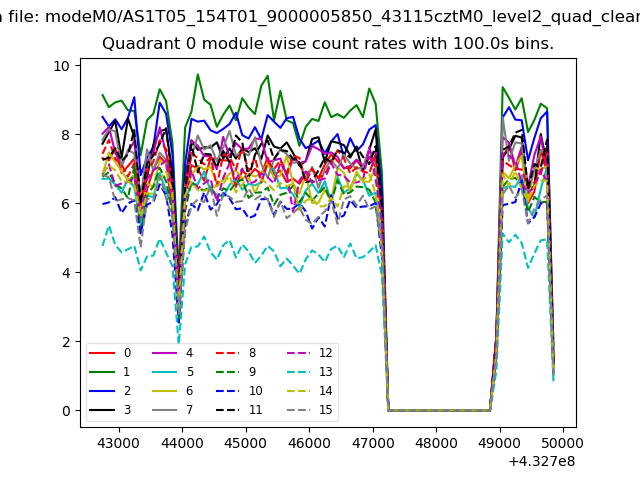 |
 |
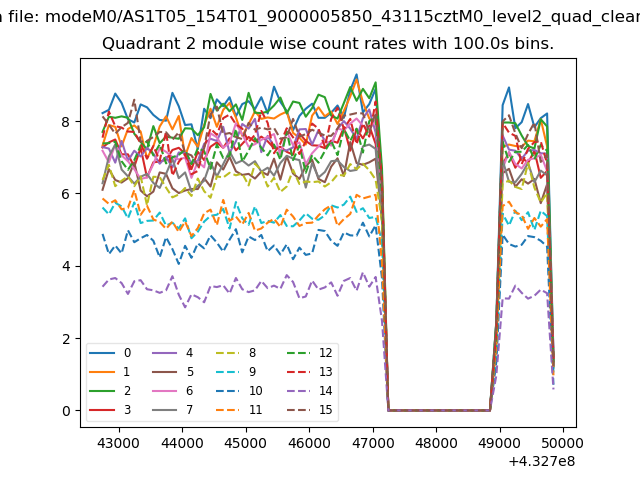
| Module-wise count rates for Quadrant B Data is divided into 100 sec bins |
 |
 |
| Module-wise count rates for Quadrant C Data is divided into 100 sec bins |
 |
 |
| Module-wise count rates for Quadrant D Data is divided into 100 sec bins |
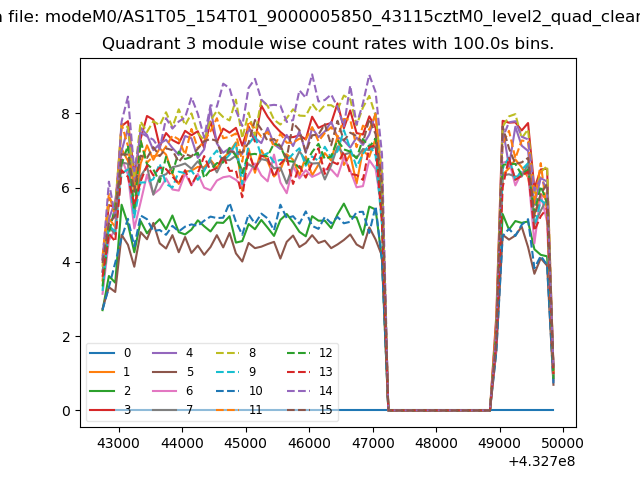 |
 |
| Parameter | Plot |
|---|---|
| CZT HV Monitor | 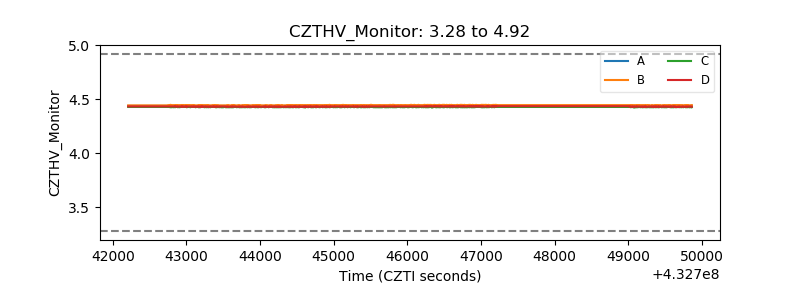 |
| D_VDD | 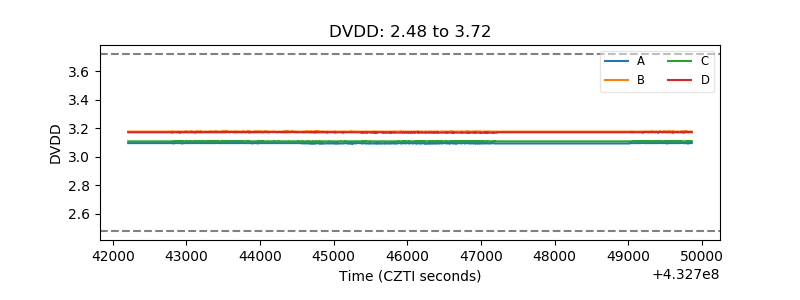 |
| Temperature 1 |  |
| Veto HV Monitor | 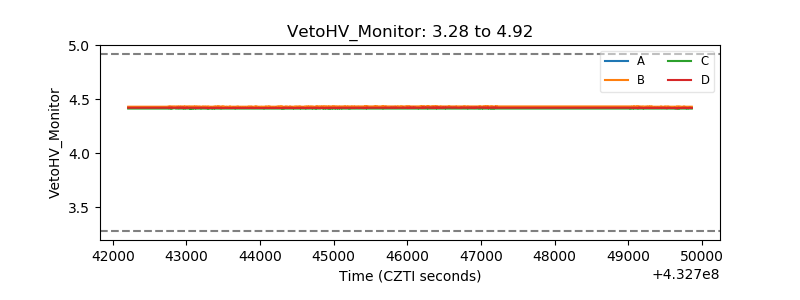 |
| Veto LLD | 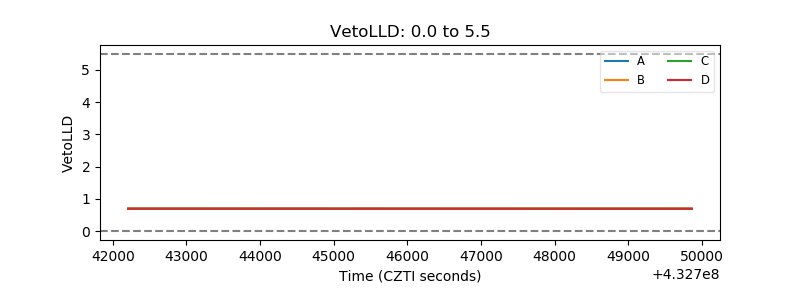 |
| Alpha Counter | 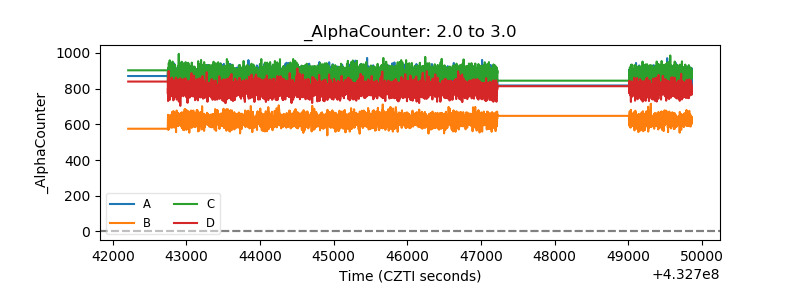 |
| _CPM_Rate | 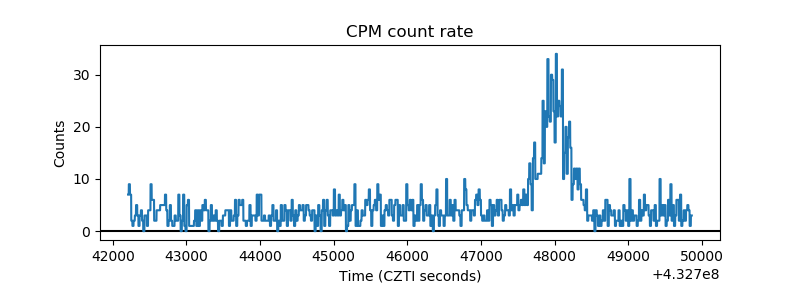 |
| CZT Counter | 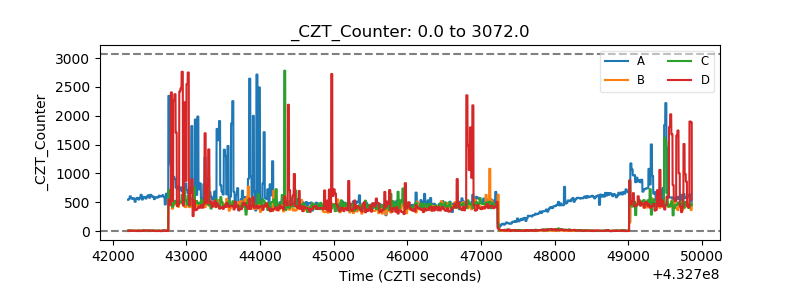 |
| +2.5 Volts monitor | 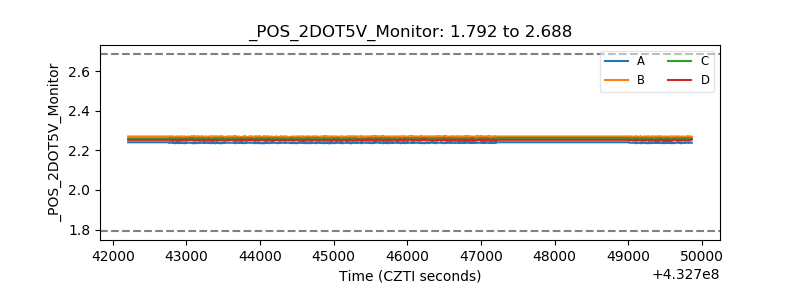 |
| +5 Volts monitor |  |
| _ROLL_ROT | 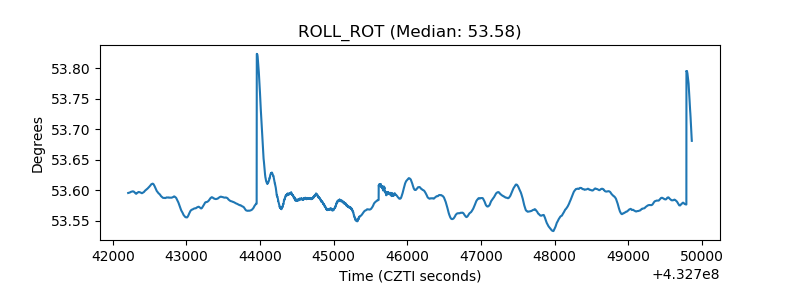 |
| _Roll_DEC | 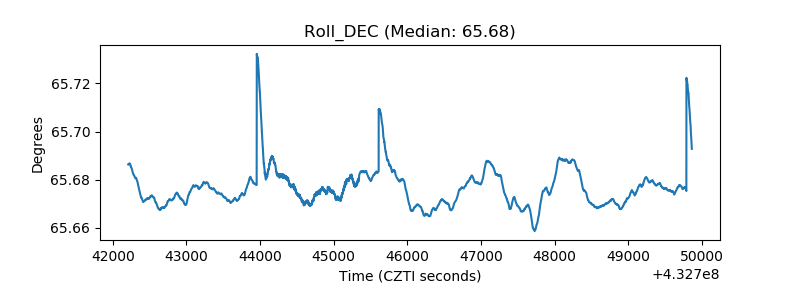 |
| _Roll_RA | 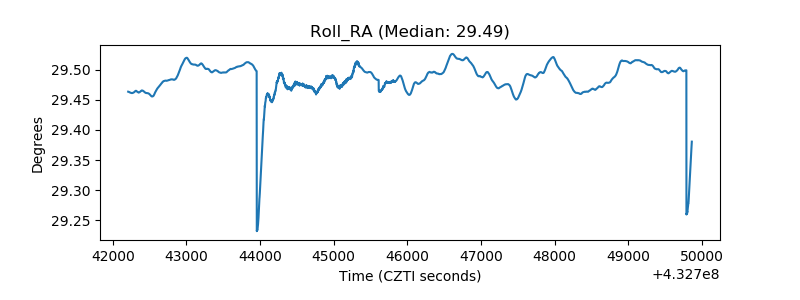 |
| Veto Counter | 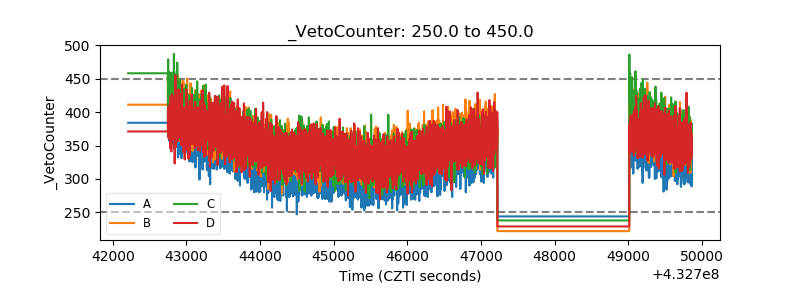 |