| Param | Original file | Final file |
|---|---|---|
| Filename | modeM0/AS1T05_154T01_9000005850_43117cztM0_level2.fits | modeM0/AS1T05_154T01_9000005850_43117cztM0_level2_quad_clean.evt |
| Size (bytes) | 383,561,280 | 96,649,920 |
| Size | 365.8 MB | 92.2 MB |
| Events in quadrant A | 4,391,623 | 633,384 |
| Events in quadrant B | 2,609,429 | 654,369 |
| Events in quadrant C | 2,813,265 | 639,454 |
| Events in quadrant D | 3,927,444 | 589,199 |
| Mode M0 | |||
|---|---|---|---|
| Quadrant | BADHDUFLAG | Total packets | Discarded packets |
| A | 0 | 16892 | 2 |
| B | 0 | 12025 | 2 |
| C | 0 | 12319 | 2 |
| D | 0 | 15953 | 2 |
| Mode SS | |||
|---|---|---|---|
| Quadrant | BADHDUFLAG | Total packets | Discarded packets |
| A | 0 | 120 | 0 |
| B | 0 | 120 | 0 |
| C | 0 | 120 | 0 |
| D | 0 | 120 | 0 |
| Mode M9 | |||
|---|---|---|---|
| Quadrant | BADHDUFLAG | Total packets | Discarded packets |
| A | 0 | 19 | 0 |
| B | 0 | 20 | 0 |
| C | 0 | 20 | 0 |
| D | 0 | 20 | 0 |
| Quadrant | Total seconds | Saturated seconds | Saturation percentage |
|---|---|---|---|
| A | 5865 | 351 | 5.984655% |
| B | 5864 | 7 | 0.119372% |
| C | 5864 | 27 | 0.460437% |
| D | 5864 | 219 | 3.734652% |
Noise dominated data is calculated using 1-second bins in cleaned event files. If a bin has >2000 counts, and if more than 50% of those come from <1% of pixels, then it is considered to be noise-dominated and hence unusable.
| Quadrant | # 1 sec bins | Bins with >0 counts | Bins with >2000 counts | High rate bins dominated by noise | Noise dominated (total time) | Noise dominated (detector-on time) | Marked lightcurve |
|---|---|---|---|---|---|---|---|
| A | 7178 | 5865 | 242 | 242 | 3.37% | 4.13% | 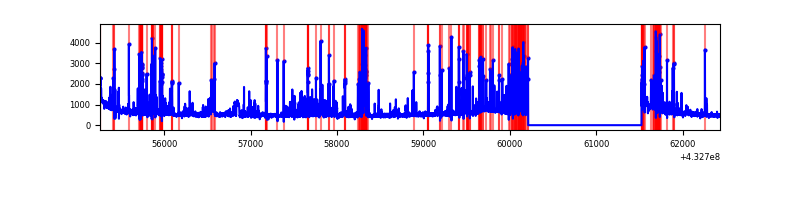 |
| B | 7177 | 5865 | 0 | 0 | 0.00% | 0.00% | 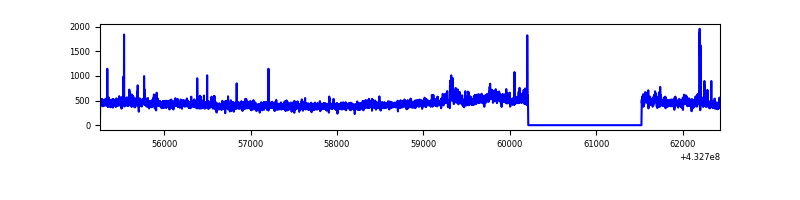 |
| C | 7177 | 5865 | 15 | 15 | 0.21% | 0.26% | 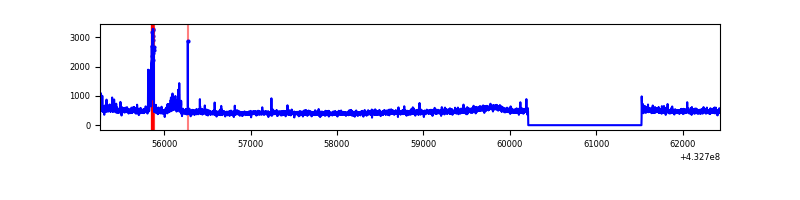 |
| D | 7177 | 5865 | 220 | 220 | 3.07% | 3.75% | 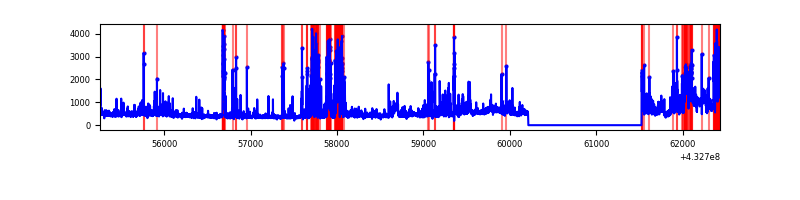 |
Top three noisy pixels from each quadrant. If the there are fewer than three noisy pixels in the level2.evt file, extra rows are filled as -1
| Pixel properties | Quadrant properties | ||||||
|---|---|---|---|---|---|---|---|
| Quadrant | DetID | PixID | Counts | Sigma | Mean | Median | Sigma |
| A | 15 | 222 | 864753 | 6871.65 | 608 | 595 | 125.8 |
| A | 10 | 83 | 610620 | 4850.83 | 608 | 595 | 125.8 |
| A | 15 | 237 | 503706 | 4000.66 | 608 | 595 | 125.8 |
| B | 0 | 229 | 97966 | 811.49 | 616 | 598 | 120.0 |
| B | 0 | 189 | 51391 | 423.32 | 616 | 598 | 120.0 |
| B | 0 | 230 | 25109 | 204.28 | 616 | 598 | 120.0 |
| C | 15 | 214 | 244529 | 1703.43 | 611 | 615 | 143.2 |
| C | 3 | 233 | 158152 | 1100.2 | 611 | 615 | 143.2 |
| C | 0 | 239 | 13262 | 88.32 | 611 | 615 | 143.2 |
| D | 1 | 52 | 1195370 | 7970.41 | 608 | 590 | 149.9 |
| D | 5 | 32 | 145580 | 967.23 | 608 | 590 | 149.9 |
| D | 12 | 0 | 58623 | 387.14 | 608 | 590 | 149.9 |
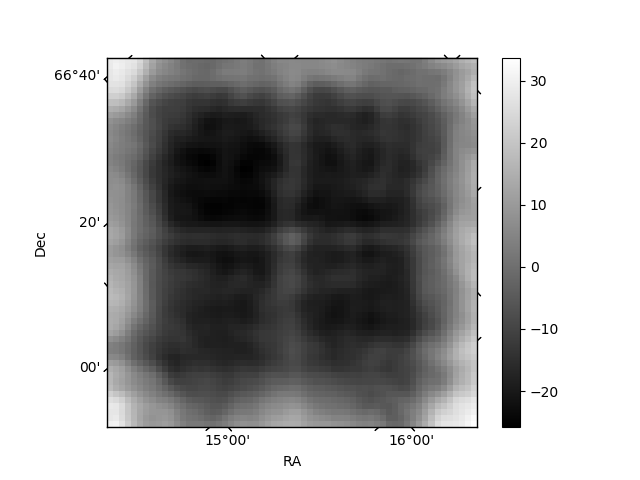
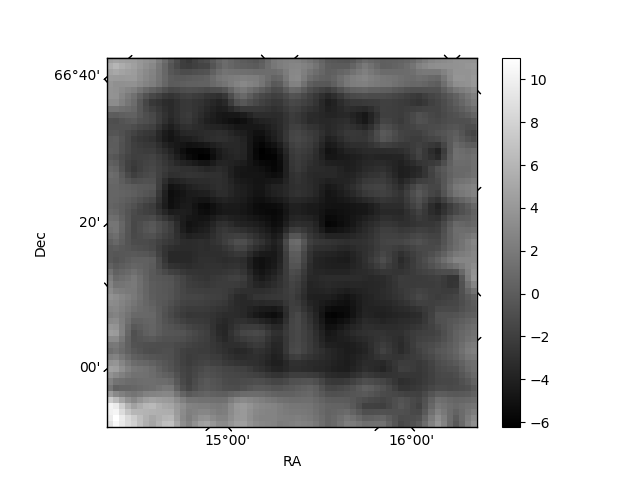
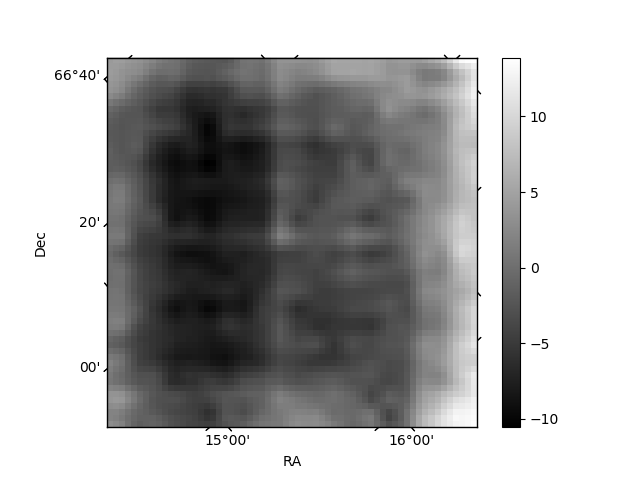
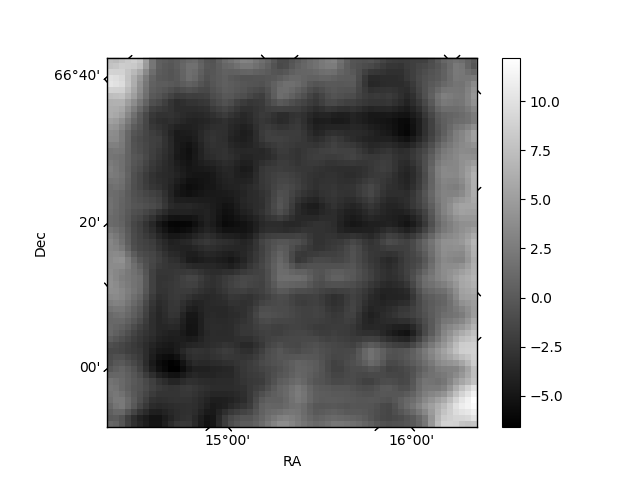
Histogram calculated using DETX and DETY for each event in the final _common_clean file
| Quadrant A | 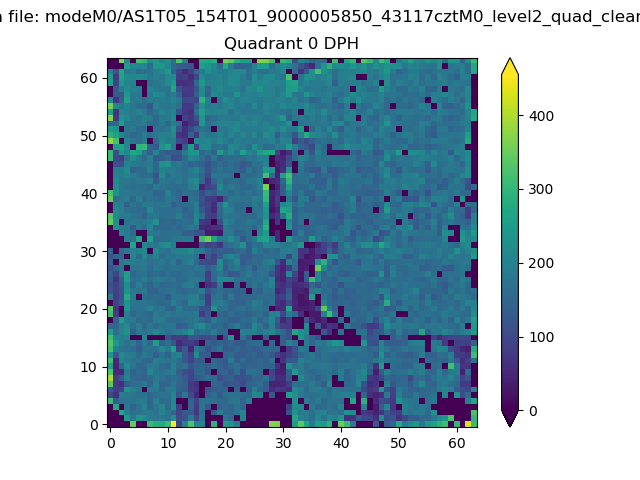 |
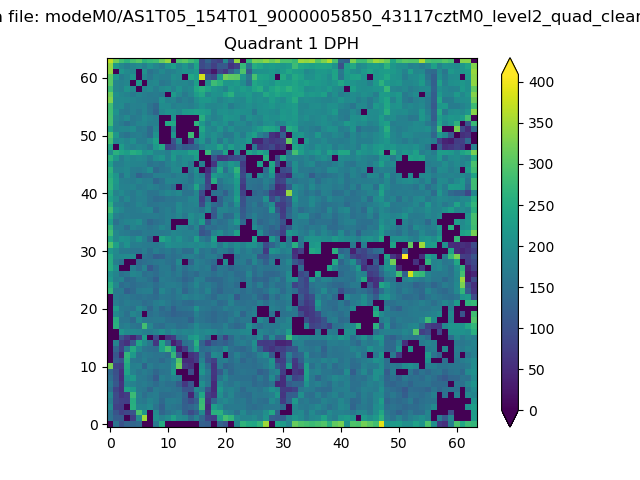 |
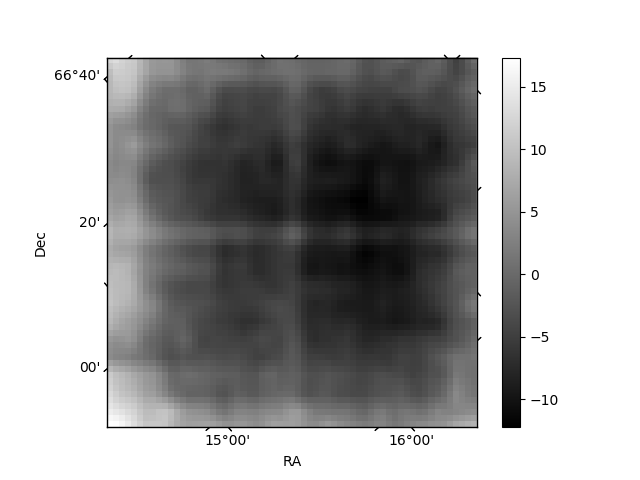
Quadrant B |
|---|---|---|---|
| Quadrant D | 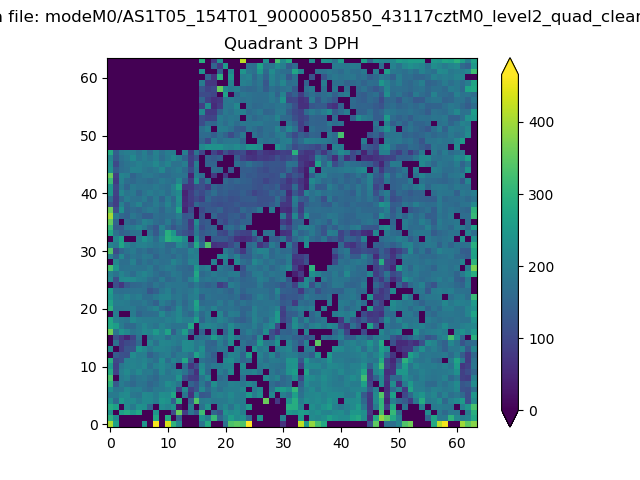 |
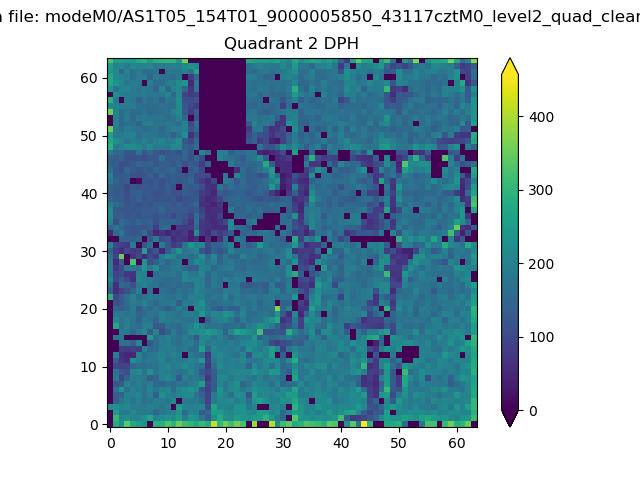 |
Quadrant C |
| Plot type | Count rate plots | Images |
|---|---|---|
| Comparison with Poisson distribution Blue bars denote a histogram of data divided into 1 sec bins. Red curve is a Poisson curve with rate = median count rate of data. |
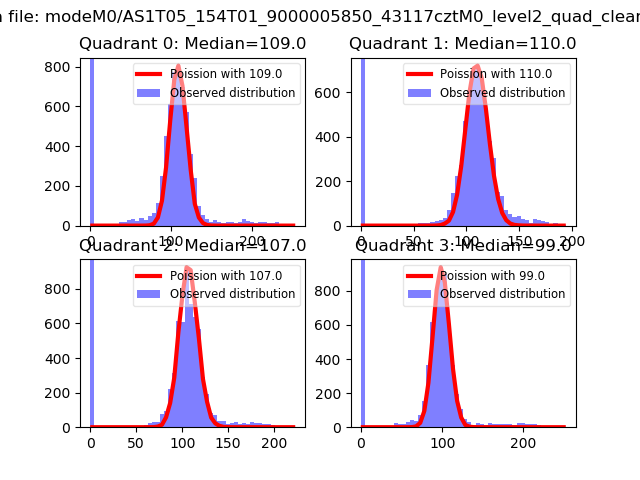 |
 |
| Quadrant-wise count rates Data is divided into 100 sec bins |
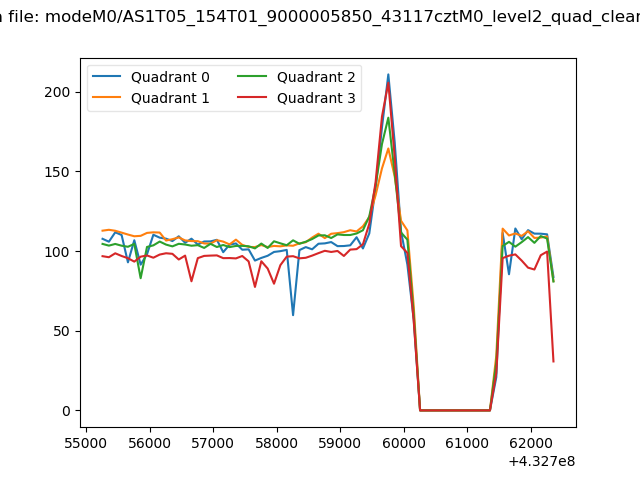 |
|
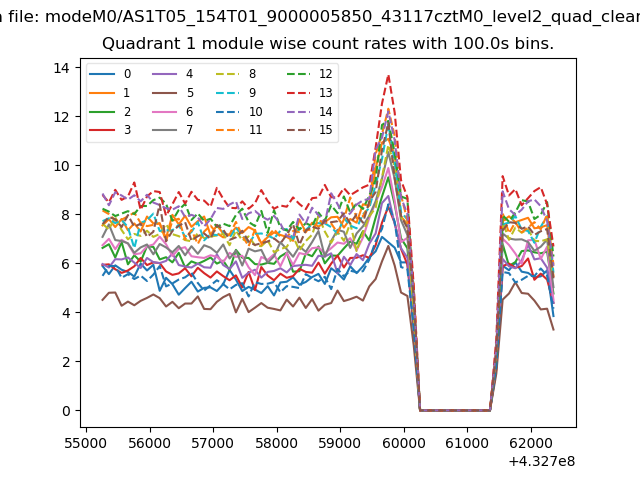
| Module-wise count rates for Quadrant A Data is divided into 100 sec bins |
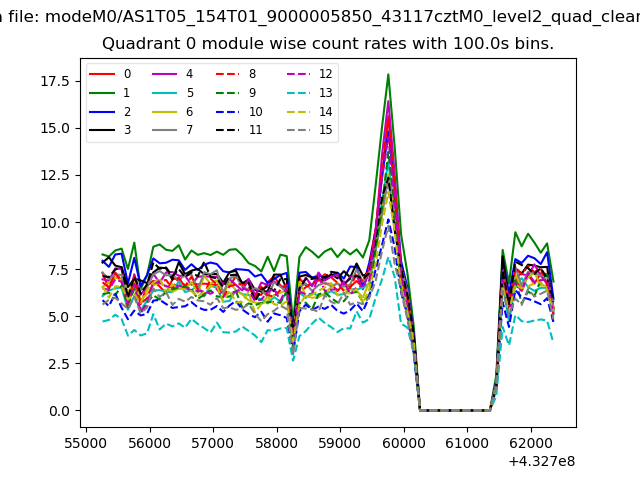 |
 |
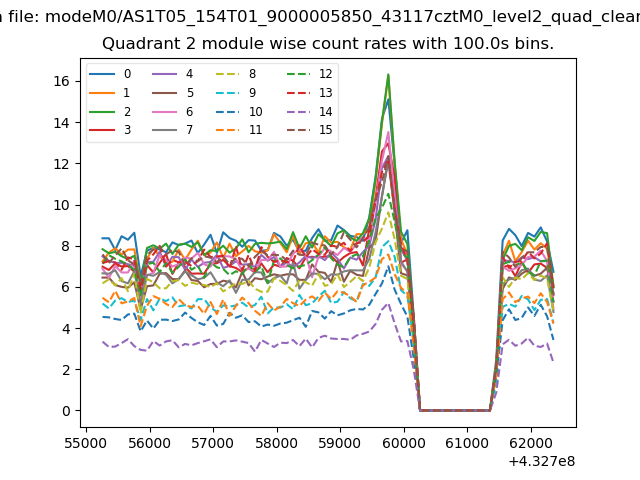
| Module-wise count rates for Quadrant B Data is divided into 100 sec bins |
 |
 |
| Module-wise count rates for Quadrant C Data is divided into 100 sec bins |
 |
 |
| Module-wise count rates for Quadrant D Data is divided into 100 sec bins |
 |
 |
| Parameter | Plot |
|---|---|
| CZT HV Monitor | 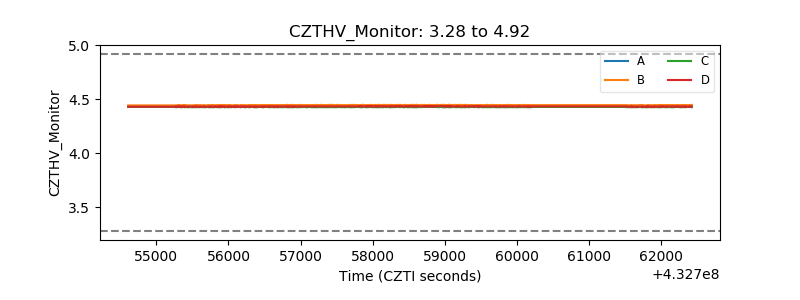 |
| D_VDD | 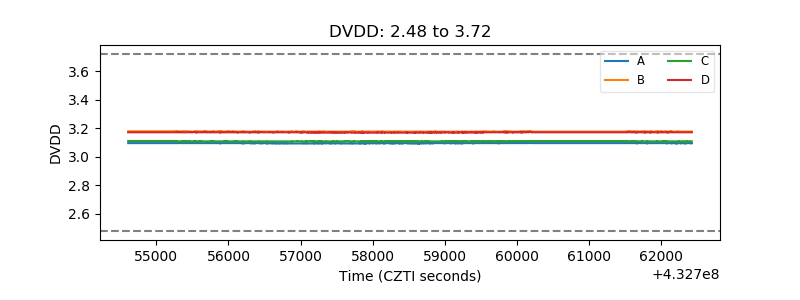 |
| Temperature 1 |  |
| Veto HV Monitor |  |
| Veto LLD | 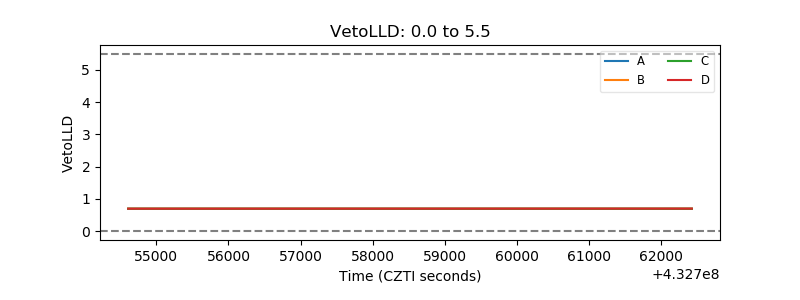 |
| Alpha Counter | 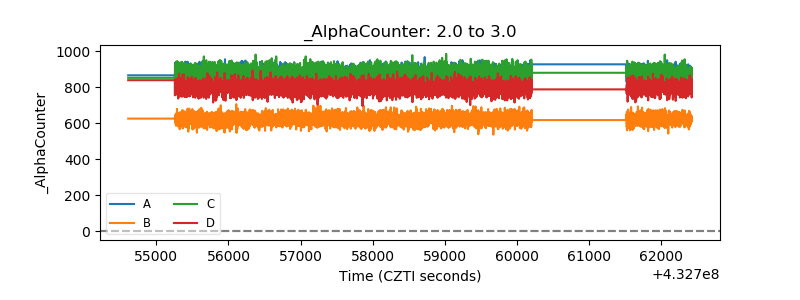 |
| _CPM_Rate | 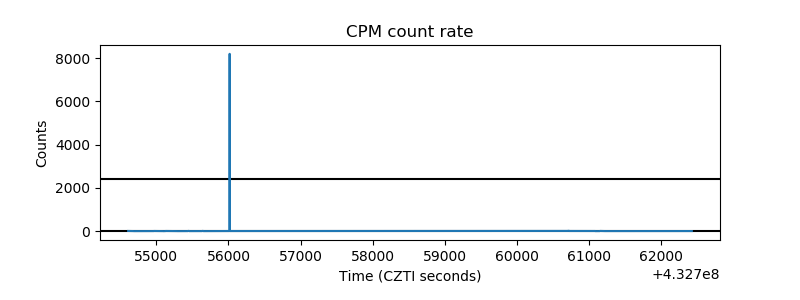 |
| CZT Counter | 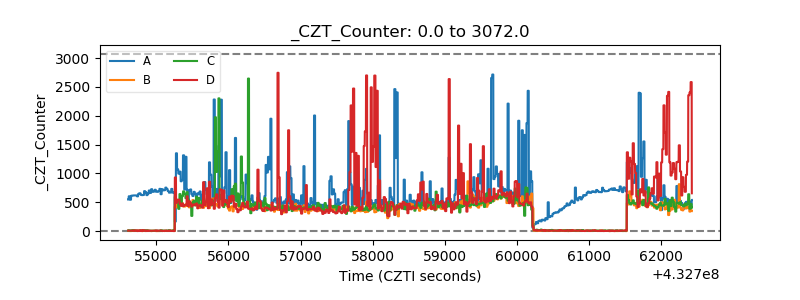 |
| +2.5 Volts monitor | 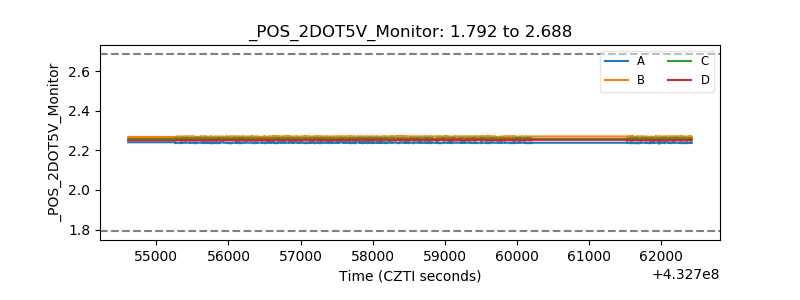 |
| +5 Volts monitor |  |
| _ROLL_ROT | 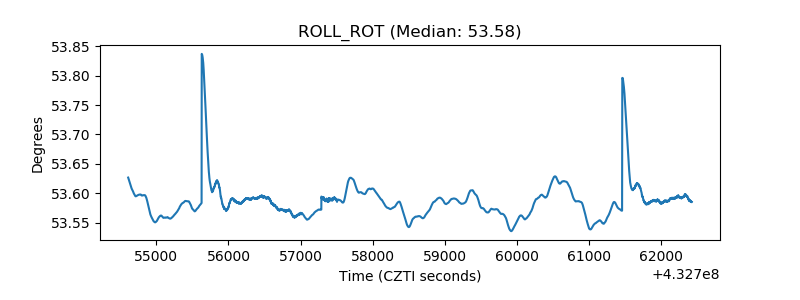 |
| _Roll_DEC | 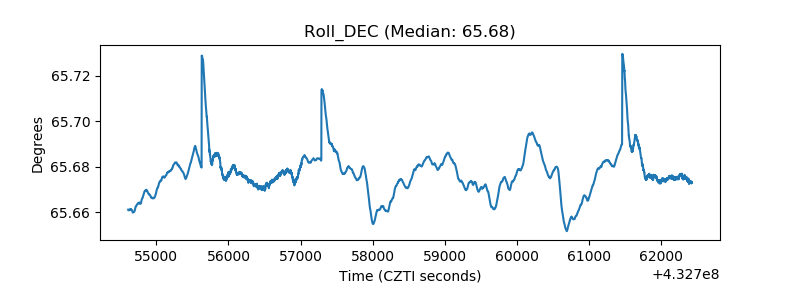 |
| _Roll_RA | 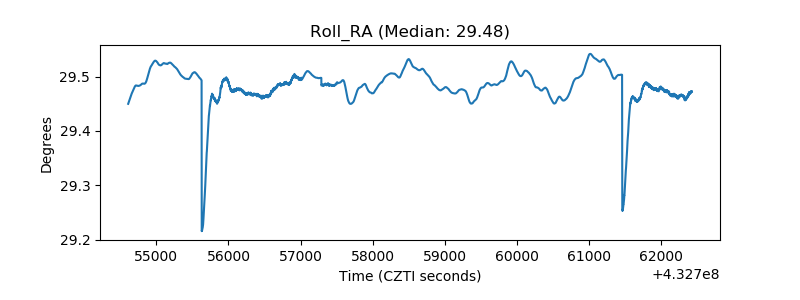 |
| Veto Counter |  |