| Param | Original file | Final file |
|---|---|---|
| Filename | modeM0/AS1T05_154T01_9000005850_43120cztM0_level2.fits | modeM0/AS1T05_154T01_9000005850_43120cztM0_level2_quad_clean.evt |
| Size (bytes) | 992,684,160 | 248,832,000 |
| Size | 946.7 MB | 237.3 MB |
| Events in quadrant A | 9,983,184 | 1,634,238 |
| Events in quadrant B | 7,023,175 | 1,686,003 |
| Events in quadrant C | 7,983,479 | 1,650,954 |
| Events in quadrant D | 10,542,790 | 1,481,639 |
| Mode M0 | |||
|---|---|---|---|
| Quadrant | BADHDUFLAG | Total packets | Discarded packets |
| A | 0 | 40094 | 4 |
| B | 0 | 32597 | 4 |
| C | 0 | 34379 | 4 |
| D | 0 | 42908 | 4 |
| Mode SS | |||
|---|---|---|---|
| Quadrant | BADHDUFLAG | Total packets | Discarded packets |
| A | 0 | 320 | 0 |
| B | 0 | 320 | 0 |
| C | 0 | 320 | 0 |
| D | 0 | 320 | 0 |
| Mode M9 | |||
|---|---|---|---|
| Quadrant | BADHDUFLAG | Total packets | Discarded packets |
| A | 0 | 50 | 0 |
| B | 0 | 51 | 0 |
| C | 0 | 51 | 0 |
| D | 0 | 51 | 0 |
| Quadrant | Total seconds | Saturated seconds | Saturation percentage |
|---|---|---|---|
| A | 15667 | 492 | 3.140359% |
| B | 15667 | 77 | 0.491479% |
| C | 15666 | 39 | 0.248947% |
| D | 15666 | 555 | 3.542704% |
Noise dominated data is calculated using 1-second bins in cleaned event files. If a bin has >2000 counts, and if more than 50% of those come from <1% of pixels, then it is considered to be noise-dominated and hence unusable.
| Quadrant | # 1 sec bins | Bins with >0 counts | Bins with >2000 counts | High rate bins dominated by noise | Noise dominated (total time) | Noise dominated (detector-on time) | Marked lightcurve |
|---|---|---|---|---|---|---|---|
| A | 19817 | 15670 | 297 | 297 | 1.50% | 1.90% | 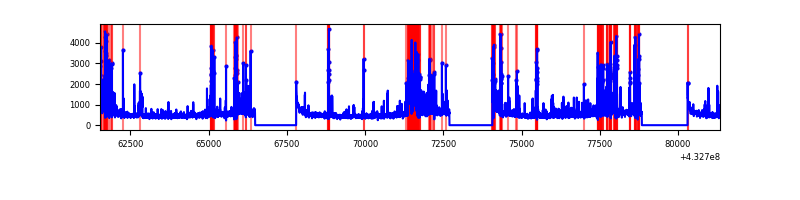 |
| B | 19817 | 15670 | 37 | 37 | 0.19% | 0.24% | 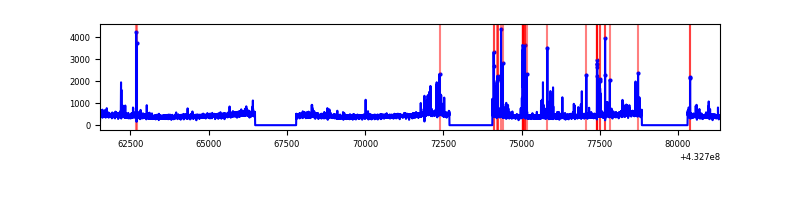 |
| C | 19816 | 15669 | 25 | 25 | 0.13% | 0.16% | 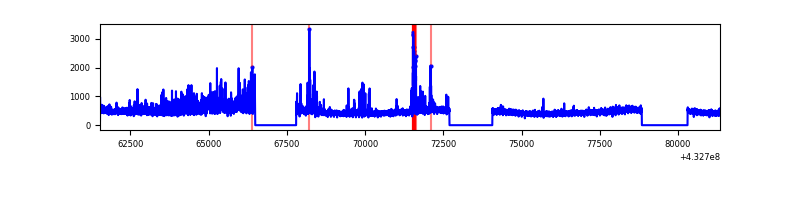 |
| D | 19816 | 15669 | 493 | 493 | 2.49% | 3.15% | 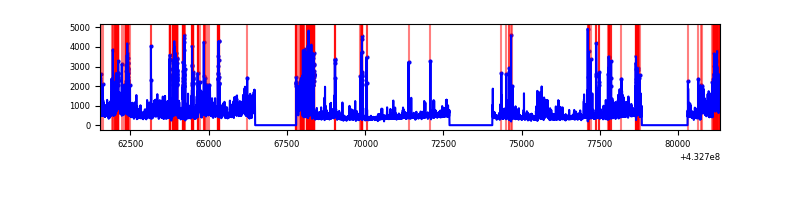 |
Top three noisy pixels from each quadrant. If the there are fewer than three noisy pixels in the level2.evt file, extra rows are filled as -1
| Pixel properties | Quadrant properties | ||||||
|---|---|---|---|---|---|---|---|
| Quadrant | DetID | PixID | Counts | Sigma | Mean | Median | Sigma |
| A | 10 | 83 | 1502545 | 4529.1 | 1630 | 1595 | 331.4 |
| A | 15 | 222 | 1140550 | 3436.78 | 1630 | 1595 | 331.4 |
| A | 15 | 237 | 841659 | 2534.88 | 1630 | 1595 | 331.4 |
| B | 5 | 255 | 284782 | 912.49 | 1631 | 1583 | 310.4 |
| B | 0 | 229 | 148876 | 474.59 | 1631 | 1583 | 310.4 |
| B | 0 | 189 | 64912 | 204.05 | 1631 | 1583 | 310.4 |
| C | 0 | 239 | 976658 | 2626.96 | 1607 | 1616 | 371.2 |
| C | 15 | 214 | 652157 | 1752.69 | 1607 | 1616 | 371.2 |
| C | 3 | 233 | 37795 | 97.47 | 1607 | 1616 | 371.2 |
| D | 1 | 52 | 3243137 | 8423.66 | 1586 | 1540 | 384.8 |
| D | 13 | 249 | 590704 | 1531.01 | 1586 | 1540 | 384.8 |
| D | 5 | 32 | 228144 | 588.86 | 1586 | 1540 | 384.8 |
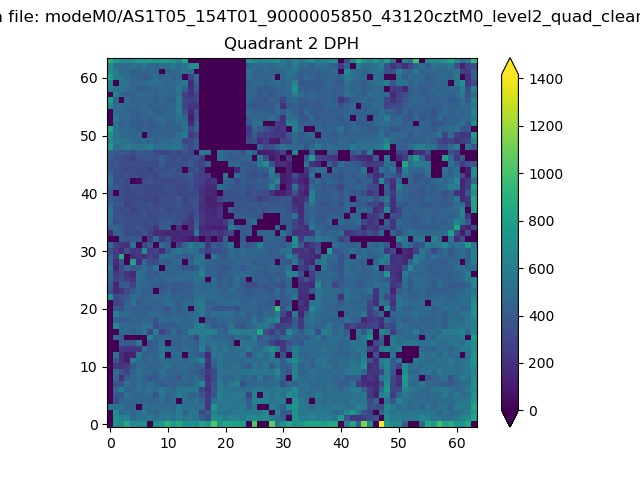
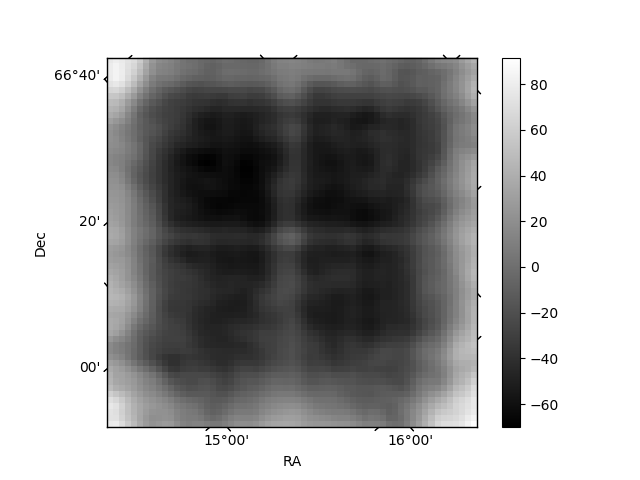
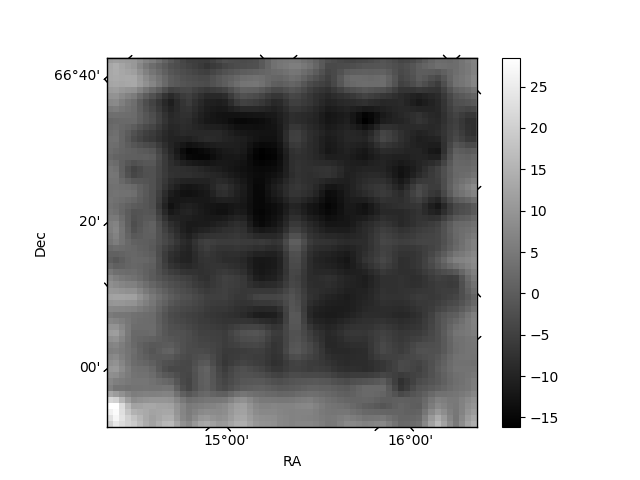
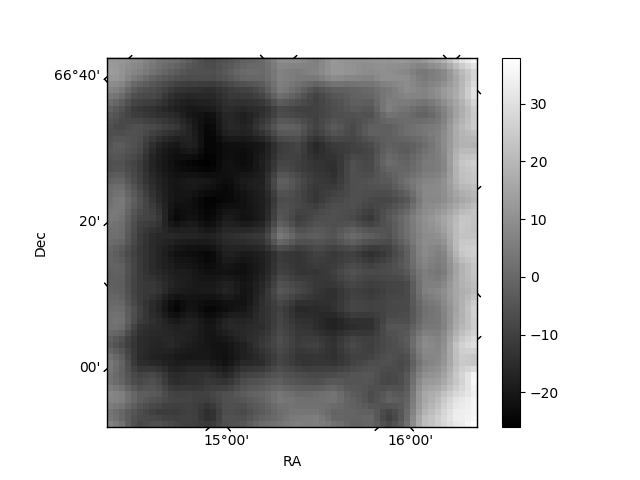
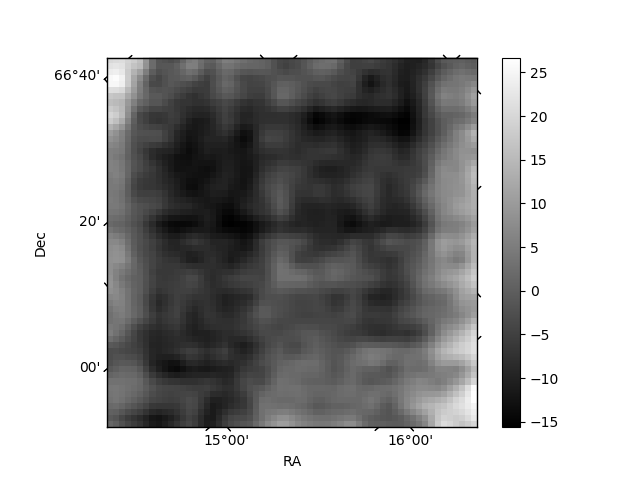
Histogram calculated using DETX and DETY for each event in the final _common_clean file
| Quadrant A | 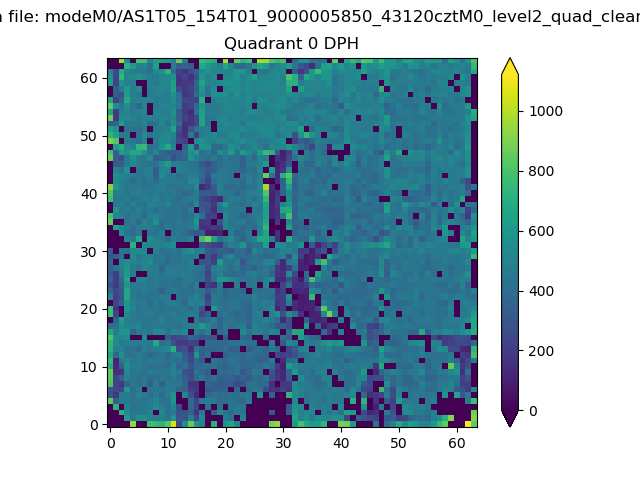 |
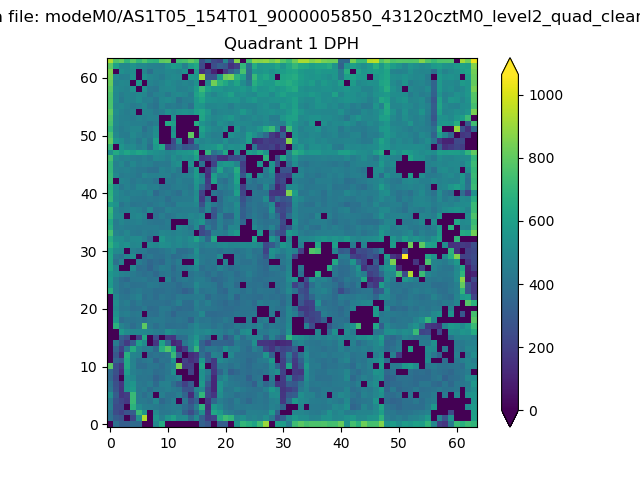 |
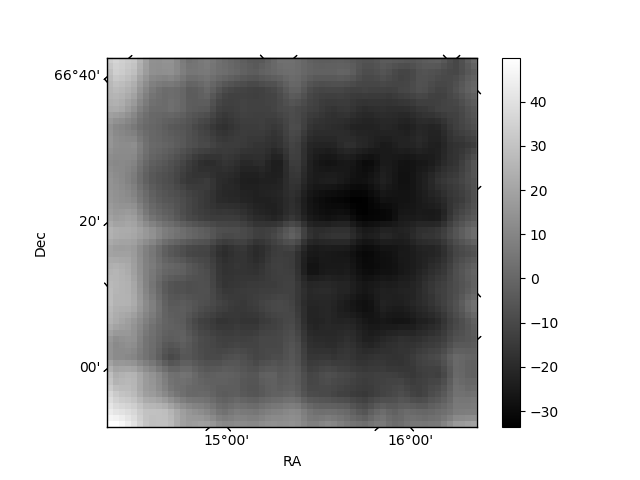
Quadrant B |
|---|---|---|---|
| Quadrant D | 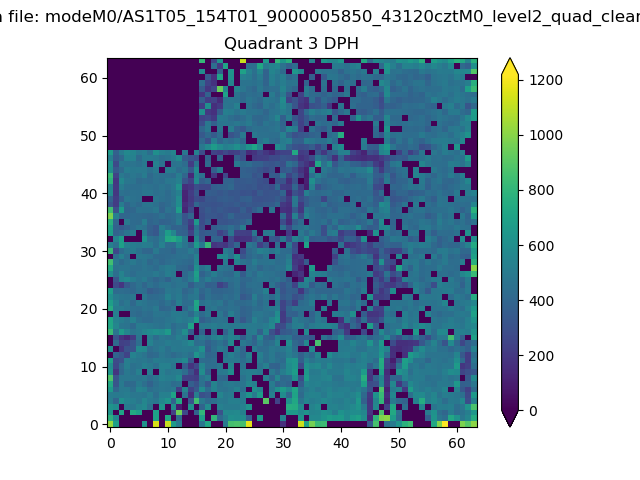 |
 |
Quadrant C |
| Plot type | Count rate plots | Images |
|---|---|---|
| Comparison with Poisson distribution Blue bars denote a histogram of data divided into 1 sec bins. Red curve is a Poisson curve with rate = median count rate of data. |
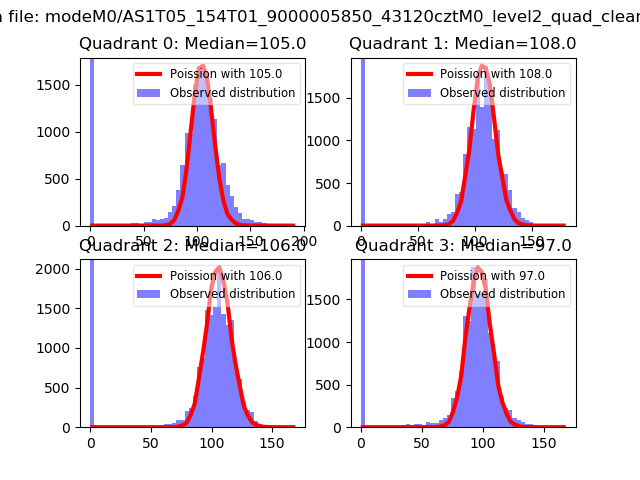 |
 |
| Quadrant-wise count rates Data is divided into 100 sec bins |
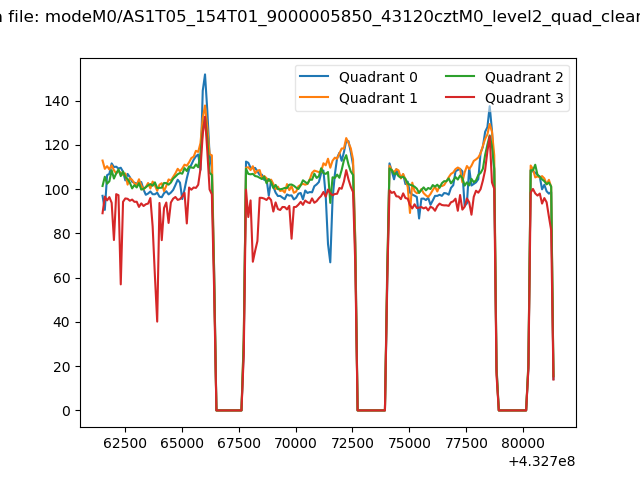 |
|
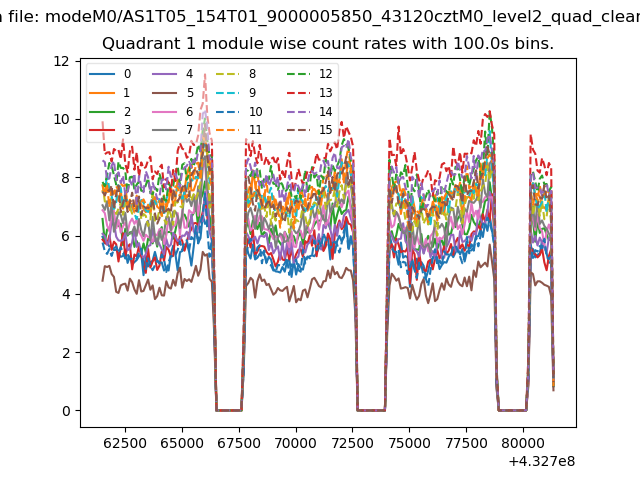
| Module-wise count rates for Quadrant A Data is divided into 100 sec bins |
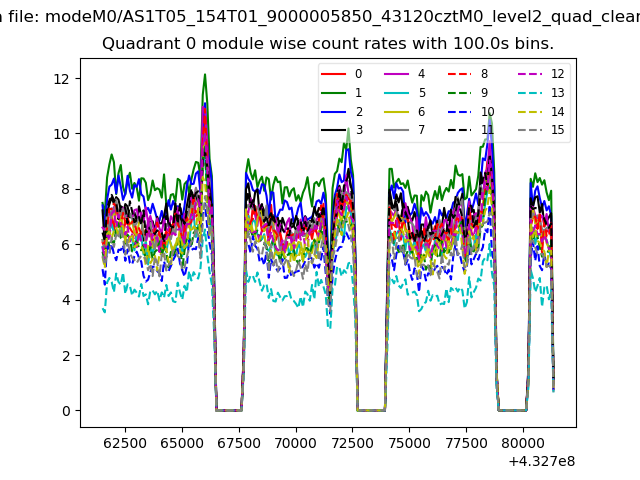 |
 |
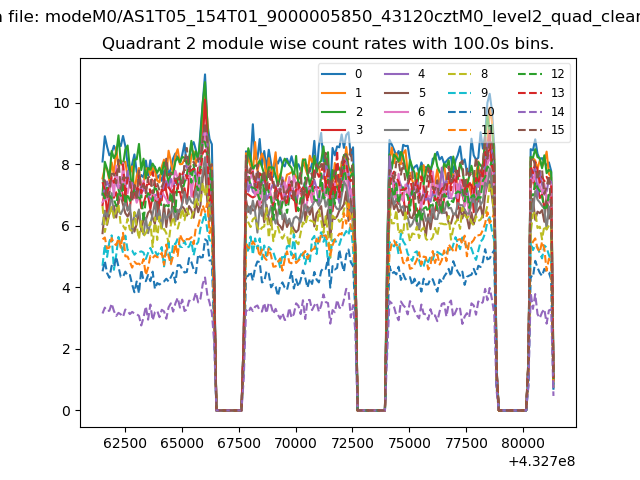
| Module-wise count rates for Quadrant B Data is divided into 100 sec bins |
 |
 |
| Module-wise count rates for Quadrant C Data is divided into 100 sec bins |
 |
 |
| Module-wise count rates for Quadrant D Data is divided into 100 sec bins |
 |
 |
| Parameter | Plot |
|---|---|
| CZT HV Monitor | 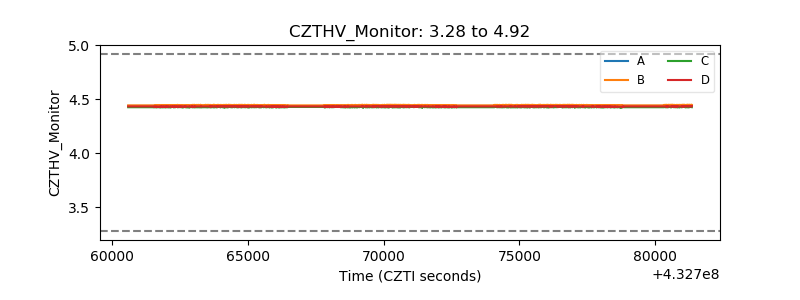 |
| D_VDD | 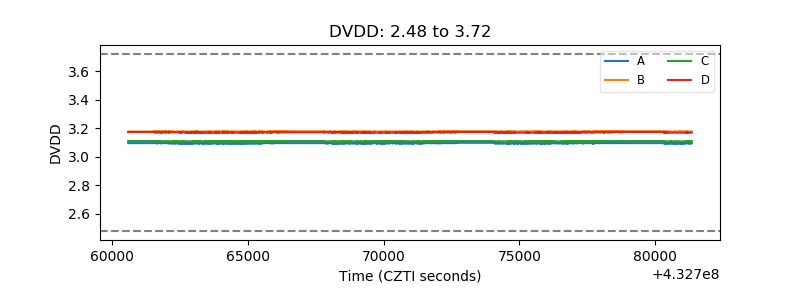 |
| Temperature 1 | 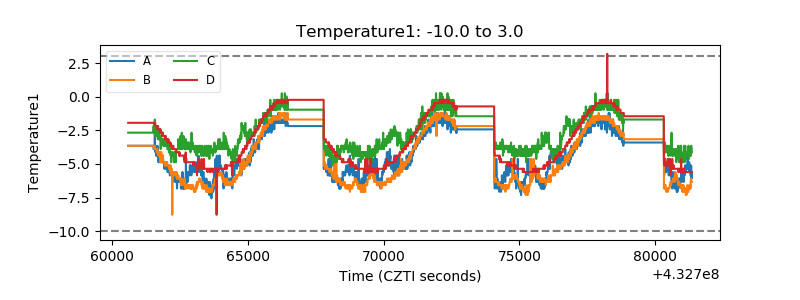 |
| Veto HV Monitor |  |
| Veto LLD | 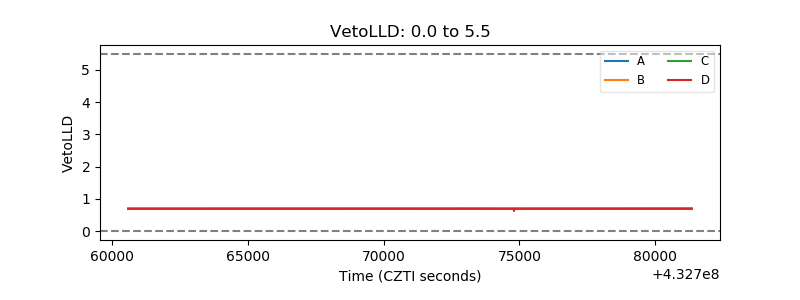 |
| Alpha Counter | 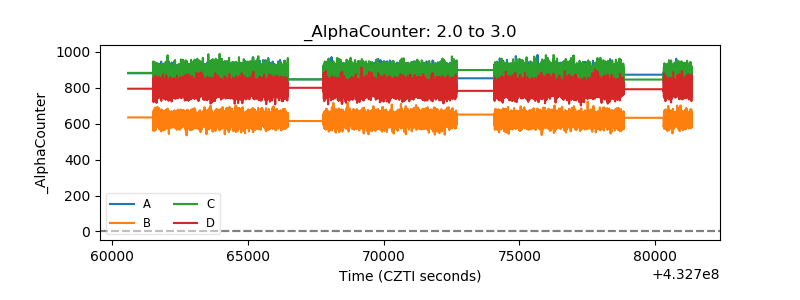 |
| _CPM_Rate | 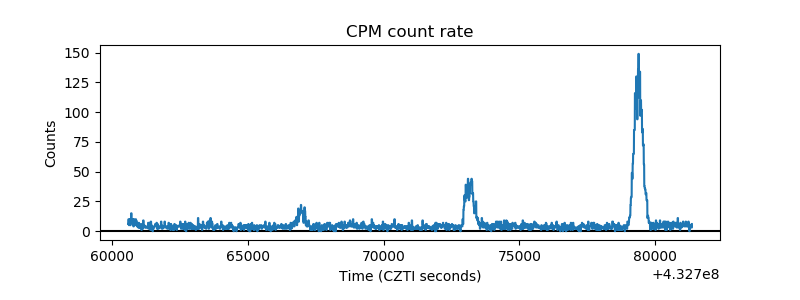 |
| CZT Counter | 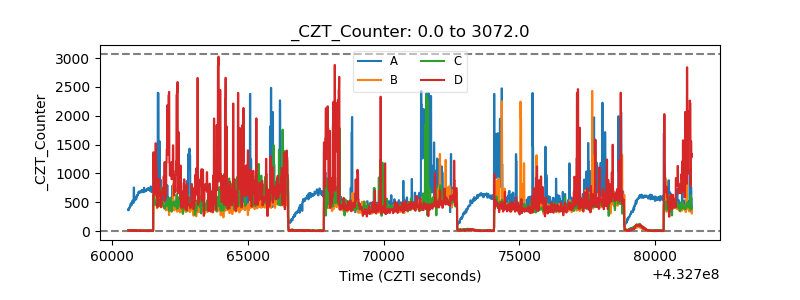 |
| +2.5 Volts monitor | 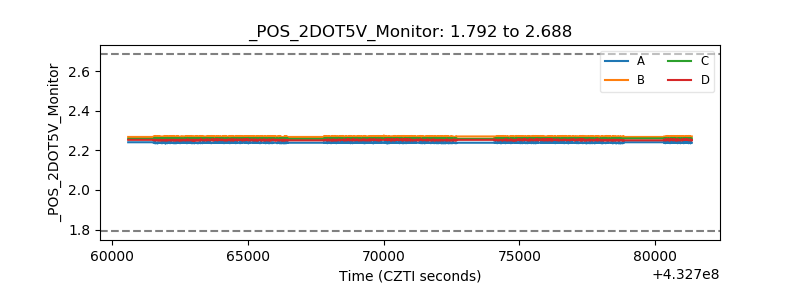 |
| +5 Volts monitor | 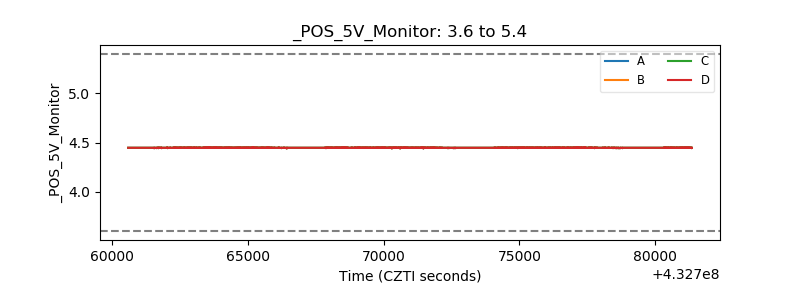 |
| _ROLL_ROT | 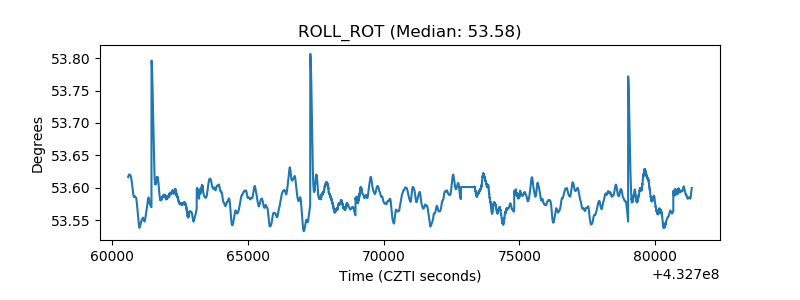 |
| _Roll_DEC | 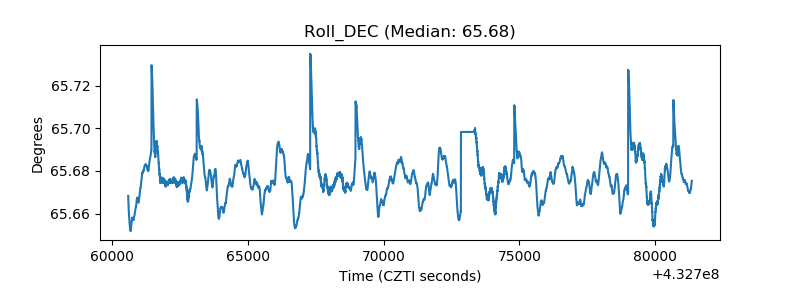 |
| _Roll_RA | 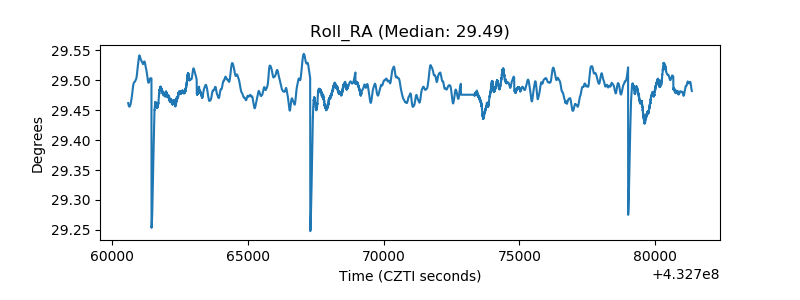 |
| Veto Counter | 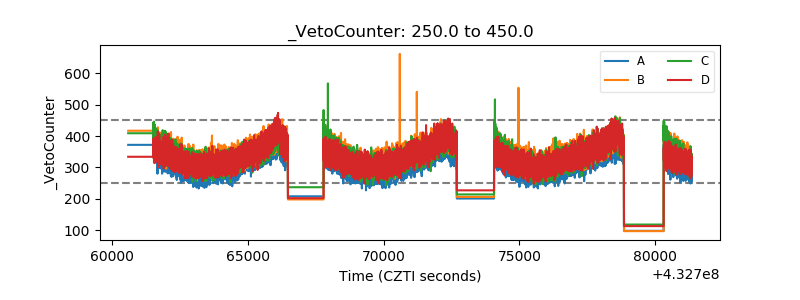 |