| Param | Original file | Final file |
|---|---|---|
| Filename | modeM0/AS1T05_154T01_9000005850_43121cztM0_level2.fits | modeM0/AS1T05_154T01_9000005850_43121cztM0_level2_quad_clean.evt |
| Size (bytes) | 384,454,080 | 94,357,440 |
| Size | 366.6 MB | 90.0 MB |
| Events in quadrant A | 3,784,891 | 623,742 |
| Events in quadrant B | 2,722,167 | 637,186 |
| Events in quadrant C | 2,830,611 | 619,638 |
| Events in quadrant D | 4,433,444 | 562,988 |
| Mode M0 | |||
|---|---|---|---|
| Quadrant | BADHDUFLAG | Total packets | Discarded packets |
| A | 0 | 15197 | 2 |
| B | 0 | 12482 | 2 |
| C | 0 | 12551 | 2 |
| D | 0 | 17332 | 2 |
| Mode SS | |||
|---|---|---|---|
| Quadrant | BADHDUFLAG | Total packets | Discarded packets |
| A | 0 | 122 | 0 |
| B | 0 | 122 | 0 |
| C | 0 | 122 | 0 |
| D | 0 | 122 | 0 |
| Mode M9 | |||
|---|---|---|---|
| Quadrant | BADHDUFLAG | Total packets | Discarded packets |
| A | 0 | 30 | 0 |
| B | 0 | 30 | 0 |
| C | 0 | 30 | 0 |
| D | 0 | 30 | 0 |
| Quadrant | Total seconds | Saturated seconds | Saturation percentage |
|---|---|---|---|
| A | 5915 | 77 | 1.301775% |
| B | 5915 | 40 | 0.676247% |
| C | 5916 | 23 | 0.388776% |
| D | 5916 | 213 | 3.600406% |
Noise dominated data is calculated using 1-second bins in cleaned event files. If a bin has >2000 counts, and if more than 50% of those come from <1% of pixels, then it is considered to be noise-dominated and hence unusable.
| Quadrant | # 1 sec bins | Bins with >0 counts | Bins with >2000 counts | High rate bins dominated by noise | Noise dominated (total time) | Noise dominated (detector-on time) | Marked lightcurve |
|---|---|---|---|---|---|---|---|
| A | 8962 | 5917 | 44 | 44 | 0.49% | 0.74% | 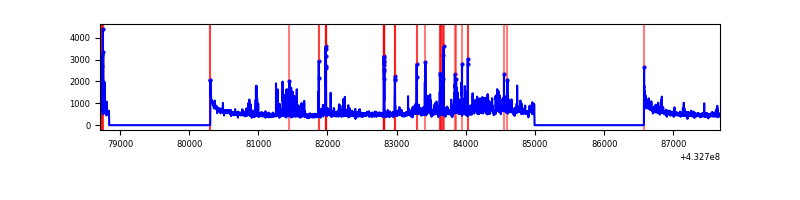 |
| B | 8962 | 5917 | 19 | 19 | 0.21% | 0.32% | 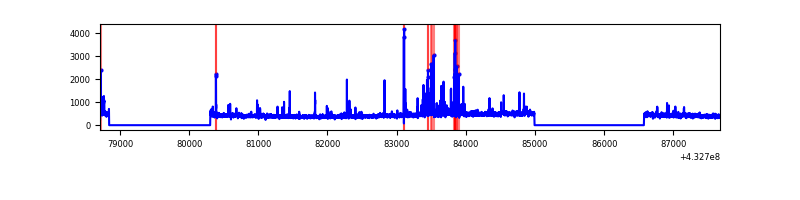 |
| C | 8963 | 5918 | 17 | 17 | 0.19% | 0.29% | 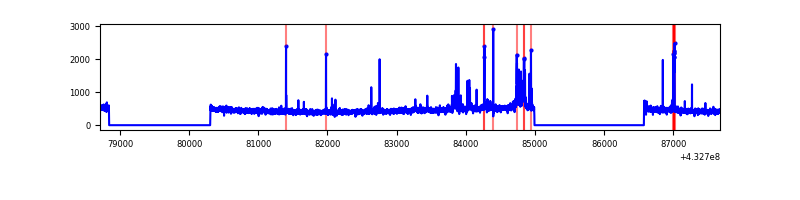 |
| D | 8963 | 5918 | 177 | 177 | 1.97% | 2.99% | 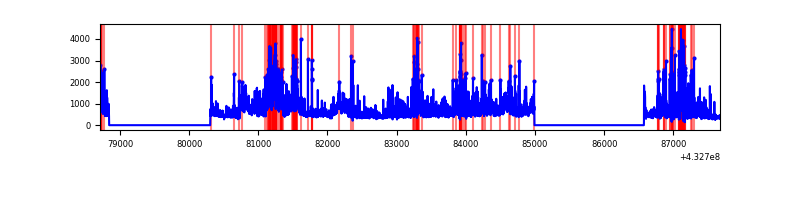 |
Top three noisy pixels from each quadrant. If the there are fewer than three noisy pixels in the level2.evt file, extra rows are filled as -1
| Pixel properties | Quadrant properties | ||||||
|---|---|---|---|---|---|---|---|
| Quadrant | DetID | PixID | Counts | Sigma | Mean | Median | Sigma |
| A | 10 | 83 | 629894 | 4935.75 | 616 | 602 | 127.5 |
| A | 15 | 222 | 403084 | 3156.81 | 616 | 602 | 127.5 |
| A | 15 | 237 | 187291 | 1464.27 | 616 | 602 | 127.5 |
| B | 0 | 189 | 176392 | 1469.15 | 614 | 596 | 119.7 |
| B | 0 | 229 | 45979 | 379.27 | 614 | 596 | 119.7 |
| B | 3 | 112 | 38660 | 318.11 | 614 | 596 | 119.7 |
| C | 15 | 214 | 250328 | 1761.75 | 603 | 606 | 141.7 |
| C | 3 | 233 | 135960 | 954.9 | 603 | 606 | 141.7 |
| C | 14 | 254 | 75497 | 528.34 | 603 | 606 | 141.7 |
| D | 1 | 52 | 1707537 | 11810.6 | 594 | 575 | 144.5 |
| D | 13 | 171 | 275606 | 1902.96 | 594 | 575 | 144.5 |
| D | 13 | 249 | 35187 | 239.48 | 594 | 575 | 144.5 |
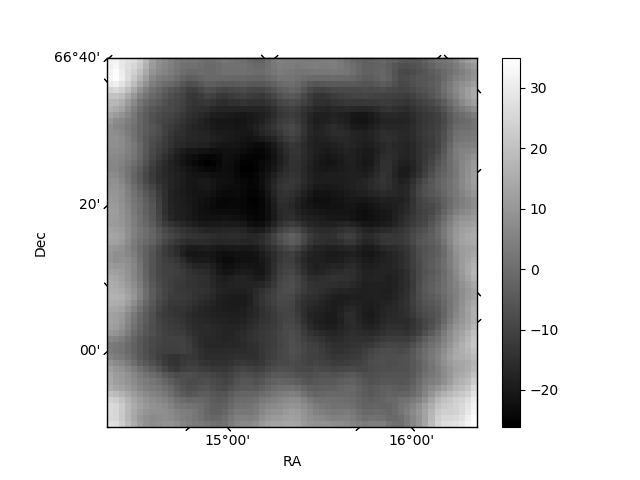
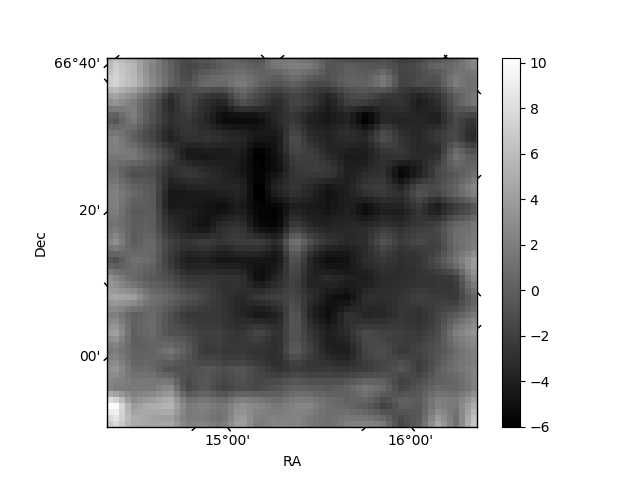
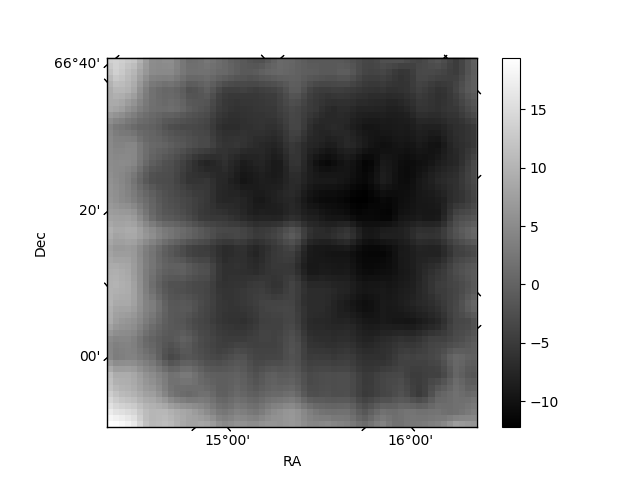
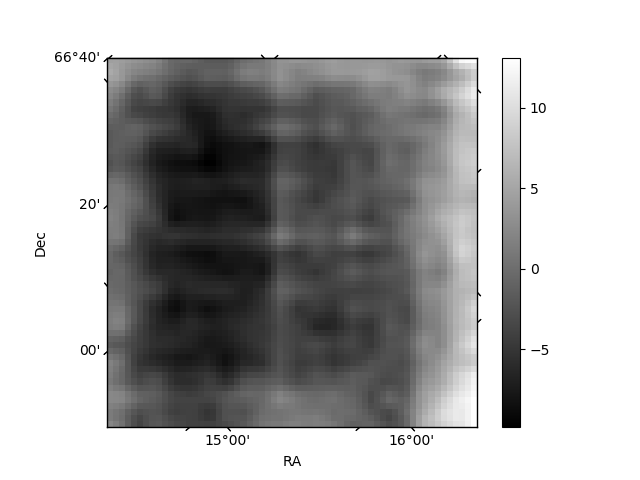
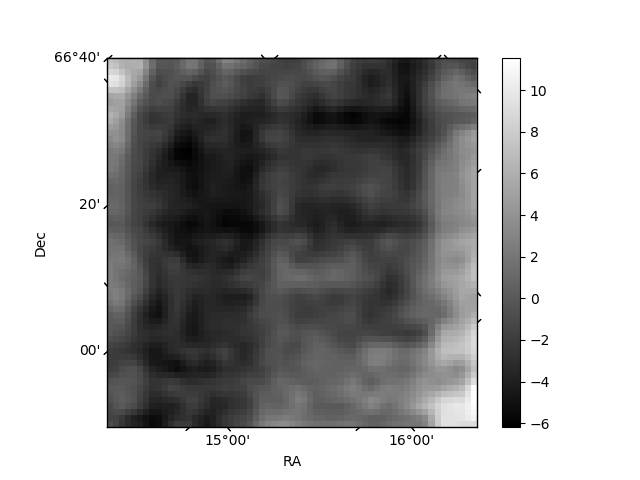
Histogram calculated using DETX and DETY for each event in the final _common_clean file
| Quadrant A | 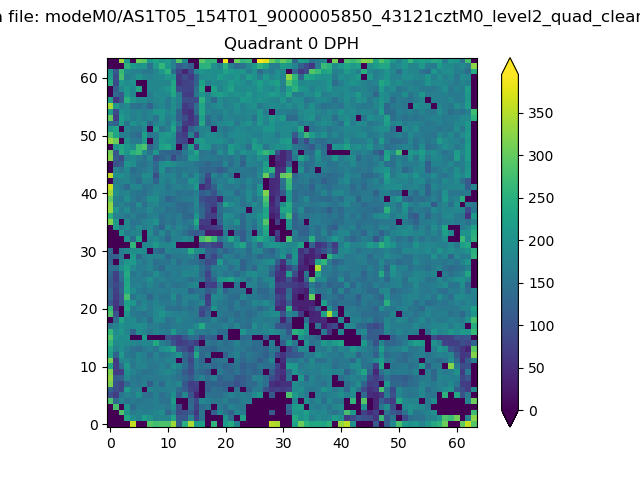 |
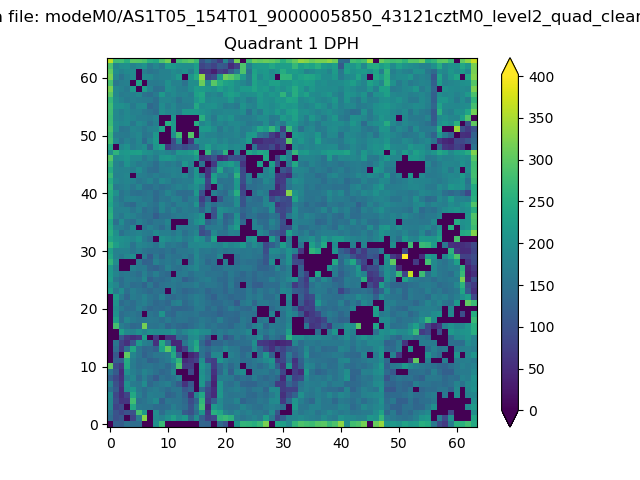 |
Quadrant B |
|---|---|---|---|
| Quadrant D | 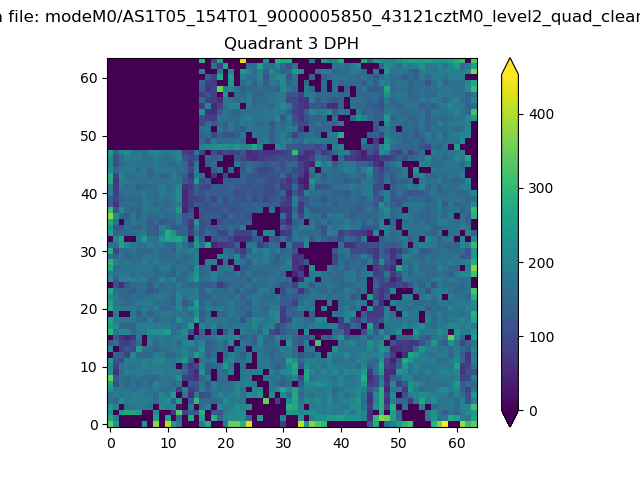 |
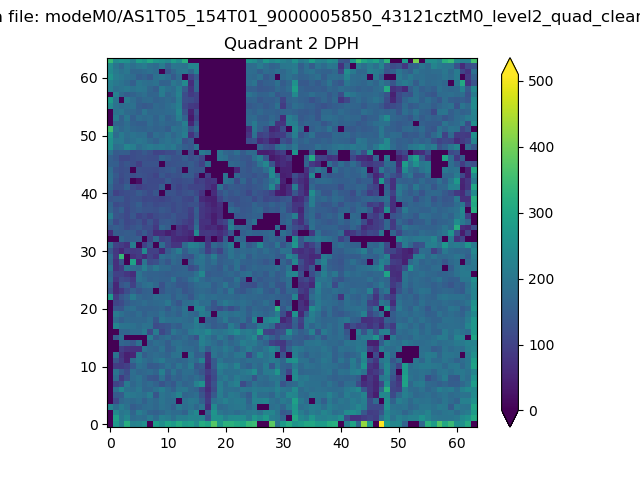 |
Quadrant C |
| Plot type | Count rate plots | Images |
|---|---|---|
| Comparison with Poisson distribution Blue bars denote a histogram of data divided into 1 sec bins. Red curve is a Poisson curve with rate = median count rate of data. |
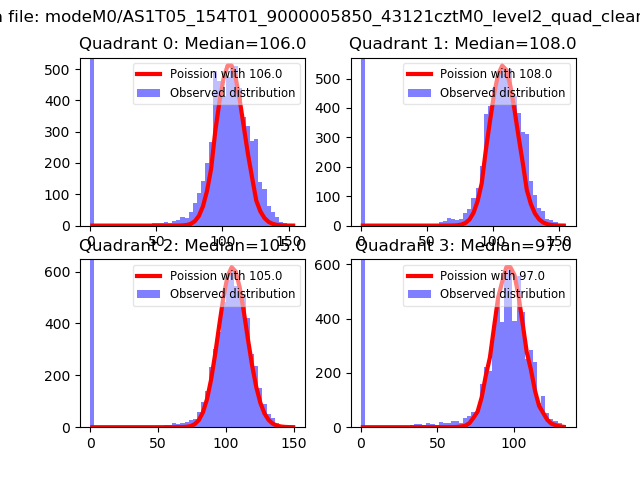 |
 |
| Quadrant-wise count rates Data is divided into 100 sec bins |
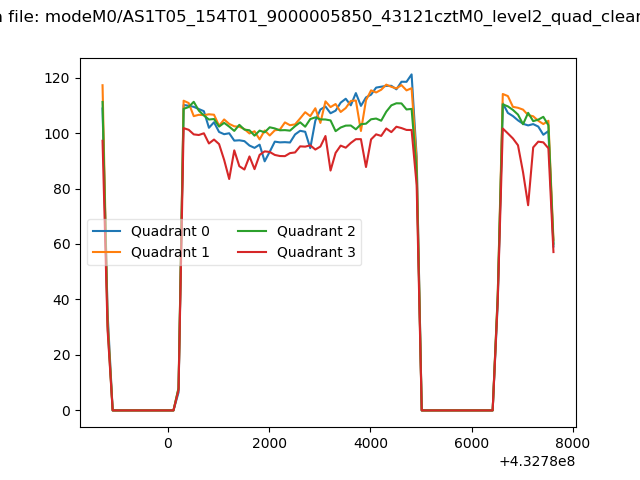 |
|
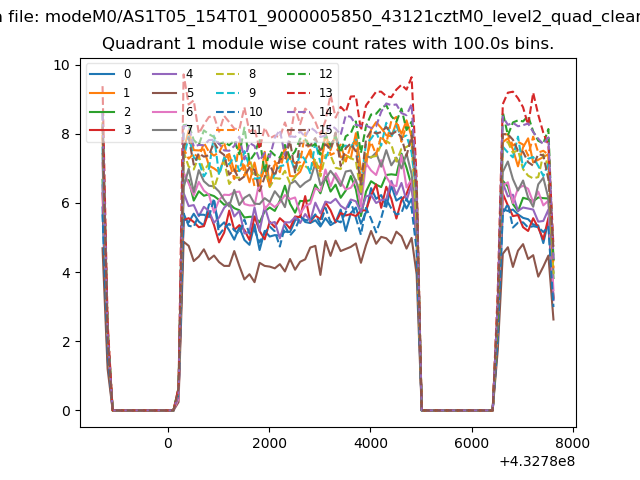
| Module-wise count rates for Quadrant A Data is divided into 100 sec bins |
 |
 |
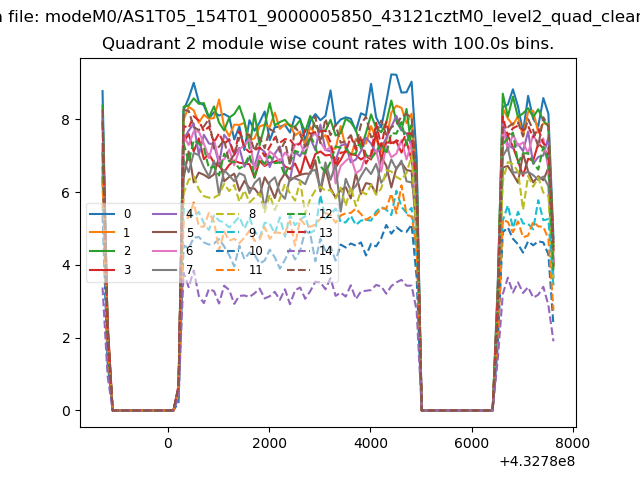
| Module-wise count rates for Quadrant B Data is divided into 100 sec bins |
 |
 |
| Module-wise count rates for Quadrant C Data is divided into 100 sec bins |
 |
 |
| Module-wise count rates for Quadrant D Data is divided into 100 sec bins |
 |
 |
| Parameter | Plot |
|---|---|
| CZT HV Monitor | 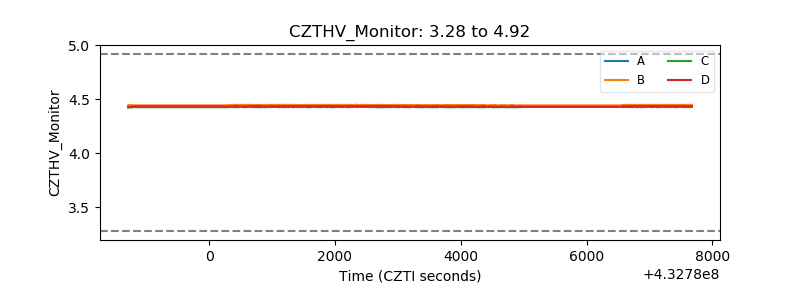 |
| D_VDD | 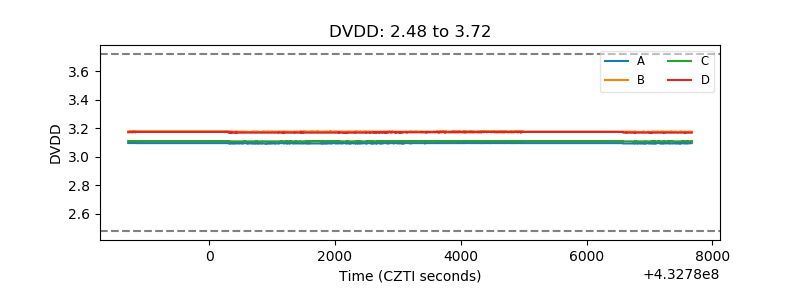 |
| Temperature 1 | 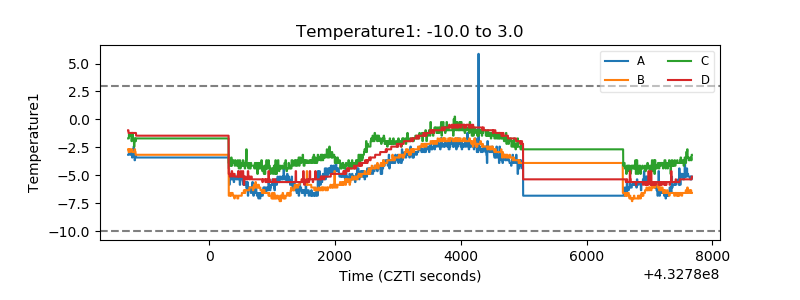 |
| Veto HV Monitor | 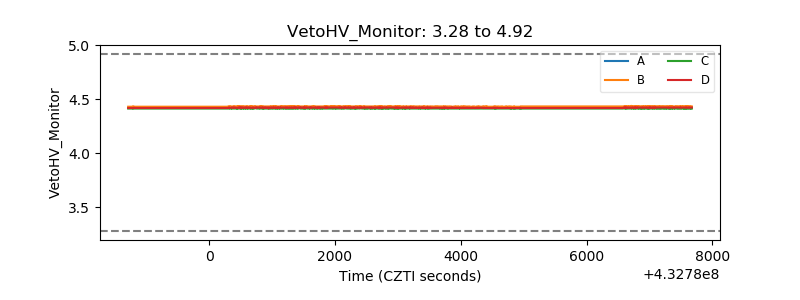 |
| Veto LLD | 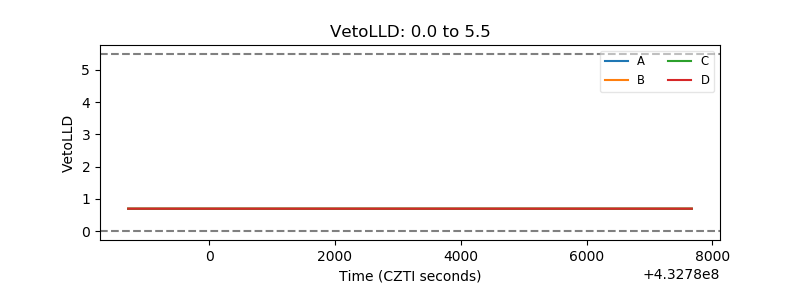 |
| Alpha Counter | 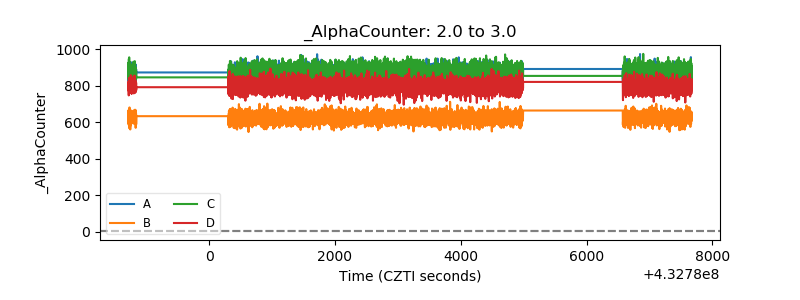 |
| _CPM_Rate | 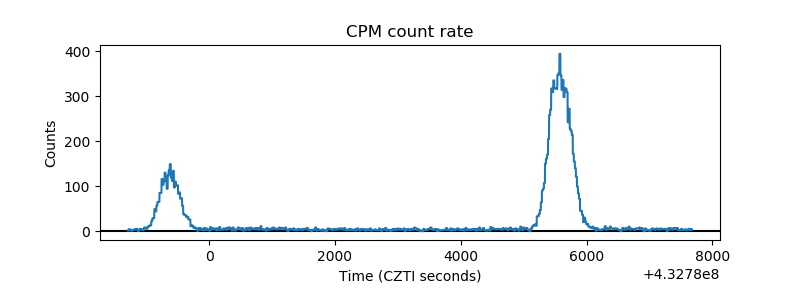 |
| CZT Counter | 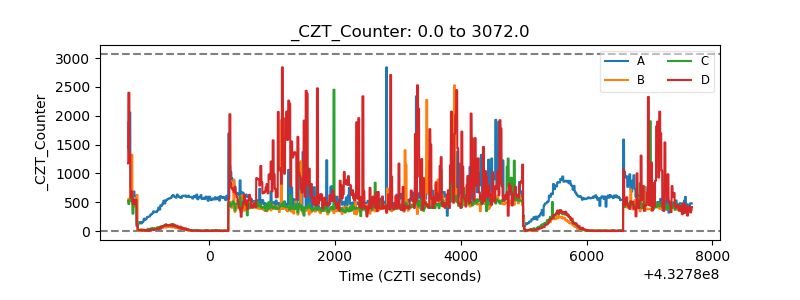 |
| +2.5 Volts monitor |  |
| +5 Volts monitor |  |
| _ROLL_ROT | 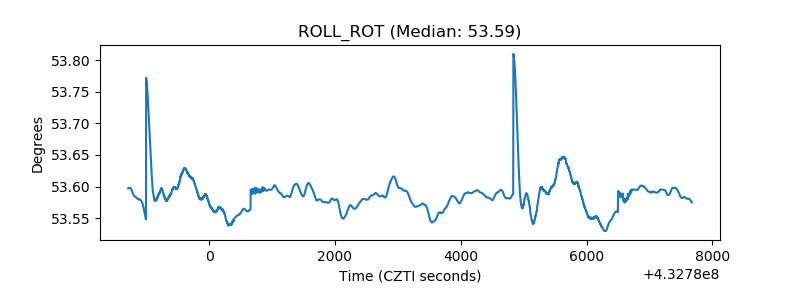 |
| _Roll_DEC | 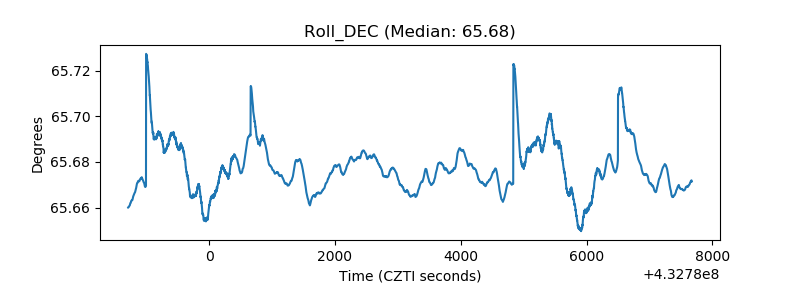 |
| _Roll_RA | 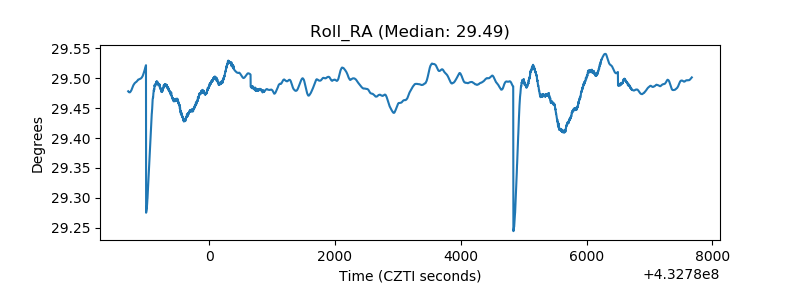 |
| Veto Counter | 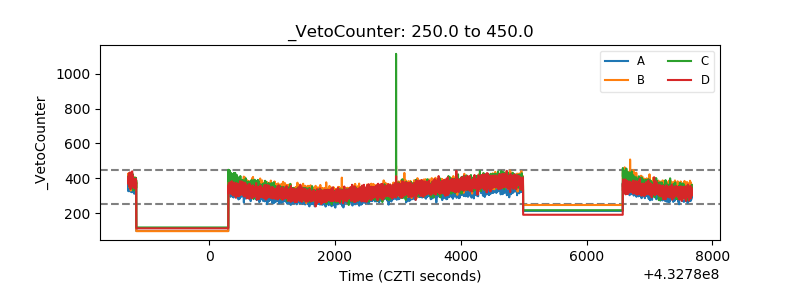 |