| Param | Original file | Final file |
|---|---|---|
| Filename | modeM0/AS1T05_154T01_9000005850_43123cztM0_level2.fits | modeM0/AS1T05_154T01_9000005850_43123cztM0_level2_quad_clean.evt |
| Size (bytes) | 403,744,320 | 86,929,920 |
| Size | 385.0 MB | 82.9 MB |
| Events in quadrant A | 5,815,179 | 480,786 |
| Events in quadrant B | 2,422,659 | 619,865 |
| Events in quadrant C | 2,545,891 | 599,104 |
| Events in quadrant D | 3,726,025 | 541,189 |
| Mode M0 | |||
|---|---|---|---|
| Quadrant | BADHDUFLAG | Total packets | Discarded packets |
| A | 0 | 21009 | 2 |
| B | 0 | 11333 | 2 |
| C | 0 | 11429 | 2 |
| D | 0 | 15038 | 2 |
| Mode SS | |||
|---|---|---|---|
| Quadrant | BADHDUFLAG | Total packets | Discarded packets |
| A | 0 | 116 | 0 |
| B | 0 | 116 | 0 |
| C | 0 | 116 | 0 |
| D | 0 | 116 | 0 |
| Mode M9 | |||
|---|---|---|---|
| Quadrant | BADHDUFLAG | Total packets | Discarded packets |
| A | 0 | 33 | 0 |
| B | 0 | 33 | 0 |
| C | 0 | 33 | 0 |
| D | 0 | 33 | 0 |
| Quadrant | Total seconds | Saturated seconds | Saturation percentage |
|---|---|---|---|
| A | 5592 | 1212 | 21.673820% |
| B | 5592 | 10 | 0.178827% |
| C | 5593 | 14 | 0.250313% |
| D | 5593 | 200 | 3.575898% |
Noise dominated data is calculated using 1-second bins in cleaned event files. If a bin has >2000 counts, and if more than 50% of those come from <1% of pixels, then it is considered to be noise-dominated and hence unusable.
| Quadrant | # 1 sec bins | Bins with >0 counts | Bins with >2000 counts | High rate bins dominated by noise | Noise dominated (total time) | Noise dominated (detector-on time) | Marked lightcurve |
|---|---|---|---|---|---|---|---|
| A | 8909 | 5594 | 976 | 976 | 10.96% | 17.45% | 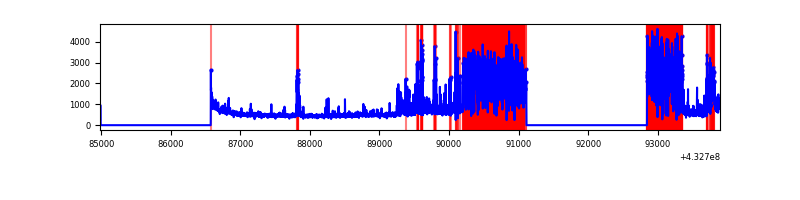 |
| B | 8909 | 5594 | 3 | 3 | 0.03% | 0.05% | 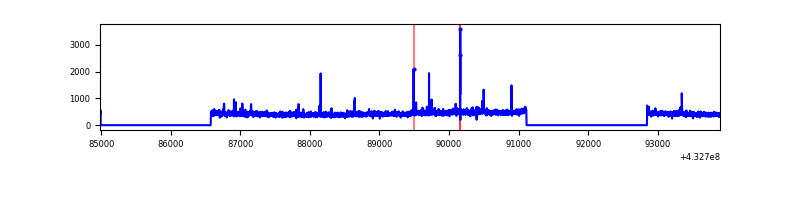 |
| C | 8910 | 5595 | 10 | 10 | 0.11% | 0.18% | 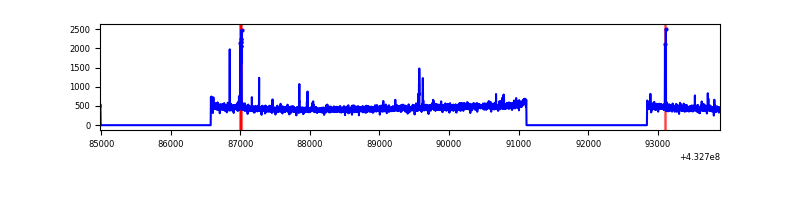 |
| D | 8910 | 5595 | 127 | 127 | 1.43% | 2.27% | 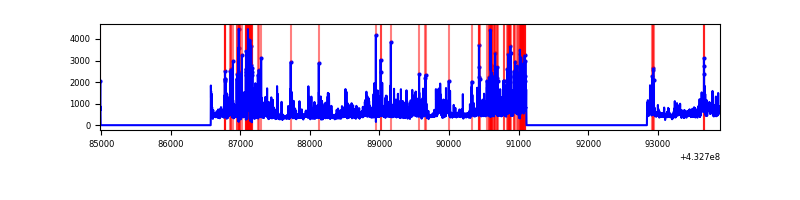 |
Top three noisy pixels from each quadrant. If the there are fewer than three noisy pixels in the level2.evt file, extra rows are filled as -1
| Pixel properties | Quadrant properties | ||||||
|---|---|---|---|---|---|---|---|
| Quadrant | DetID | PixID | Counts | Sigma | Mean | Median | Sigma |
| A | 15 | 222 | 2824095 | 26074.55 | 530 | 518 | 108.3 |
| A | 10 | 83 | 506444 | 4672.01 | 530 | 518 | 108.3 |
| A | 15 | 237 | 417581 | 3851.4 | 530 | 518 | 108.3 |
| B | 0 | 229 | 41308 | 357.2 | 584 | 566 | 114.1 |
| B | 0 | 189 | 31328 | 269.7 | 584 | 566 | 114.1 |
| B | 5 | 255 | 26580 | 228.07 | 584 | 566 | 114.1 |
| C | 15 | 214 | 233751 | 1730.61 | 572 | 575 | 134.7 |
| C | 3 | 233 | 41323 | 302.43 | 572 | 575 | 134.7 |
| C | 14 | 254 | 20433 | 147.38 | 572 | 575 | 134.7 |
| D | 1 | 52 | 1450687 | 10534.93 | 565 | 550 | 137.7 |
| D | 2 | 249 | 26389 | 187.71 | 565 | 550 | 137.7 |
| D | 2 | 234 | 25550 | 181.62 | 565 | 550 | 137.7 |
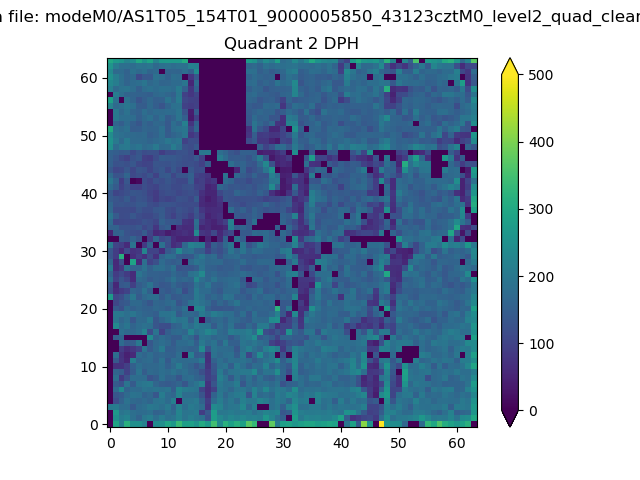
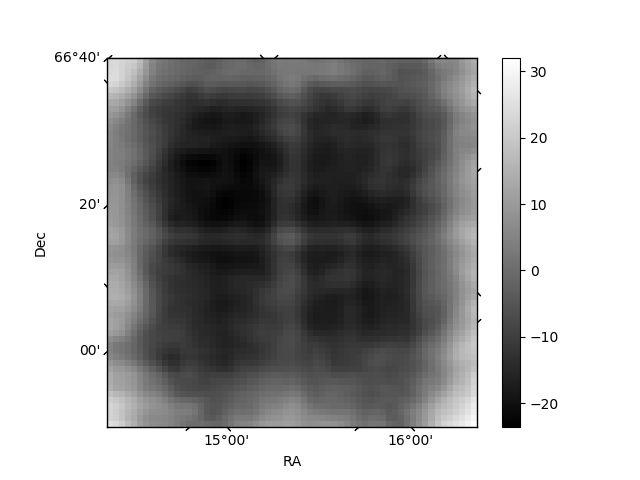
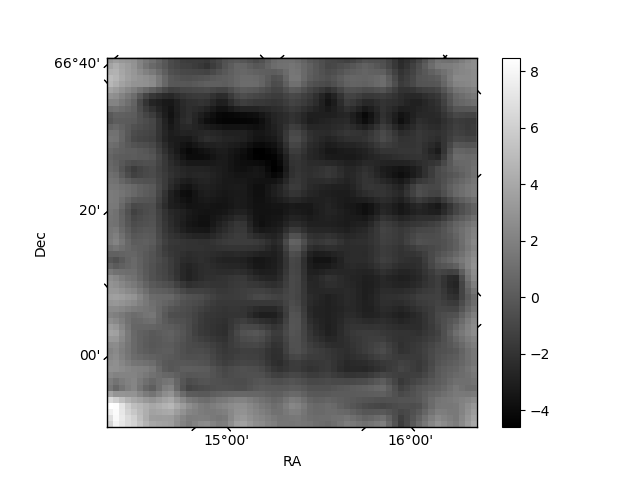
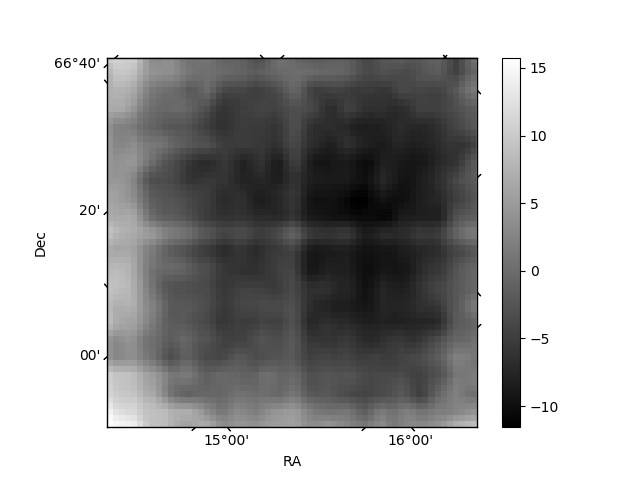
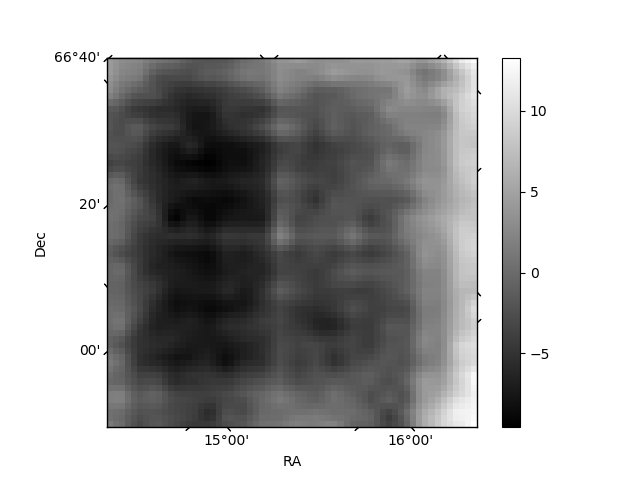
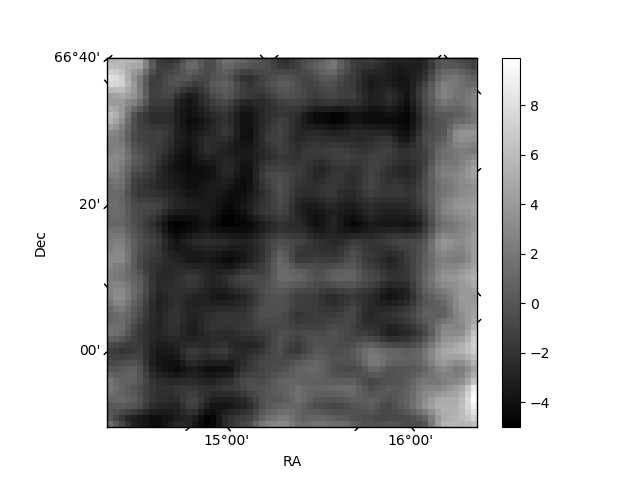
Histogram calculated using DETX and DETY for each event in the final _common_clean file
| Quadrant A | 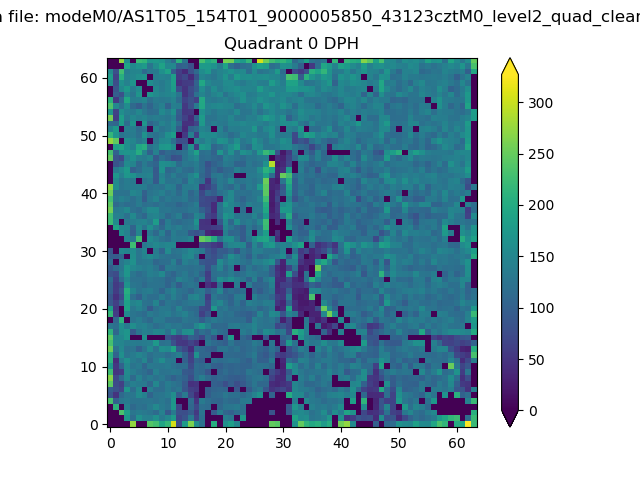 |
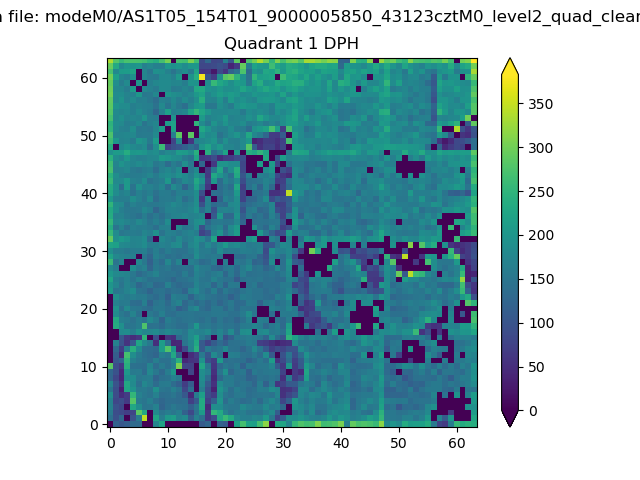 |
Quadrant B |
|---|---|---|---|
| Quadrant D | 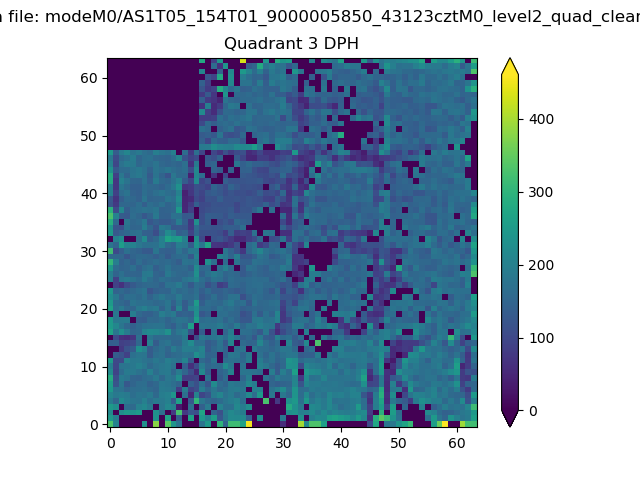 |
 |
Quadrant C |
| Plot type | Count rate plots | Images |
|---|---|---|
| Comparison with Poisson distribution Blue bars denote a histogram of data divided into 1 sec bins. Red curve is a Poisson curve with rate = median count rate of data. |
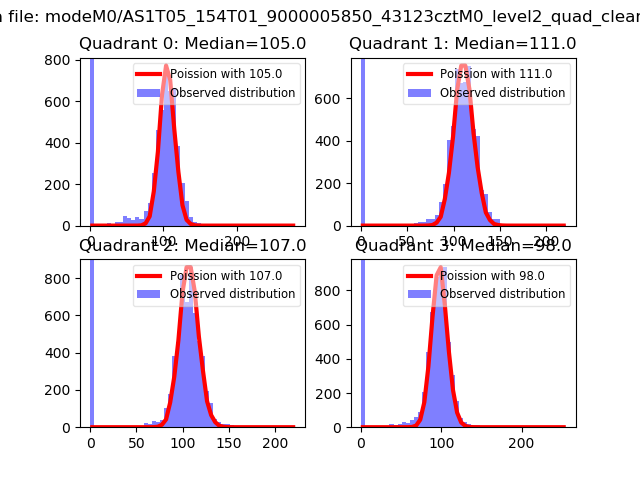 |
 |
| Quadrant-wise count rates Data is divided into 100 sec bins |
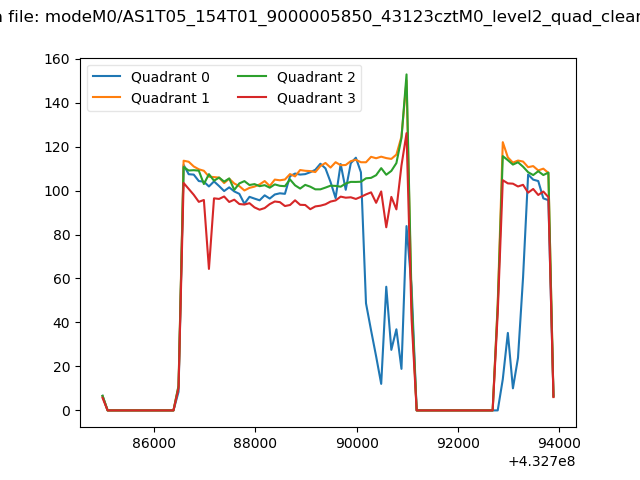 |
|
| Module-wise count rates for Quadrant A Data is divided into 100 sec bins |
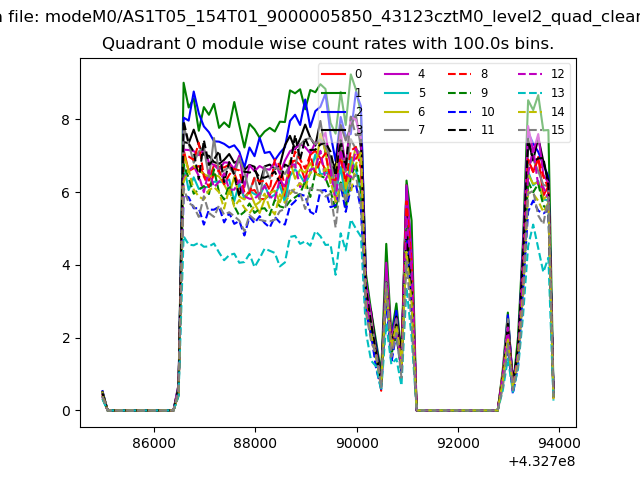 |
 |
| Module-wise count rates for Quadrant B Data is divided into 100 sec bins |
 |
 |
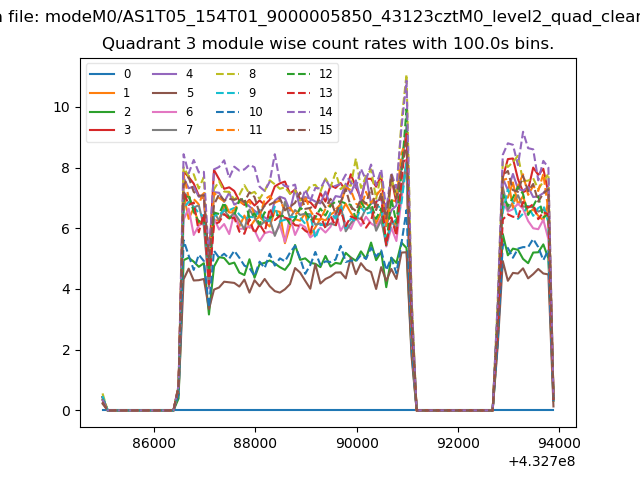
| Module-wise count rates for Quadrant C Data is divided into 100 sec bins |
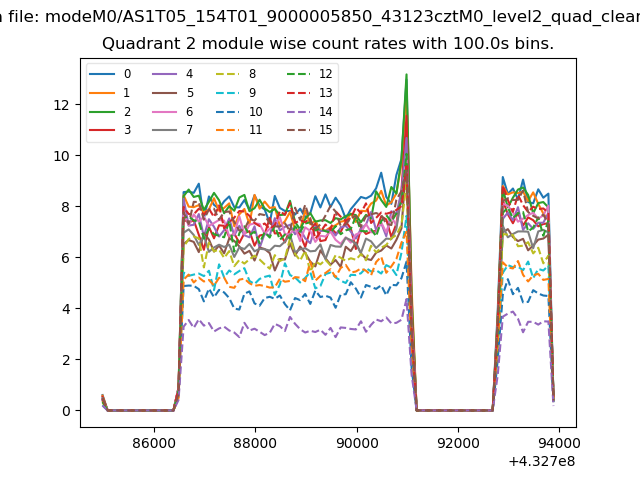 |
 |
| Module-wise count rates for Quadrant D Data is divided into 100 sec bins |
 |
 |
| Parameter | Plot |
|---|---|
| CZT HV Monitor | 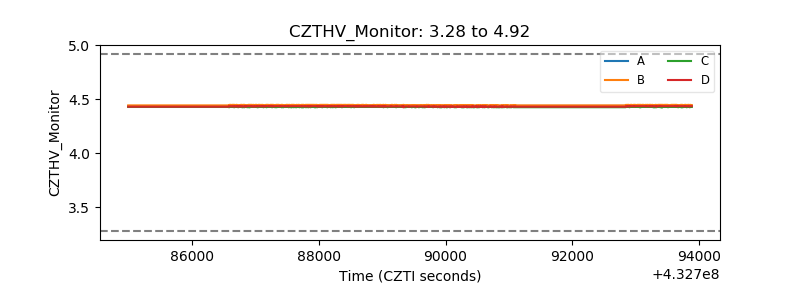 |
| D_VDD | 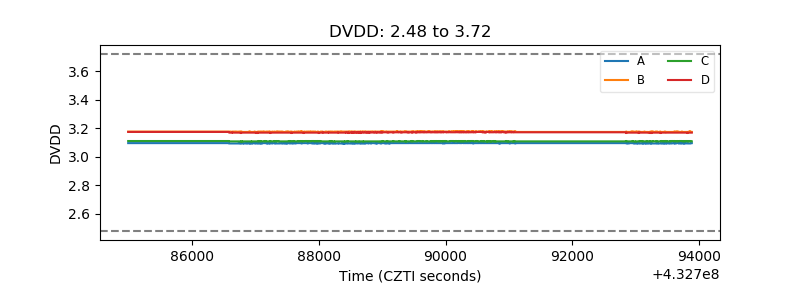 |
| Temperature 1 | 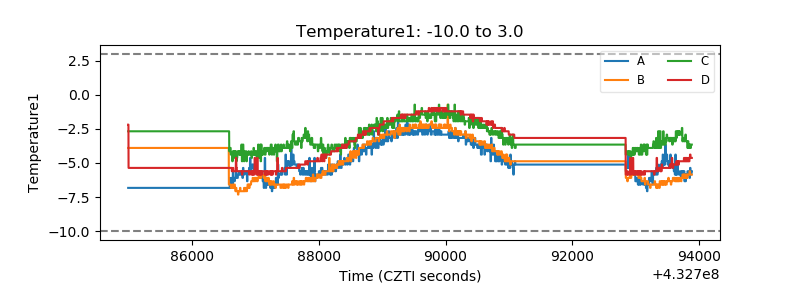 |
| Veto HV Monitor | 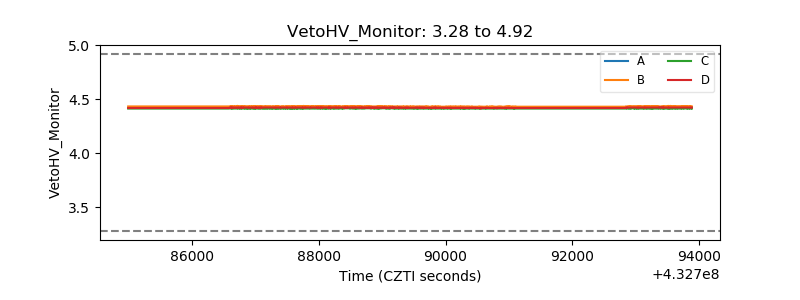 |
| Veto LLD | 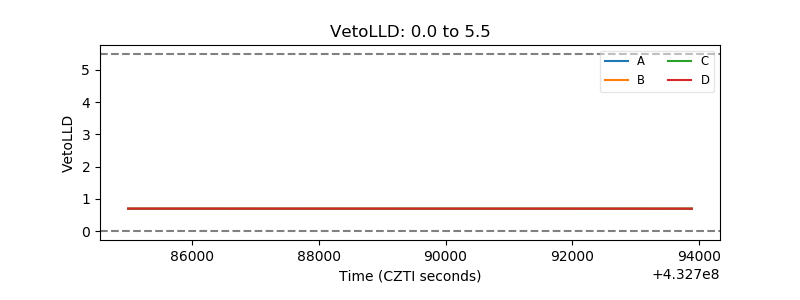 |
| Alpha Counter | 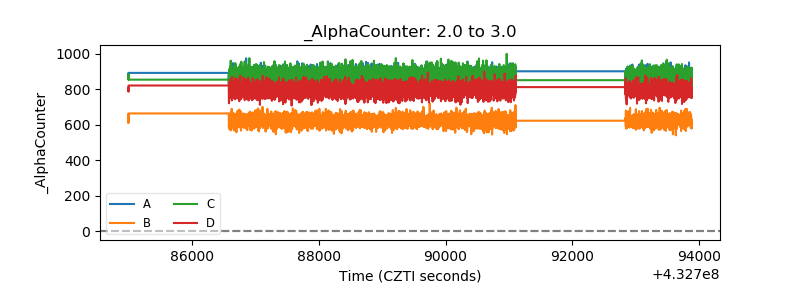 |
| _CPM_Rate | 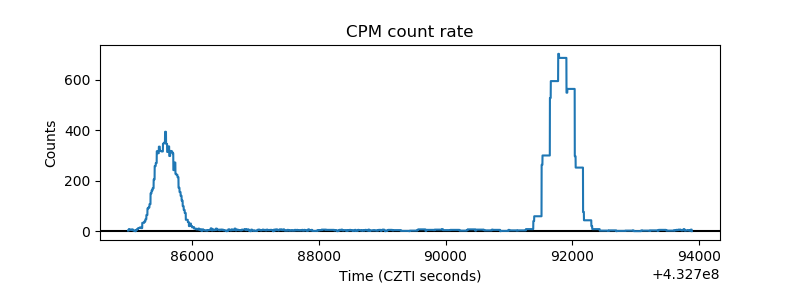 |
| CZT Counter | 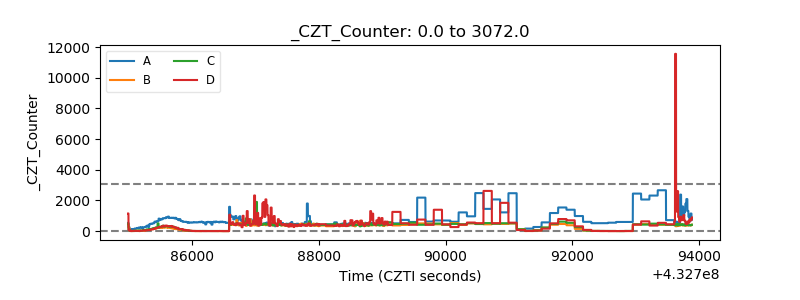 |
| +2.5 Volts monitor | 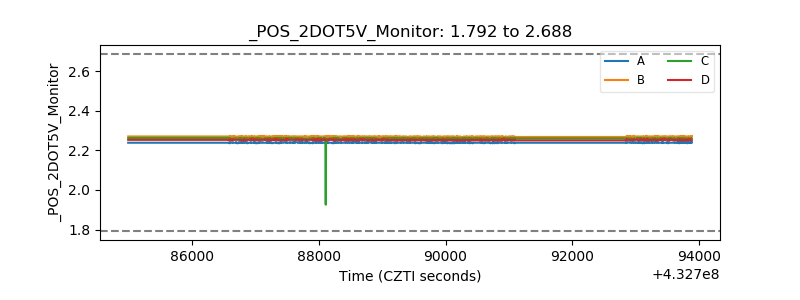 |
| +5 Volts monitor | 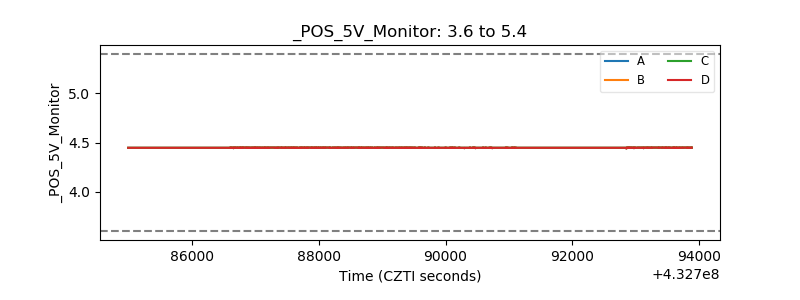 |
| _ROLL_ROT | 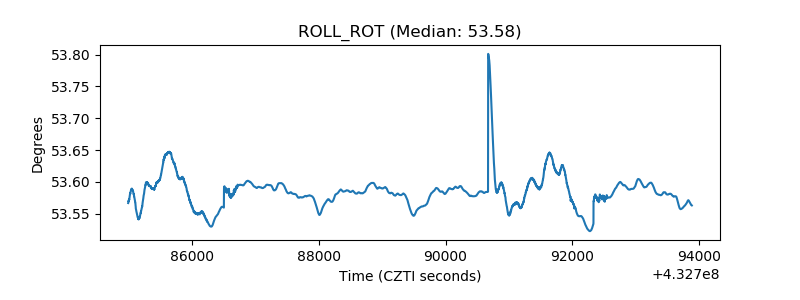 |
| _Roll_DEC | 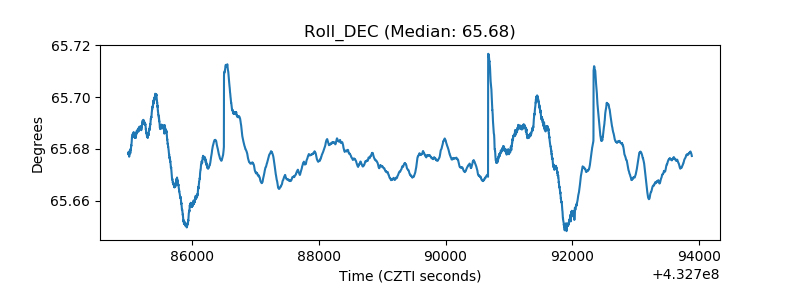 |
| _Roll_RA | 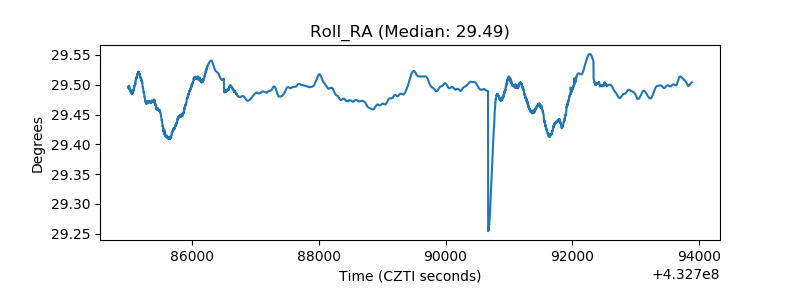 |
| Veto Counter | 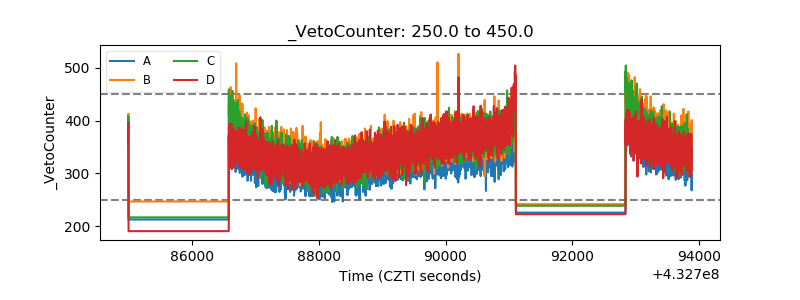 |