| Param | Original file | Final file |
|---|---|---|
| Filename | modeM0/AS1T05_154T01_9000005850_43124cztM0_level2.fits | modeM0/AS1T05_154T01_9000005850_43124cztM0_level2_quad_clean.evt |
| Size (bytes) | 410,279,040 | 81,774,720 |
| Size | 391.3 MB | 78.0 MB |
| Events in quadrant A | 5,230,775 | 487,352 |
| Events in quadrant B | 2,338,590 | 585,693 |
| Events in quadrant C | 2,347,956 | 558,021 |
| Events in quadrant D | 4,867,432 | 482,496 |
| Mode M0 | |||
|---|---|---|---|
| Quadrant | BADHDUFLAG | Total packets | Discarded packets |
| A | 0 | 18972 | 2 |
| B | 0 | 10720 | 2 |
| C | 0 | 10436 | 2 |
| D | 0 | 18028 | 2 |
| Mode SS | |||
|---|---|---|---|
| Quadrant | BADHDUFLAG | Total packets | Discarded packets |
| A | 0 | 106 | 0 |
| B | 0 | 106 | 0 |
| C | 0 | 106 | 0 |
| D | 0 | 106 | 0 |
| Mode M9 | |||
|---|---|---|---|
| Quadrant | BADHDUFLAG | Total packets | Discarded packets |
| A | 0 | 19 | 0 |
| B | 0 | 19 | 0 |
| C | 0 | 19 | 0 |
| D | 0 | 19 | 0 |
| Quadrant | Total seconds | Saturated seconds | Saturation percentage |
|---|---|---|---|
| A | 5170 | 900 | 17.408124% |
| B | 5170 | 33 | 0.638298% |
| C | 5170 | 3 | 0.058027% |
| D | 5171 | 429 | 8.296268% |
Noise dominated data is calculated using 1-second bins in cleaned event files. If a bin has >2000 counts, and if more than 50% of those come from <1% of pixels, then it is considered to be noise-dominated and hence unusable.
| Quadrant | # 1 sec bins | Bins with >0 counts | Bins with >2000 counts | High rate bins dominated by noise | Noise dominated (total time) | Noise dominated (detector-on time) | Marked lightcurve |
|---|---|---|---|---|---|---|---|
| A | 7054 | 5171 | 711 | 711 | 10.08% | 13.75% | 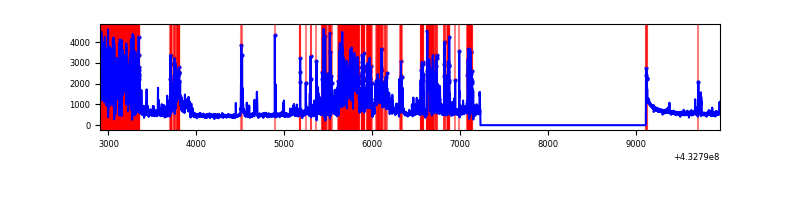 |
| B | 7054 | 5171 | 19 | 19 | 0.27% | 0.37% | 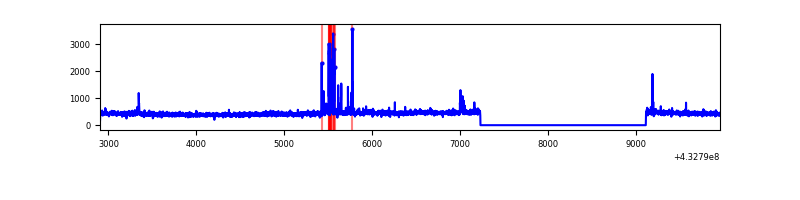 |
| C | 7054 | 5171 | 2 | 2 | 0.03% | 0.04% | 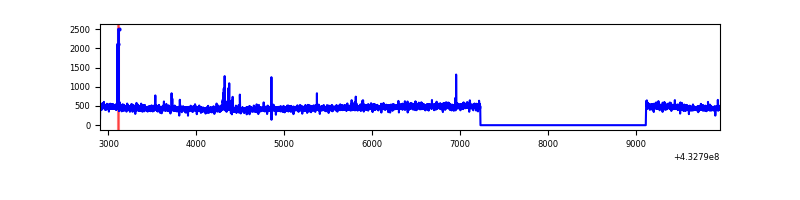 |
| D | 7055 | 5172 | 339 | 339 | 4.81% | 6.55% | 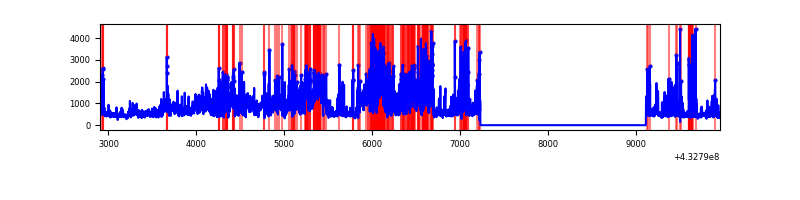 |
Top three noisy pixels from each quadrant. If the there are fewer than three noisy pixels in the level2.evt file, extra rows are filled as -1
| Pixel properties | Quadrant properties | ||||||
|---|---|---|---|---|---|---|---|
| Quadrant | DetID | PixID | Counts | Sigma | Mean | Median | Sigma |
| A | 15 | 222 | 1929049 | 18643.05 | 506 | 496 | 103.4 |
| A | 15 | 237 | 824949 | 7969.87 | 506 | 496 | 103.4 |
| A | 10 | 83 | 473364 | 4571.15 | 506 | 496 | 103.4 |
| B | 5 | 255 | 109741 | 1043.07 | 547 | 533 | 104.7 |
| B | 0 | 229 | 52352 | 494.94 | 547 | 533 | 104.7 |
| B | 3 | 112 | 22107 | 206.06 | 547 | 533 | 104.7 |
| C | 15 | 214 | 217594 | 1735.21 | 535 | 539 | 125.1 |
| C | 15 | 111 | 26432 | 207.0 | 535 | 539 | 125.1 |
| C | 14 | 254 | 5433 | 39.12 | 535 | 539 | 125.1 |
| D | 1 | 52 | 2025727 | 15918.19 | 521 | 505 | 127.2 |
| D | 12 | 233 | 626683 | 4921.74 | 521 | 505 | 127.2 |
| D | 13 | 171 | 92198 | 720.7 | 521 | 505 | 127.2 |
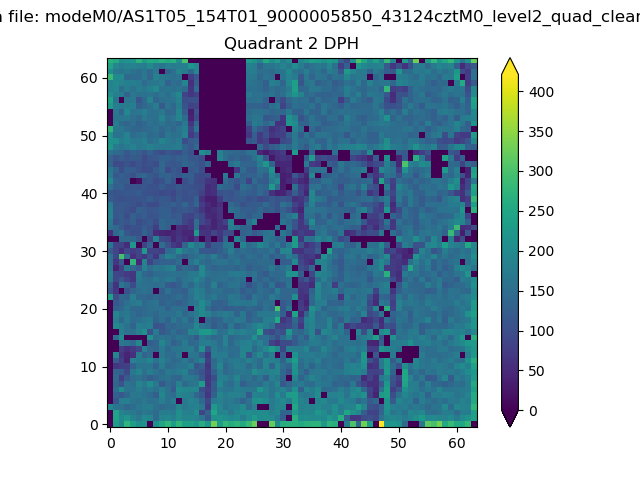
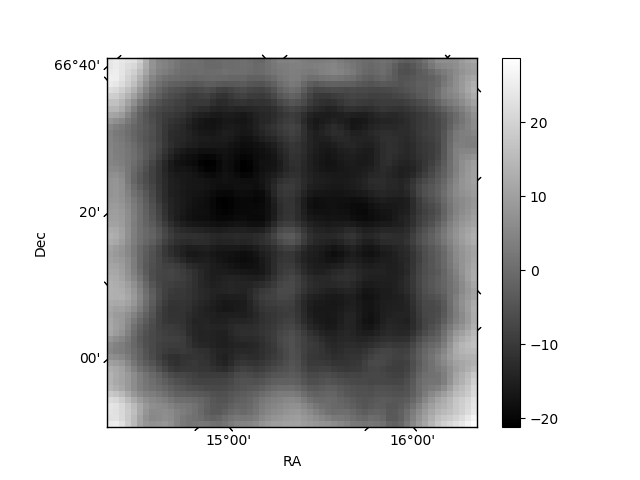
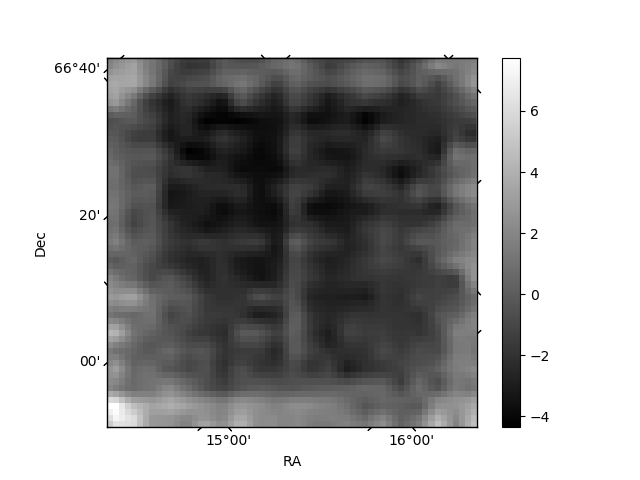
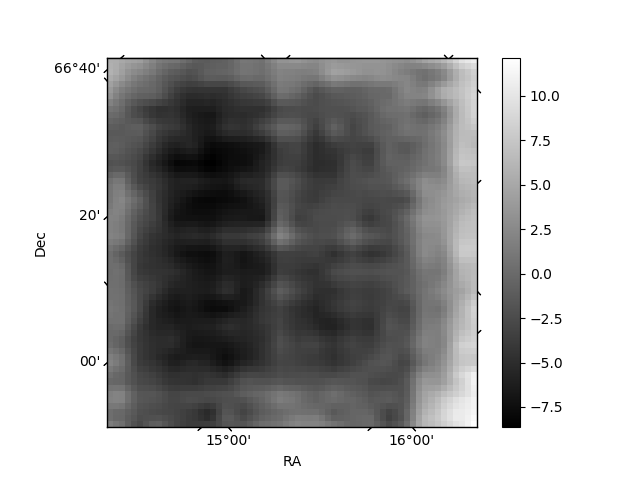
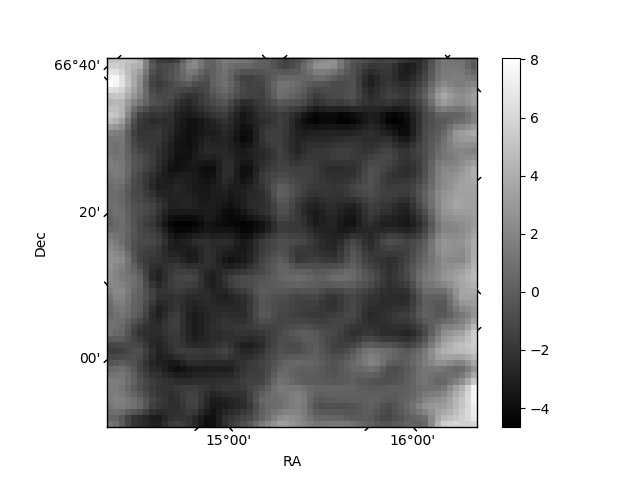
Histogram calculated using DETX and DETY for each event in the final _common_clean file
| Quadrant A | 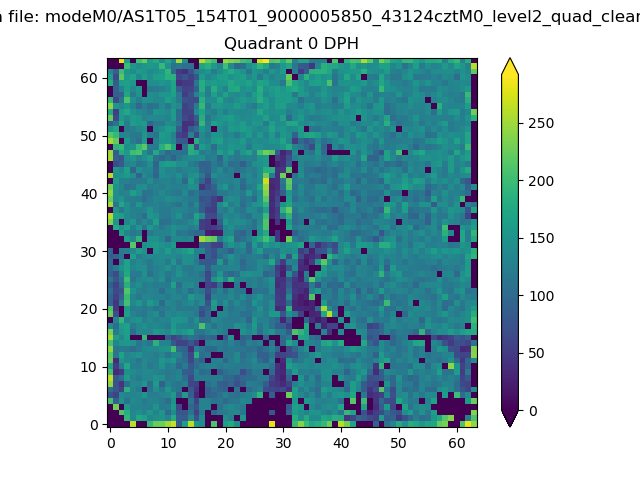 |
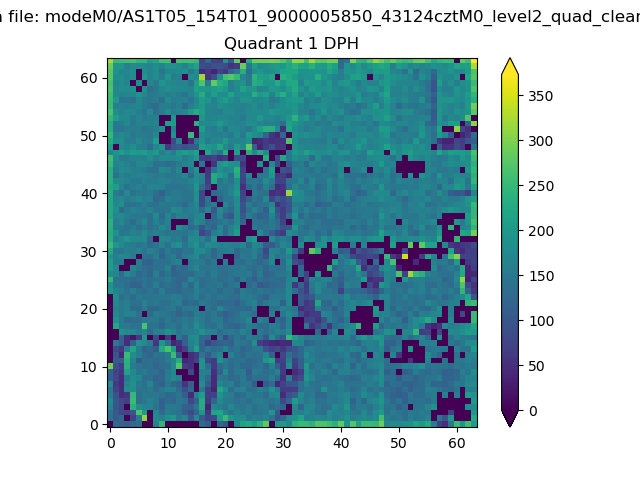 |
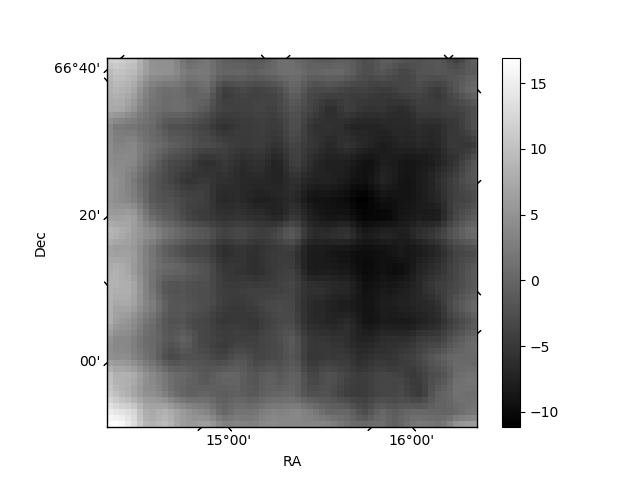
Quadrant B |
|---|---|---|---|
| Quadrant D | 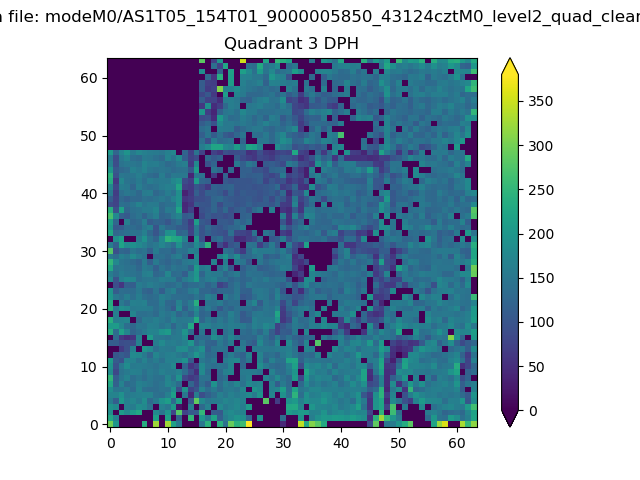 |
 |
Quadrant C |
| Plot type | Count rate plots | Images |
|---|---|---|
| Comparison with Poisson distribution Blue bars denote a histogram of data divided into 1 sec bins. Red curve is a Poisson curve with rate = median count rate of data. |
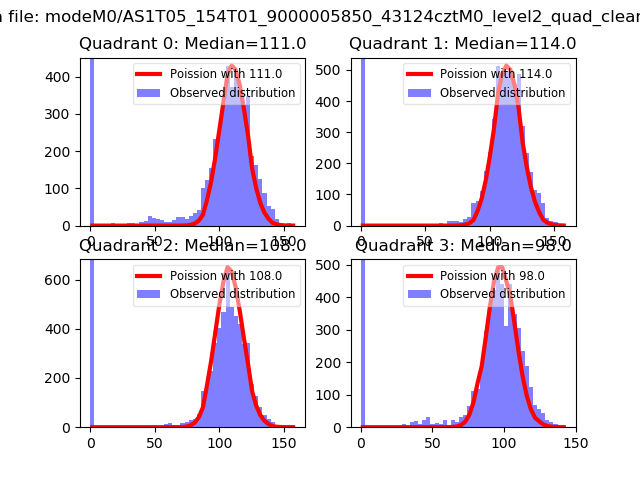 |
 |
| Quadrant-wise count rates Data is divided into 100 sec bins |
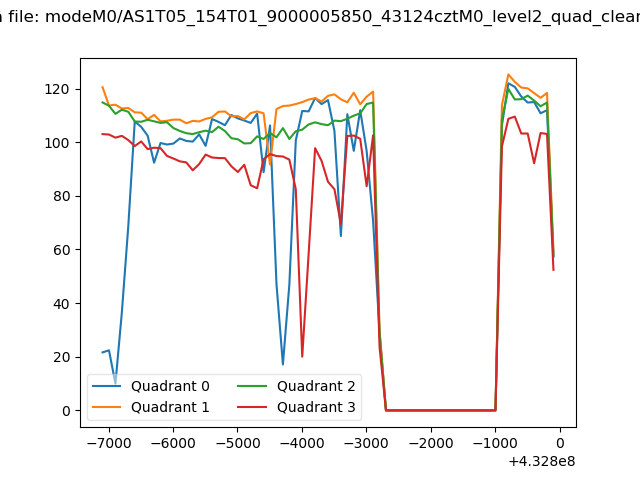 |
|
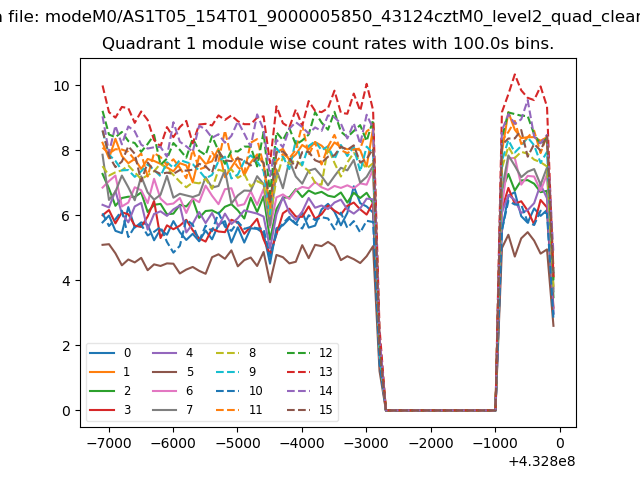
| Module-wise count rates for Quadrant A Data is divided into 100 sec bins |
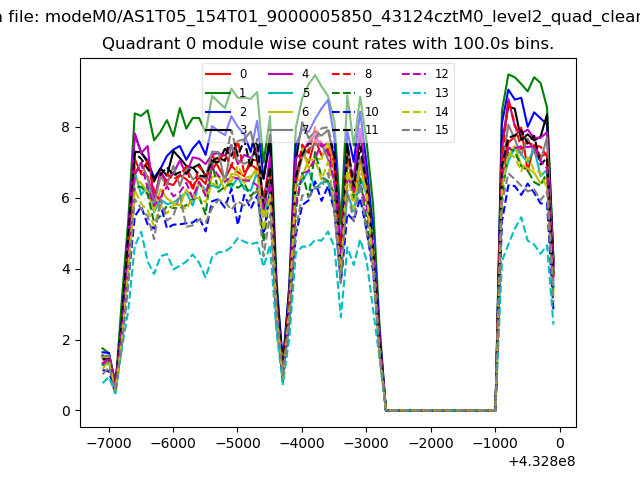 |
 |
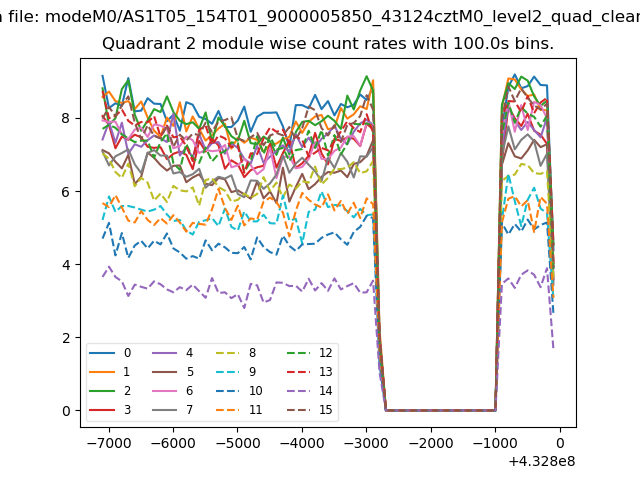
| Module-wise count rates for Quadrant B Data is divided into 100 sec bins |
 |
 |
| Module-wise count rates for Quadrant C Data is divided into 100 sec bins |
 |
 |
| Module-wise count rates for Quadrant D Data is divided into 100 sec bins |
 |
 |
| Parameter | Plot |
|---|---|
| CZT HV Monitor | 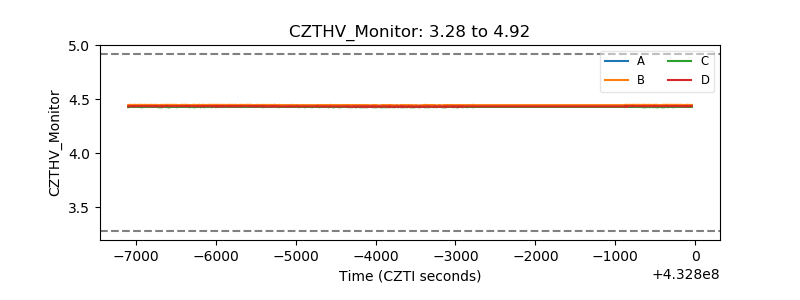 |
| D_VDD | 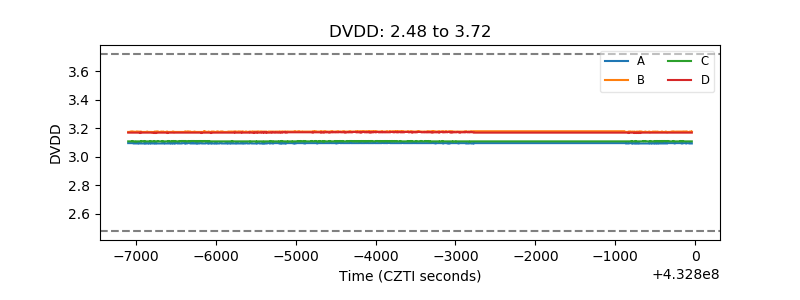 |
| Temperature 1 | 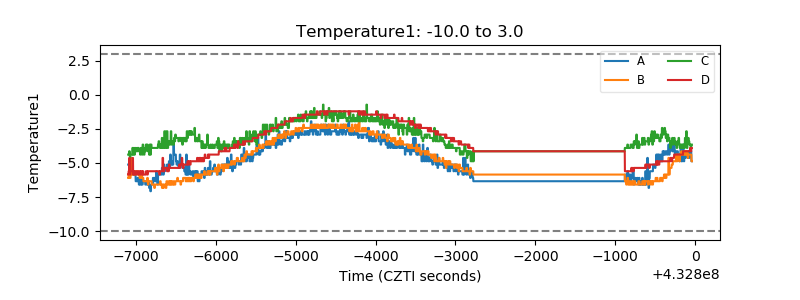 |
| Veto HV Monitor | 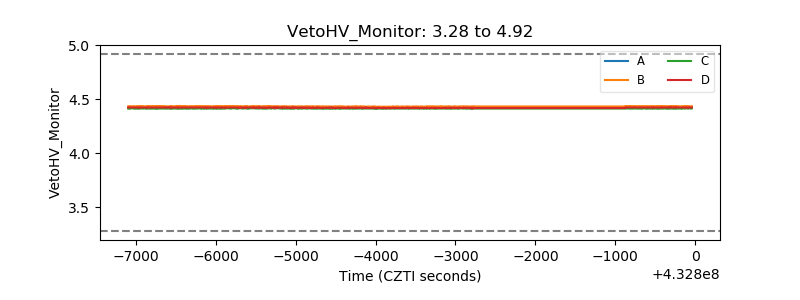 |
| Veto LLD | 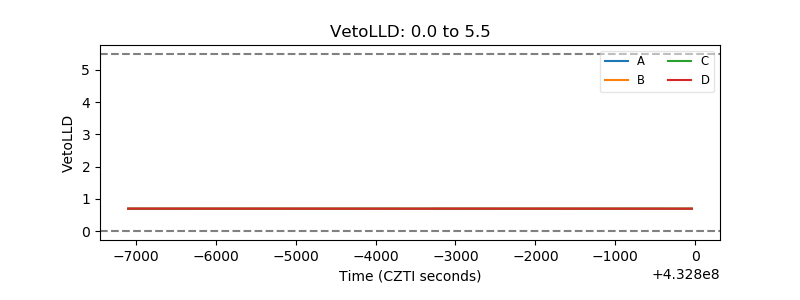 |
| Alpha Counter | 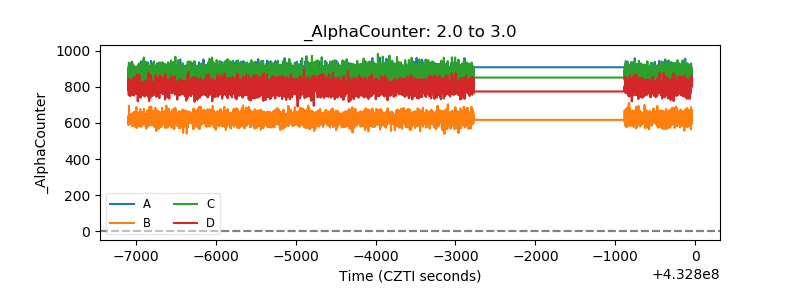 |
| _CPM_Rate | 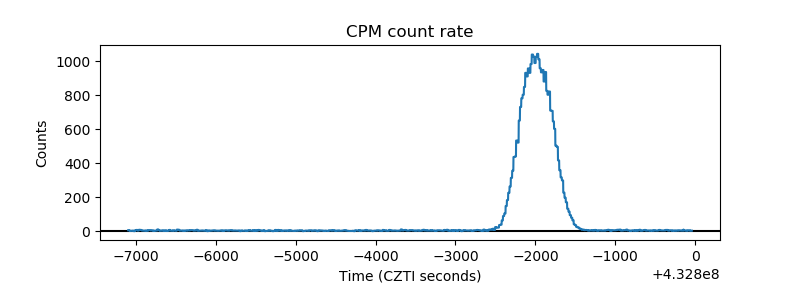 |
| CZT Counter | 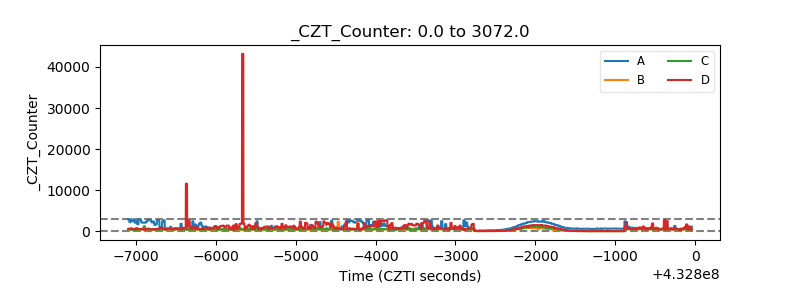 |
| +2.5 Volts monitor |  |
| +5 Volts monitor |  |
| _ROLL_ROT | 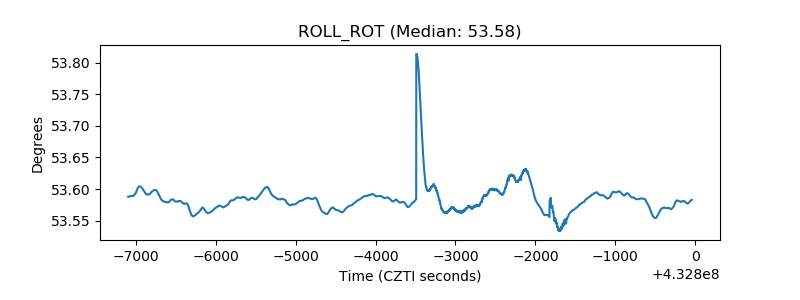 |
| _Roll_DEC | 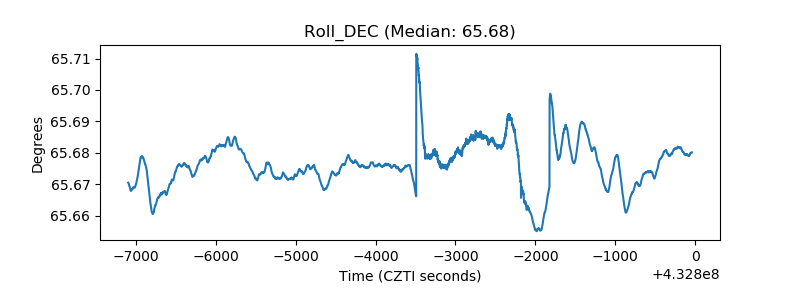 |
| _Roll_RA | 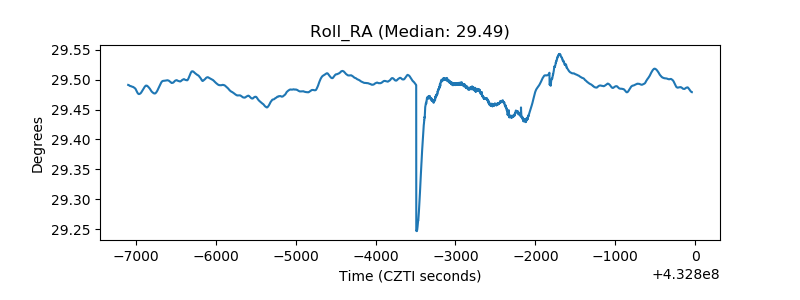 |
| Veto Counter | 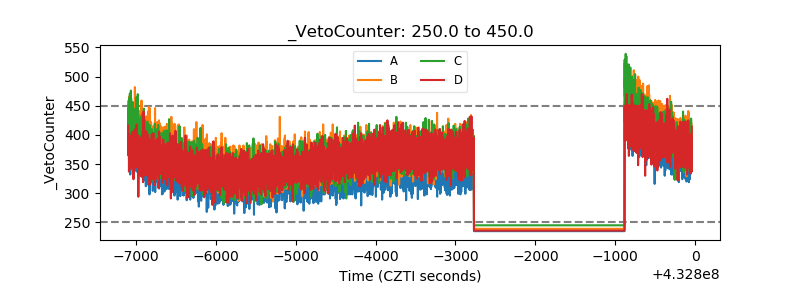 |