| Param | Original file | Final file |
|---|---|---|
| Filename | modeM0/AS1T05_154T01_9000005850_43125cztM0_level2.fits | modeM0/AS1T05_154T01_9000005850_43125cztM0_level2_quad_clean.evt |
| Size (bytes) | 283,996,800 | 59,892,480 |
| Size | 270.8 MB | 57.1 MB |
| Events in quadrant A | 4,340,547 | 333,825 |
| Events in quadrant B | 1,662,806 | 437,231 |
| Events in quadrant C | 1,695,477 | 408,129 |
| Events in quadrant D | 2,520,674 | 369,725 |
| Mode M0 | |||
|---|---|---|---|
| Quadrant | BADHDUFLAG | Total packets | Discarded packets |
| A | 0 | 15334 | 1 |
| B | 0 | 7583 | 1 |
| C | 0 | 7552 | 1 |
| D | 0 | 10105 | 1 |
| Mode SS | |||
|---|---|---|---|
| Quadrant | BADHDUFLAG | Total packets | Discarded packets |
| A | 0 | 74 | 0 |
| B | 0 | 74 | 0 |
| C | 0 | 74 | 0 |
| D | 0 | 74 | 0 |
| Mode M9 | |||
|---|---|---|---|
| Quadrant | BADHDUFLAG | Total packets | Discarded packets |
| A | 0 | 8 | 0 |
| B | 0 | 9 | 0 |
| C | 0 | 9 | 0 |
| D | 0 | 9 | 0 |
| Quadrant | Total seconds | Saturated seconds | Saturation percentage |
|---|---|---|---|
| A | 3747 | 910 | 24.286096% |
| B | 3747 | 3 | 0.080064% |
| C | 3747 | 4 | 0.106752% |
| D | 3747 | 163 | 4.350147% |
Noise dominated data is calculated using 1-second bins in cleaned event files. If a bin has >2000 counts, and if more than 50% of those come from <1% of pixels, then it is considered to be noise-dominated and hence unusable.
| Quadrant | # 1 sec bins | Bins with >0 counts | Bins with >2000 counts | High rate bins dominated by noise | Noise dominated (total time) | Noise dominated (detector-on time) | Marked lightcurve |
|---|---|---|---|---|---|---|---|
| A | 3747 | 3747 | 786 | 786 | 20.98% | 20.98% | 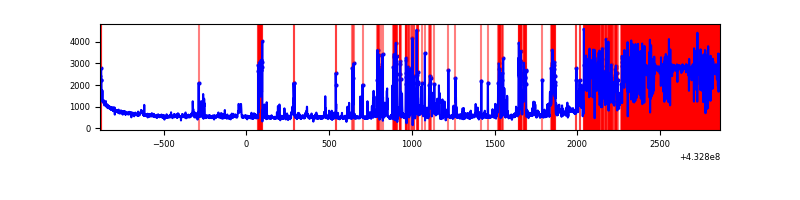 |
| B | 3747 | 3747 | 1 | 1 | 0.03% | 0.03% | 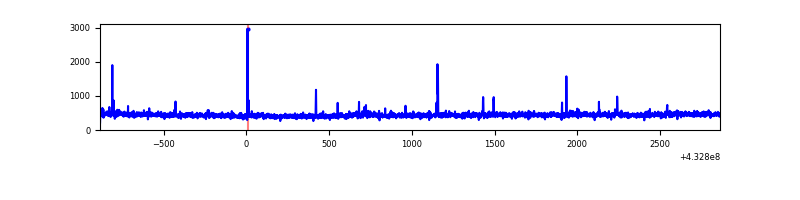 |
| C | 3747 | 3747 | 2 | 2 | 0.05% | 0.05% | 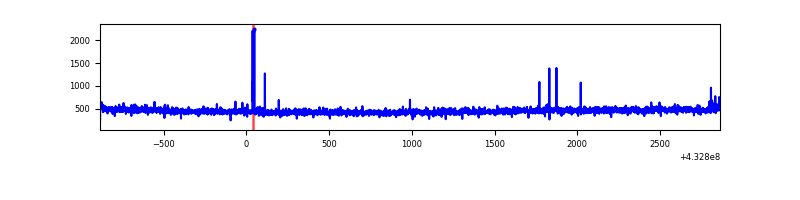 |
| D | 3747 | 3747 | 106 | 106 | 2.83% | 2.83% | 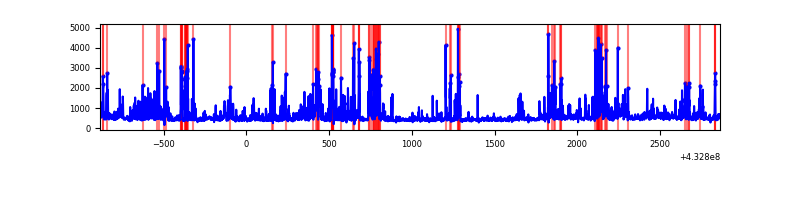 |
Top three noisy pixels from each quadrant. If the there are fewer than three noisy pixels in the level2.evt file, extra rows are filled as -1
| Pixel properties | Quadrant properties | ||||||
|---|---|---|---|---|---|---|---|
| Quadrant | DetID | PixID | Counts | Sigma | Mean | Median | Sigma |
| A | 15 | 222 | 2220327 | 30312.06 | 353 | 346 | 73.2 |
| A | 10 | 83 | 347502 | 4740.14 | 353 | 346 | 73.2 |
| A | 15 | 237 | 331883 | 4526.87 | 353 | 346 | 73.2 |
| B | 0 | 229 | 51190 | 650.24 | 402 | 392 | 78.1 |
| B | 0 | 189 | 11862 | 146.82 | 402 | 392 | 78.1 |
| B | 5 | 255 | 11842 | 146.57 | 402 | 392 | 78.1 |
| C | 15 | 214 | 154062 | 1677.48 | 390 | 392 | 91.6 |
| C | 14 | 254 | 8325 | 86.6 | 390 | 392 | 91.6 |
| C | 5 | 250 | 5530 | 56.09 | 390 | 392 | 91.6 |
| D | 1 | 52 | 914646 | 9633.65 | 388 | 376 | 94.9 |
| D | 10 | 34 | 25211 | 261.69 | 388 | 376 | 94.9 |
| D | 12 | 6 | 23309 | 241.64 | 388 | 376 | 94.9 |
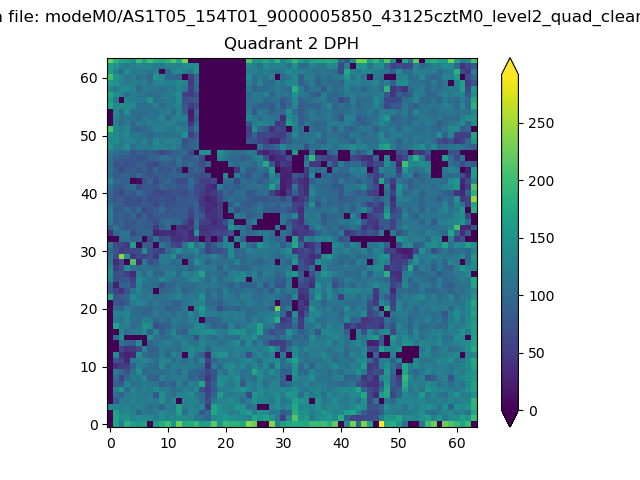
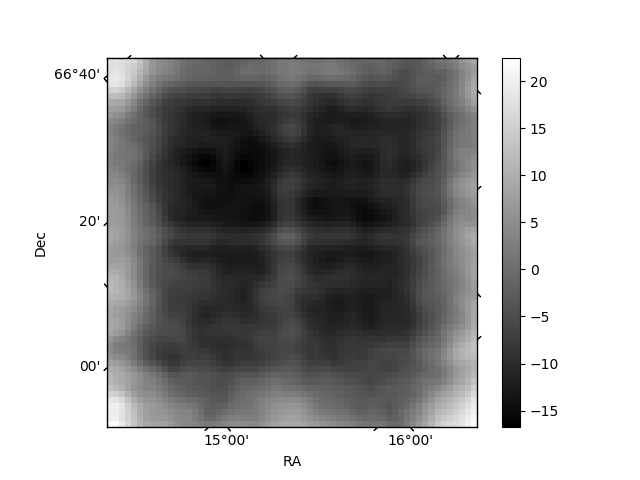
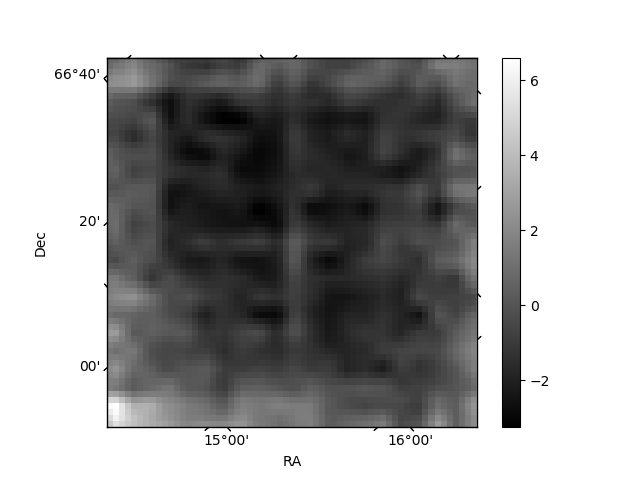
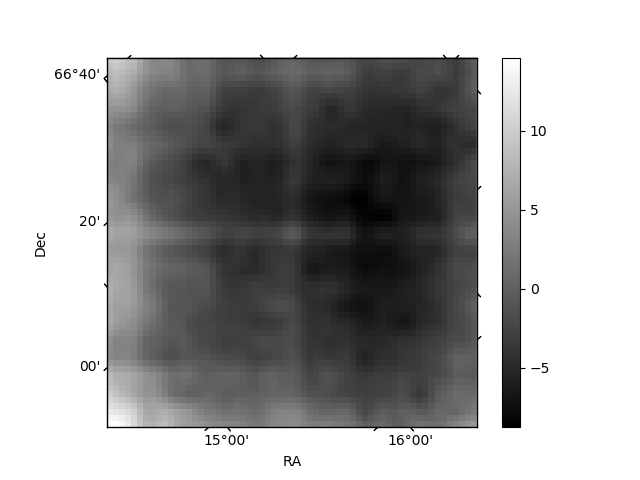
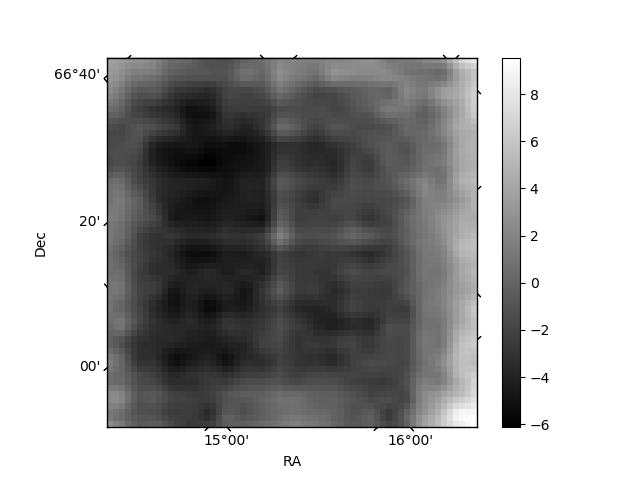
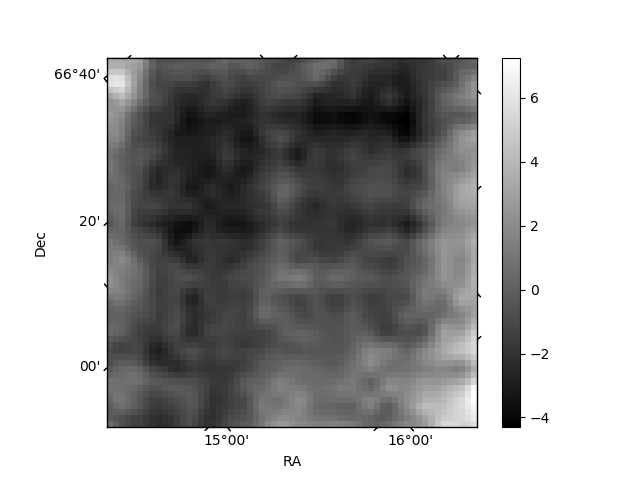
Histogram calculated using DETX and DETY for each event in the final _common_clean file
| Quadrant A | 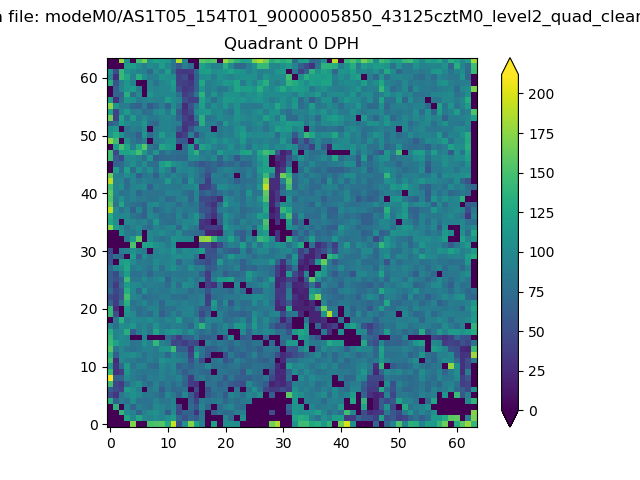 |
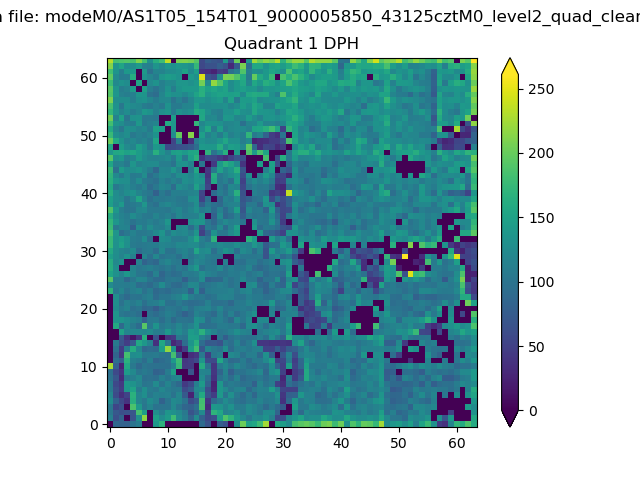 |
Quadrant B |
|---|---|---|---|
| Quadrant D | 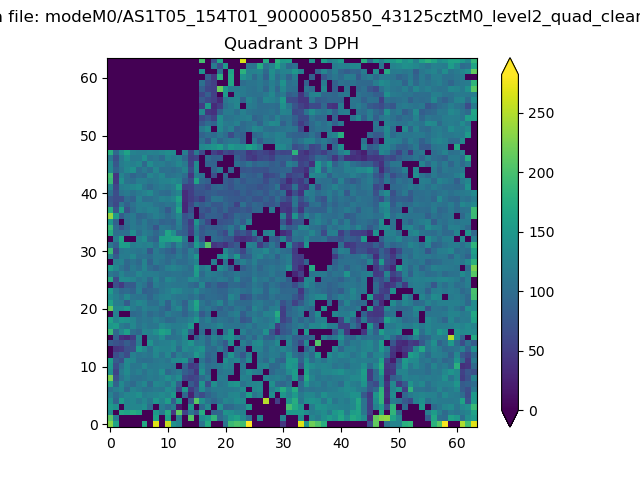 |
 |
Quadrant C |
| Plot type | Count rate plots | Images |
|---|---|---|
| Comparison with Poisson distribution Blue bars denote a histogram of data divided into 1 sec bins. Red curve is a Poisson curve with rate = median count rate of data. |
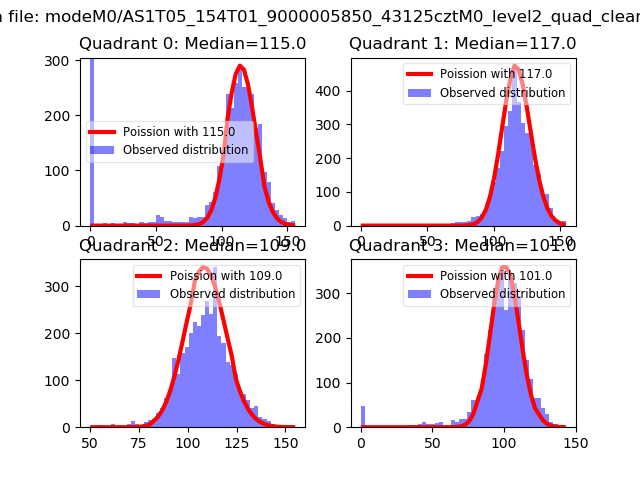 |
 |
| Quadrant-wise count rates Data is divided into 100 sec bins |
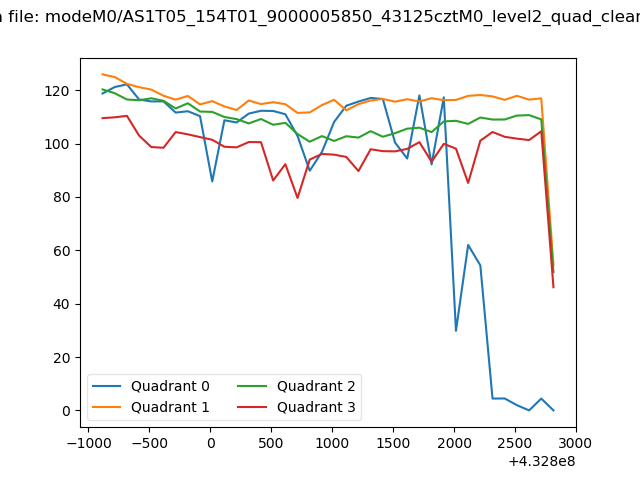 |
|
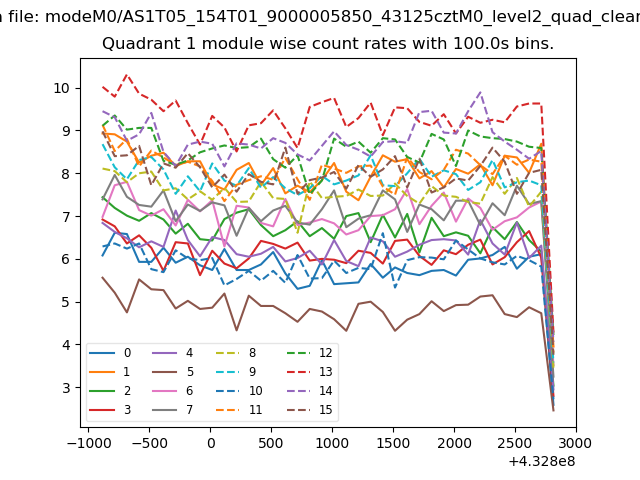
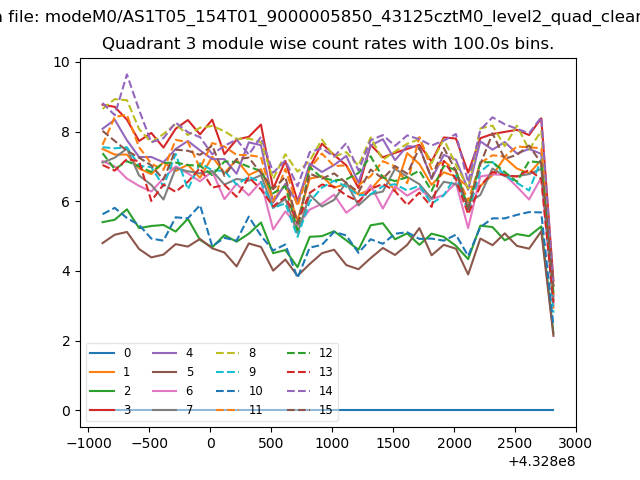
| Module-wise count rates for Quadrant A Data is divided into 100 sec bins |
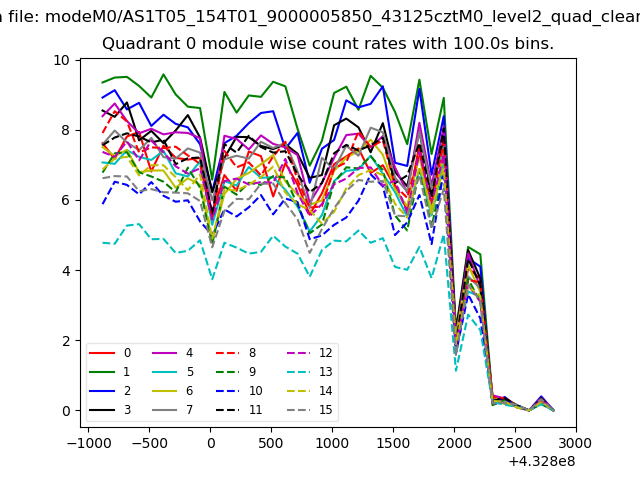 |
 |
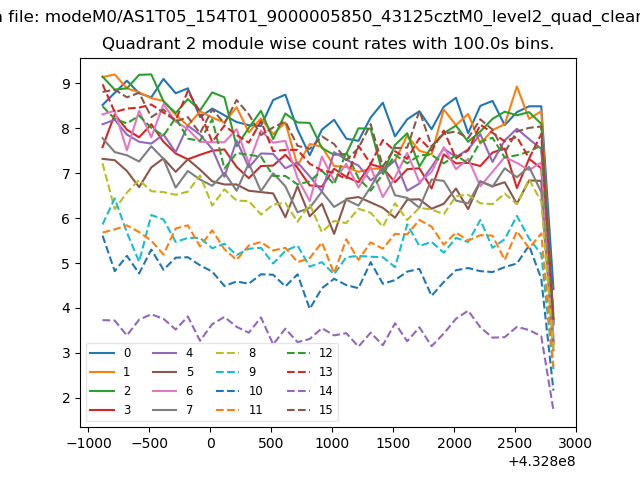
| Module-wise count rates for Quadrant B Data is divided into 100 sec bins |
 |
 |
| Module-wise count rates for Quadrant C Data is divided into 100 sec bins |
 |
 |
| Module-wise count rates for Quadrant D Data is divided into 100 sec bins |
 |
 |
| Parameter | Plot |
|---|---|
| CZT HV Monitor | 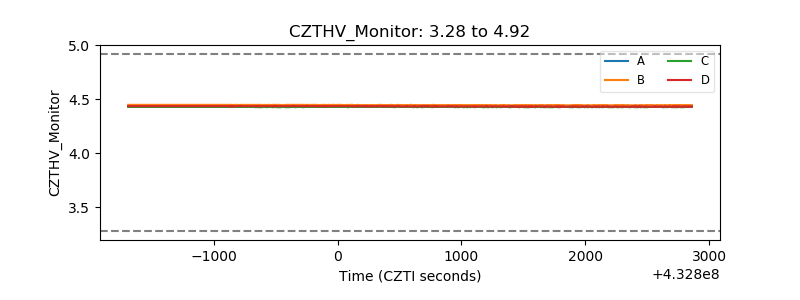 |
| D_VDD | 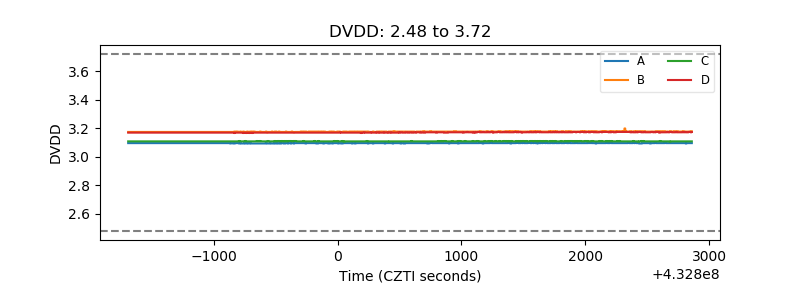 |
| Temperature 1 |  |
| Veto HV Monitor | 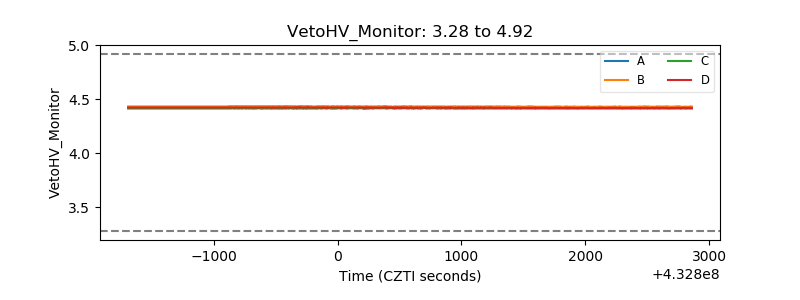 |
| Veto LLD | 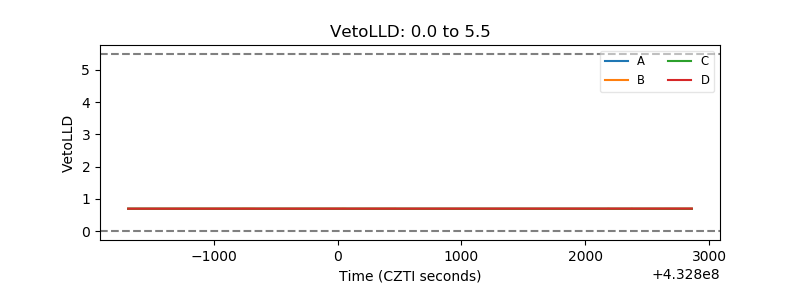 |
| Alpha Counter | 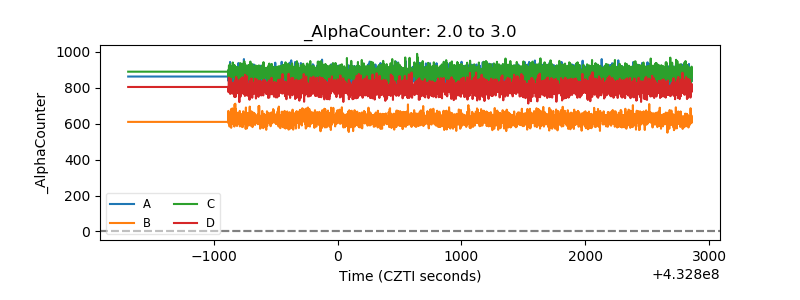 |
| _CPM_Rate | 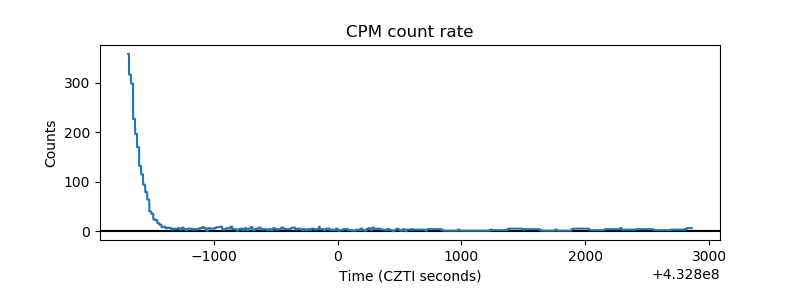 |
| CZT Counter | 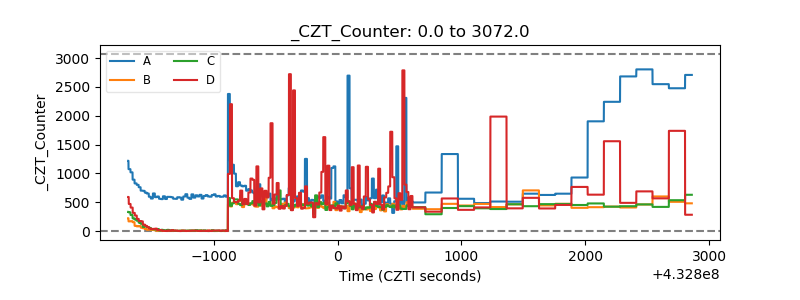 |
| +2.5 Volts monitor | 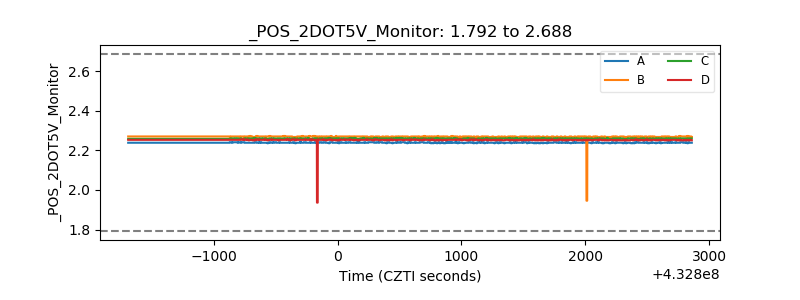 |
| +5 Volts monitor | 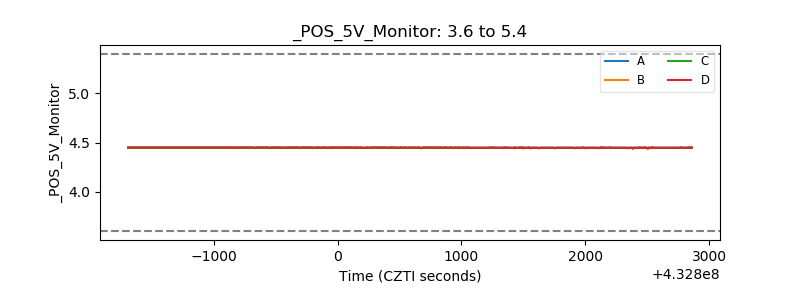 |
| _ROLL_ROT | 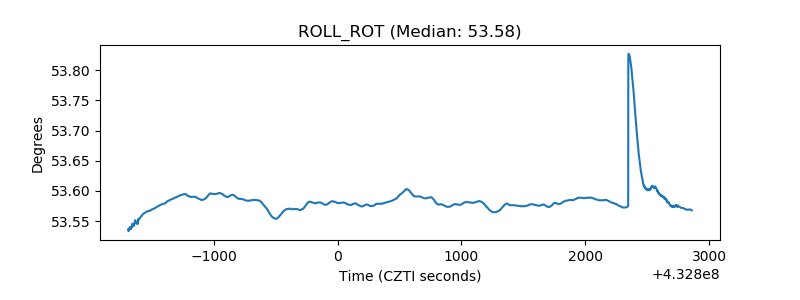 |
| _Roll_DEC | 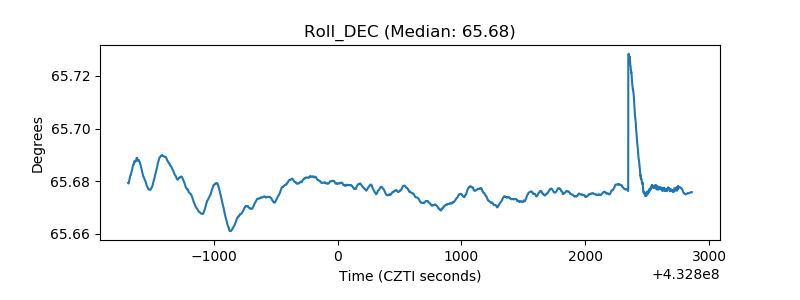 |
| _Roll_RA | 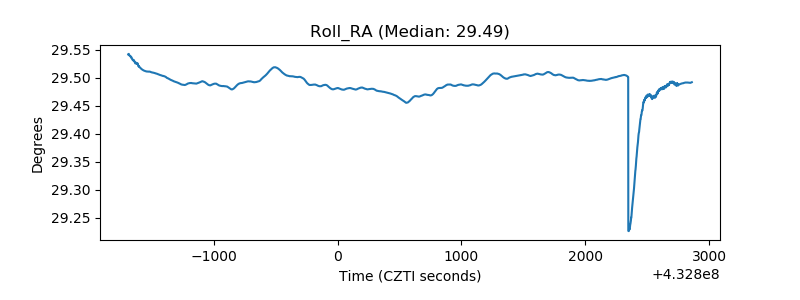 |
| Veto Counter |  |