| Param | Original file | Final file |
|---|---|---|
| Filename | modeM0/AS1A09_006T07_9000005852_43125cztM0_level2.fits | modeM0/AS1A09_006T07_9000005852_43125cztM0_level2_quad_clean.evt |
| Size (bytes) | 57,052,800 | 15,891,840 |
| Size | 54.4 MB | 15.2 MB |
| Events in quadrant A | 714,128 | 104,998 |
| Events in quadrant B | 395,369 | 111,507 |
| Events in quadrant C | 418,283 | 104,138 |
| Events in quadrant D | 515,070 | 94,738 |
| Mode M9 | |||
|---|---|---|---|
| Quadrant | BADHDUFLAG | Total packets | Discarded packets |
| A | 0 | 18 | 0 |
| B | 0 | 18 | 0 |
| C | 0 | 18 | 0 |
| D | 0 | 18 | 0 |
| Mode M0 | |||
|---|---|---|---|
| Quadrant | BADHDUFLAG | Total packets | Discarded packets |
| A | 0 | 2738 | 1 |
| B | 0 | 1697 | 1 |
| C | 0 | 1711 | 1 |
| D | 0 | 2086 | 3 |
| Mode SS | |||
|---|---|---|---|
| Quadrant | BADHDUFLAG | Total packets | Discarded packets |
| A | 0 | 16 | 0 |
| B | 0 | 16 | 0 |
| C | 0 | 16 | 0 |
| D | 0 | 16 | 0 |
| Quadrant | Total seconds | Saturated seconds | Saturation percentage |
|---|---|---|---|
| A | 846 | 25 | 2.955083% |
| B | 846 | 1 | 0.118203% |
| C | 846 | 1 | 0.118203% |
| D | 845 | 24 | 2.840237% |
Noise dominated data is calculated using 1-second bins in cleaned event files. If a bin has >2000 counts, and if more than 50% of those come from <1% of pixels, then it is considered to be noise-dominated and hence unusable.
| Quadrant | # 1 sec bins | Bins with >0 counts | Bins with >2000 counts | High rate bins dominated by noise | Noise dominated (total time) | Noise dominated (detector-on time) | Marked lightcurve |
|---|---|---|---|---|---|---|---|
| A | 846 | 846 | 16 | 16 | 1.89% | 1.89% | 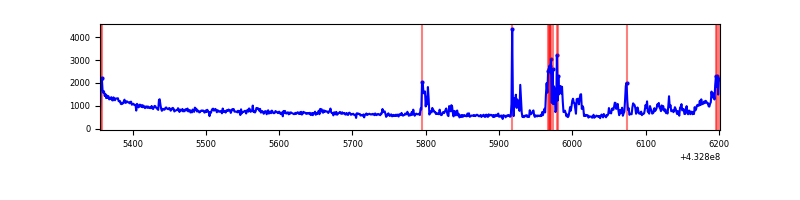 |
| B | 846 | 846 | 0 | 0 | 0.00% | 0.00% | 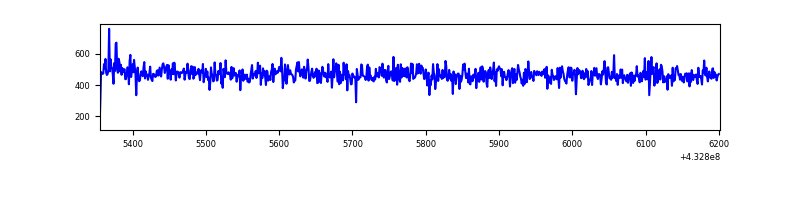 |
| C | 846 | 846 | 0 | 0 | 0.00% | 0.00% | 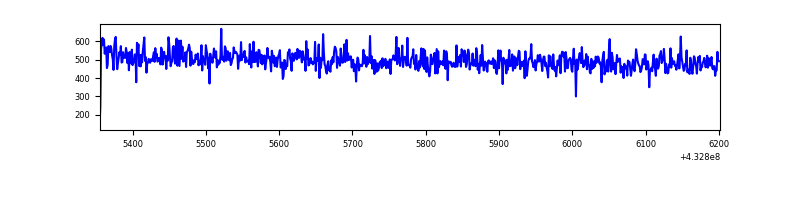 |
| D | 845 | 845 | 15 | 15 | 1.78% | 1.78% | 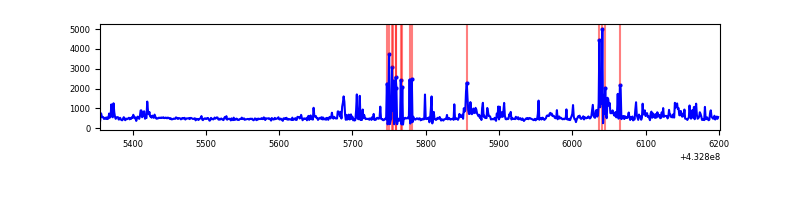 |
Top three noisy pixels from each quadrant. If the there are fewer than three noisy pixels in the level2.evt file, extra rows are filled as -1
| Pixel properties | Quadrant properties | ||||||
|---|---|---|---|---|---|---|---|
| Quadrant | DetID | PixID | Counts | Sigma | Mean | Median | Sigma |
| A | 10 | 83 | 156562 | 6968.52 | 101 | 99 | 22.5 |
| A | 15 | 222 | 102844 | 4576.04 | 101 | 99 | 22.5 |
| A | 15 | 237 | 59593 | 2649.73 | 101 | 99 | 22.5 |
| B | 14 | 111 | 2369 | 107.26 | 99 | 97 | 21.2 |
| B | 12 | 111 | 2335 | 105.65 | 99 | 97 | 21.2 |
| B | 11 | 111 | 2154 | 97.11 | 99 | 97 | 21.2 |
| C | 15 | 214 | 39975 | 1663.11 | 96 | 97 | 24.0 |
| C | 5 | 250 | 941 | 35.2 | 96 | 97 | 24.0 |
| C | 3 | 233 | 922 | 34.41 | 96 | 97 | 24.0 |
| D | 1 | 52 | 134452 | 5346.14 | 96 | 93 | 25.1 |
| D | 12 | 6 | 6806 | 267.11 | 96 | 93 | 25.1 |
| D | 2 | 234 | 3429 | 132.74 | 96 | 93 | 25.1 |
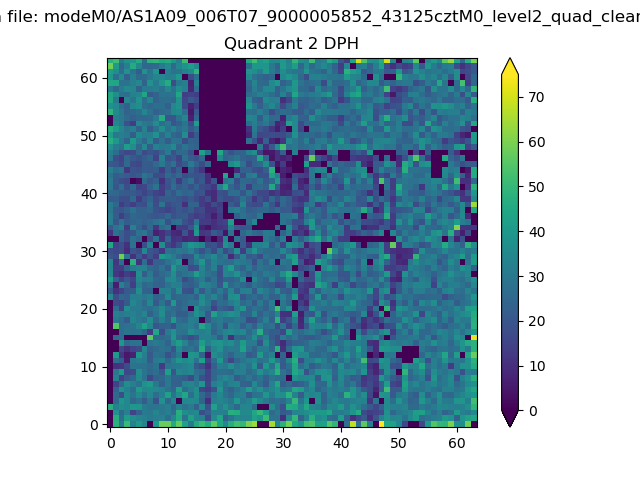
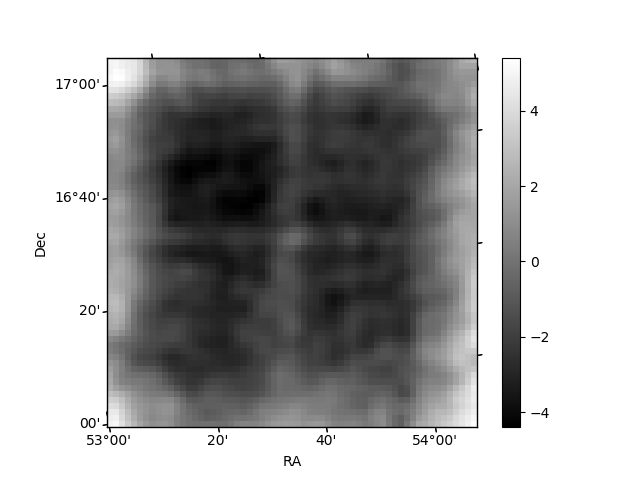
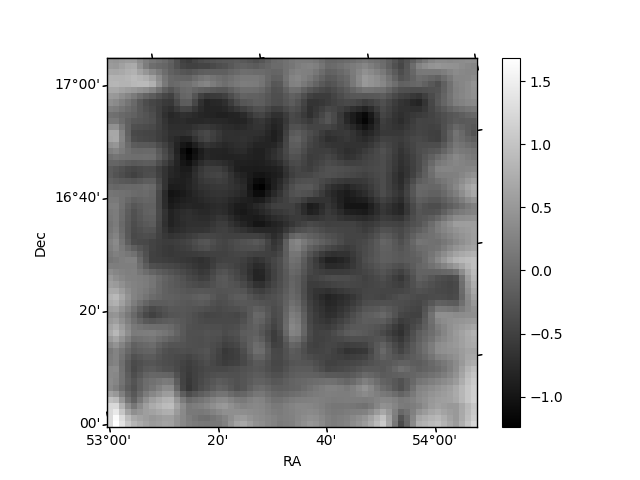
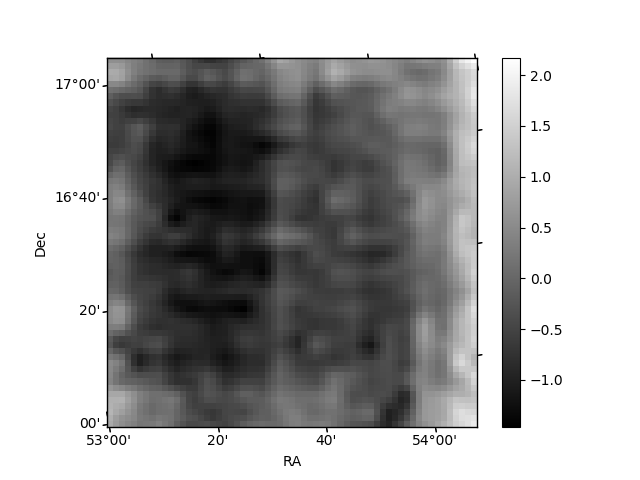
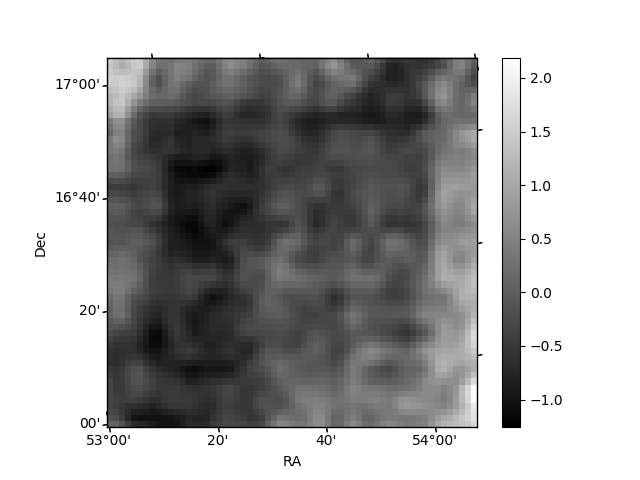
Histogram calculated using DETX and DETY for each event in the final _common_clean file
| Quadrant A | 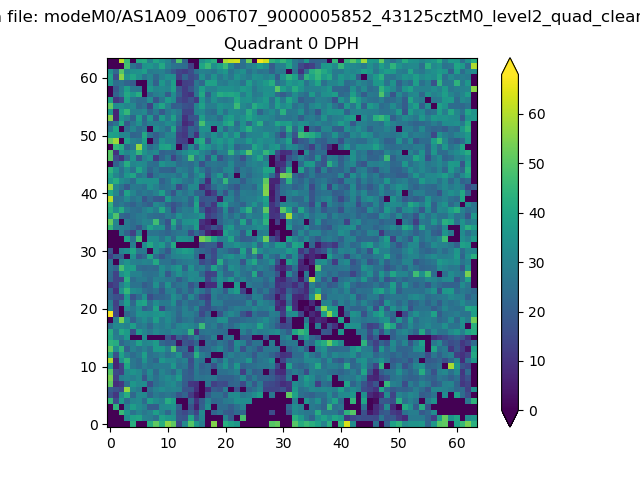 |
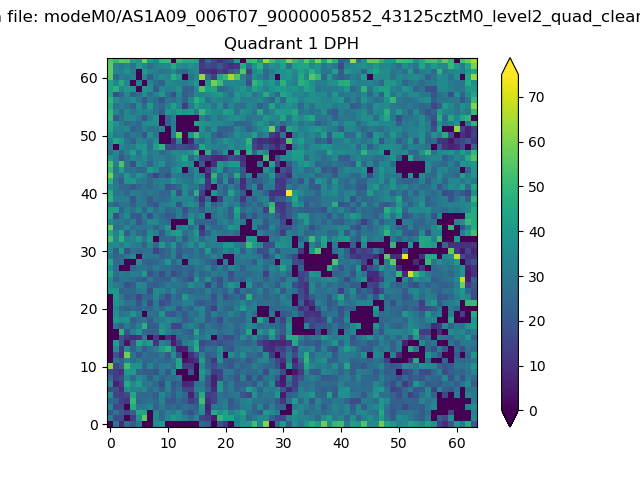 |
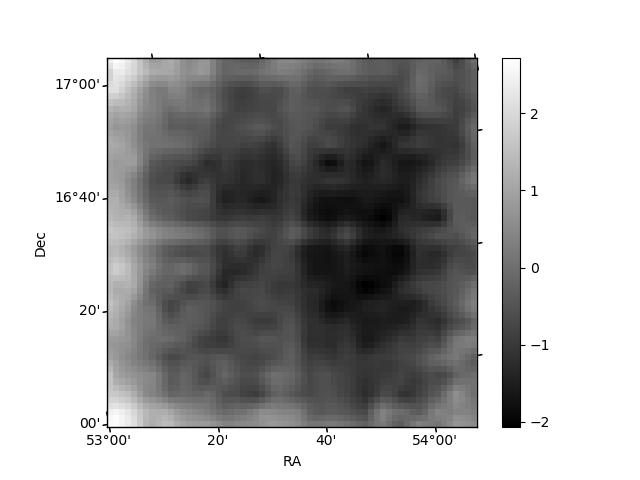
Quadrant B |
|---|---|---|---|
| Quadrant D | 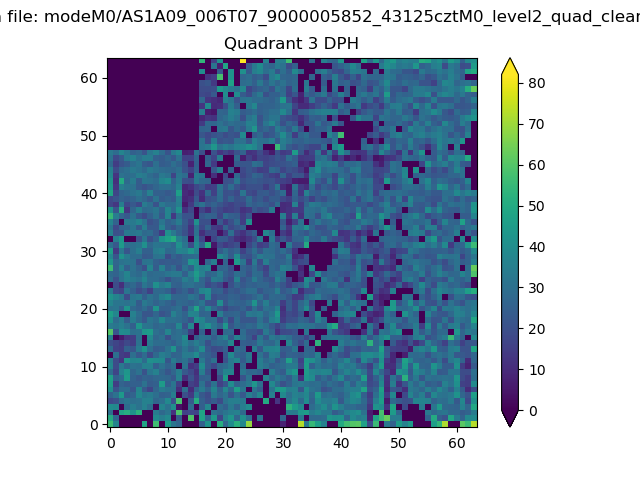 |
 |
Quadrant C |
| Plot type | Count rate plots | Images |
|---|---|---|
| Comparison with Poisson distribution Blue bars denote a histogram of data divided into 1 sec bins. Red curve is a Poisson curve with rate = median count rate of data. |
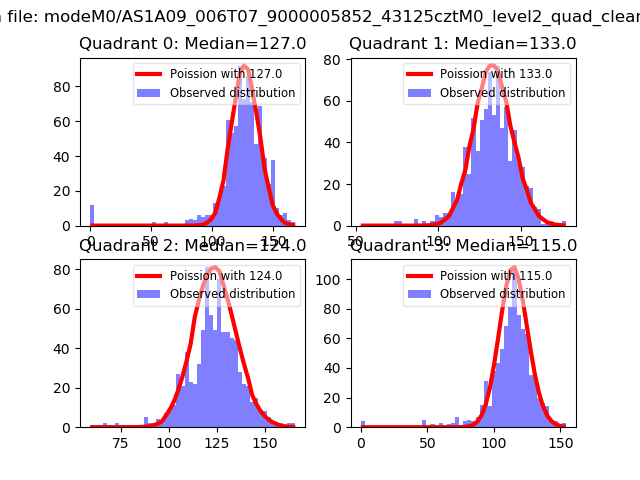 |
 |
| Quadrant-wise count rates Data is divided into 100 sec bins |
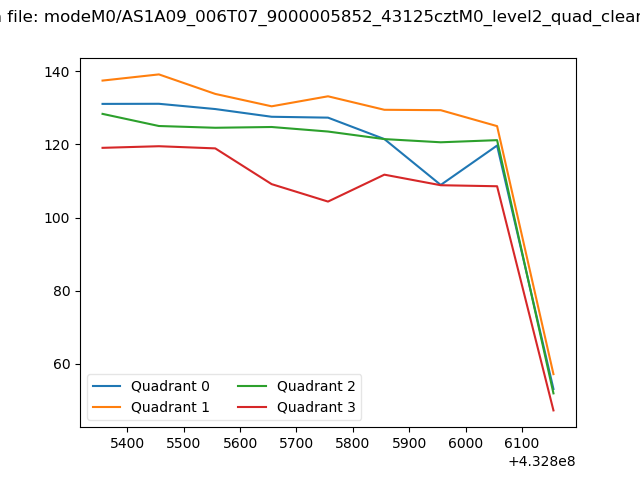 |
|
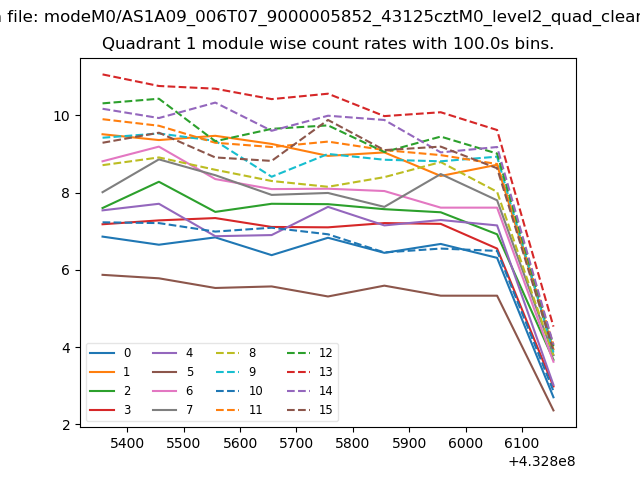
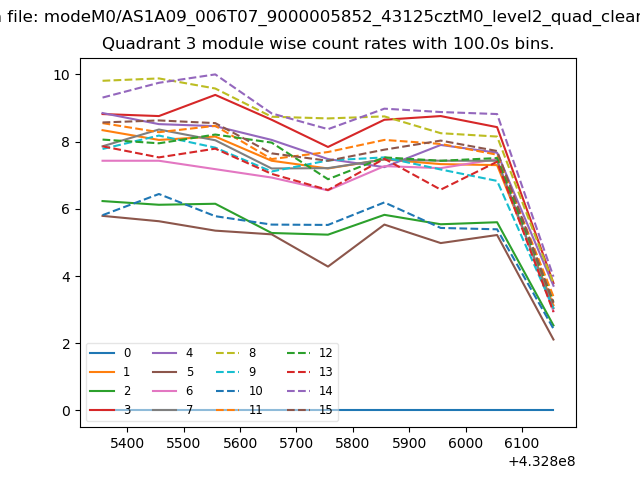
| Module-wise count rates for Quadrant A Data is divided into 100 sec bins |
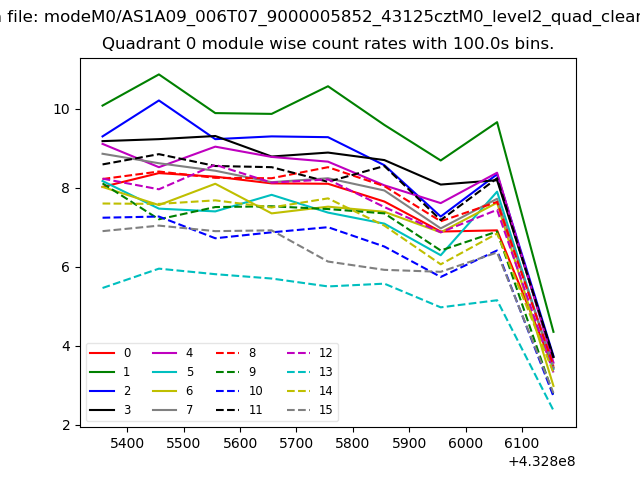 |
 |
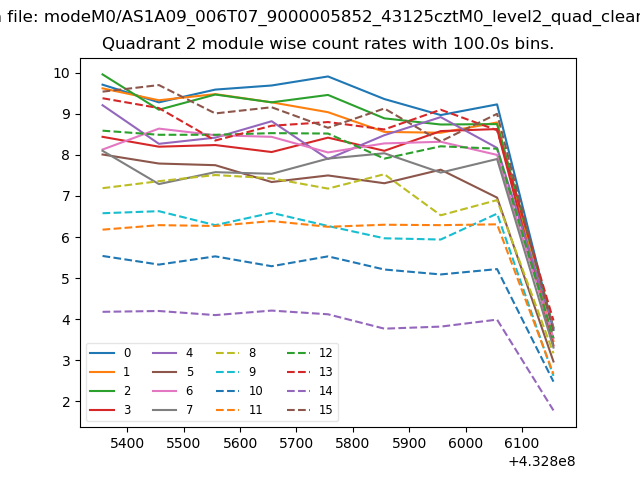
| Module-wise count rates for Quadrant B Data is divided into 100 sec bins |
 |
 |
| Module-wise count rates for Quadrant C Data is divided into 100 sec bins |
 |
 |
| Module-wise count rates for Quadrant D Data is divided into 100 sec bins |
 |
 |
| Parameter | Plot |
|---|---|
| CZT HV Monitor | 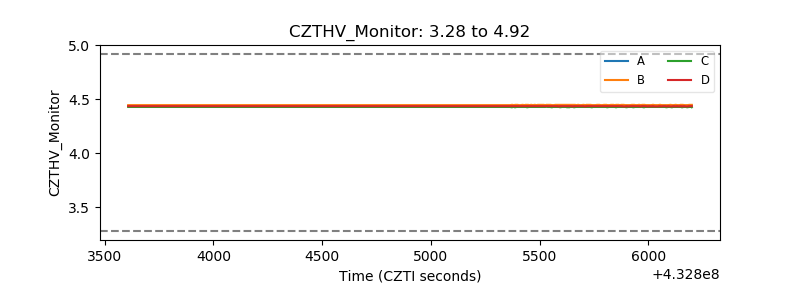 |
| D_VDD | 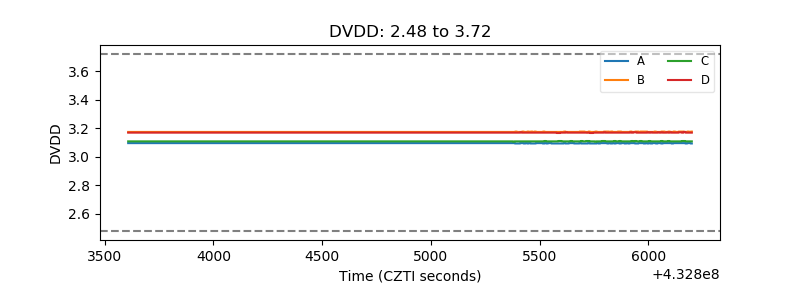 |
| Temperature 1 | 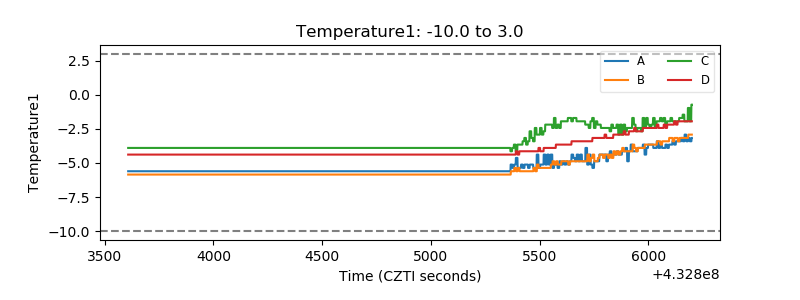 |
| Veto HV Monitor | 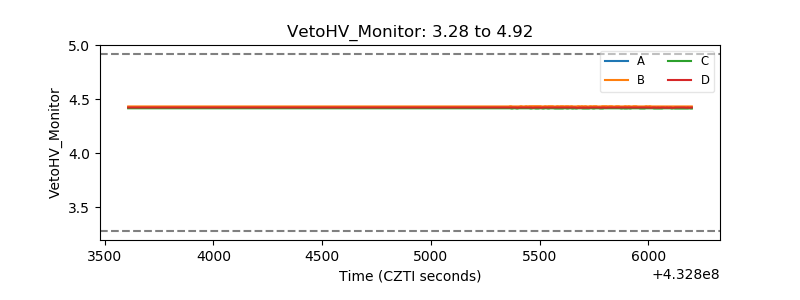 |
| Veto LLD | 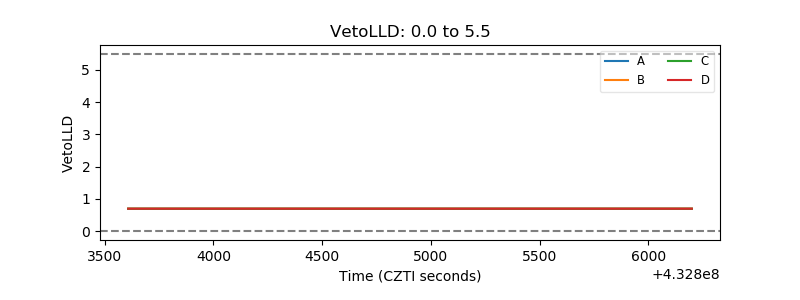 |
| Alpha Counter | 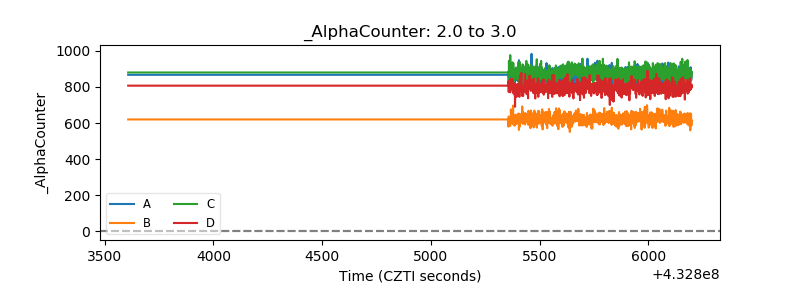 |
| _CPM_Rate |  |
| CZT Counter | 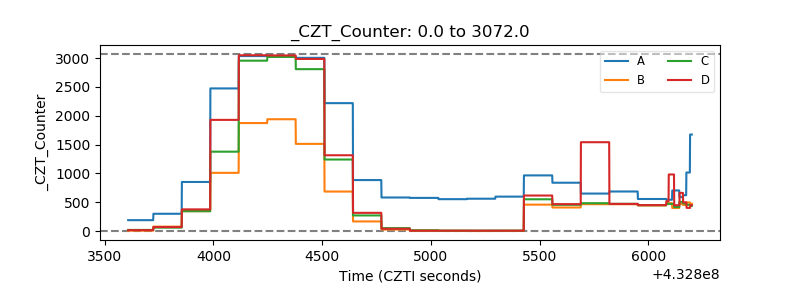 |
| +2.5 Volts monitor | 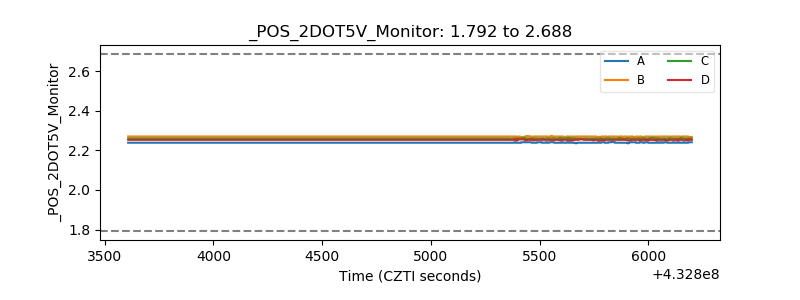 |
| +5 Volts monitor | 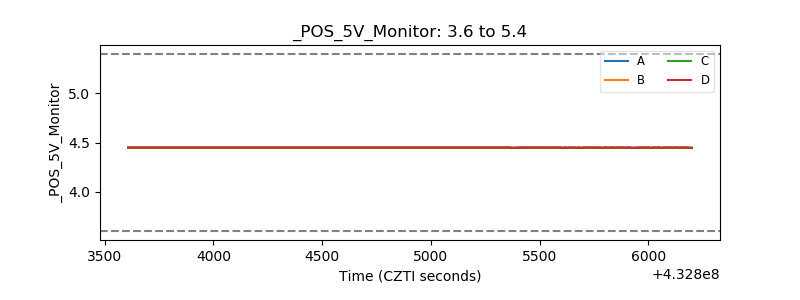 |
| _ROLL_ROT | 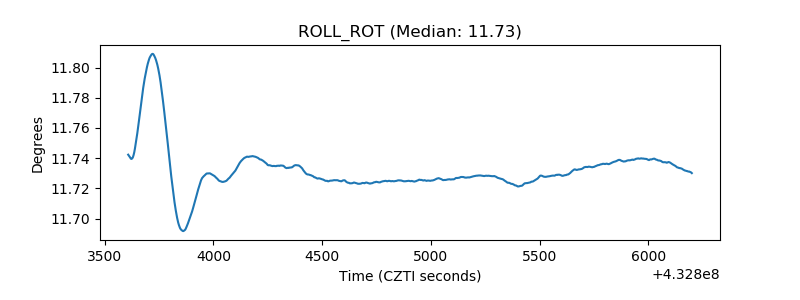 |
| _Roll_DEC | 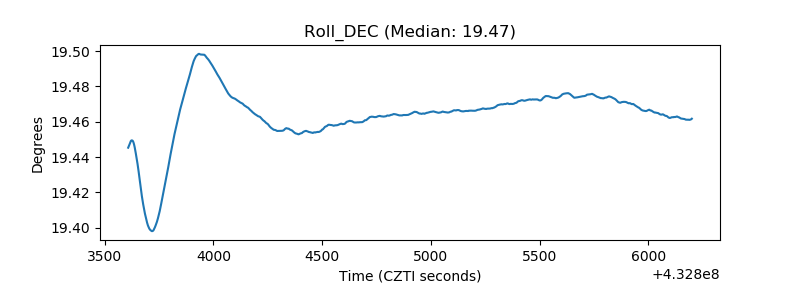 |
| _Roll_RA | 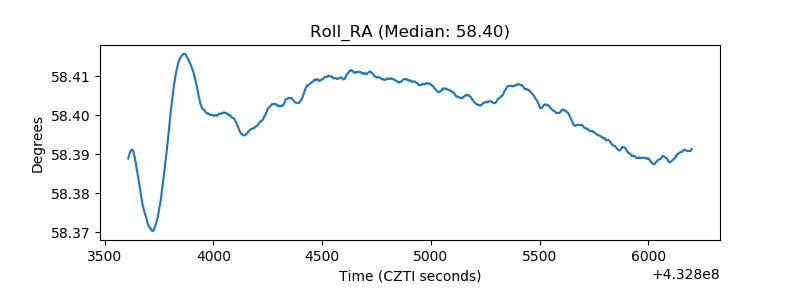 |
| Veto Counter | 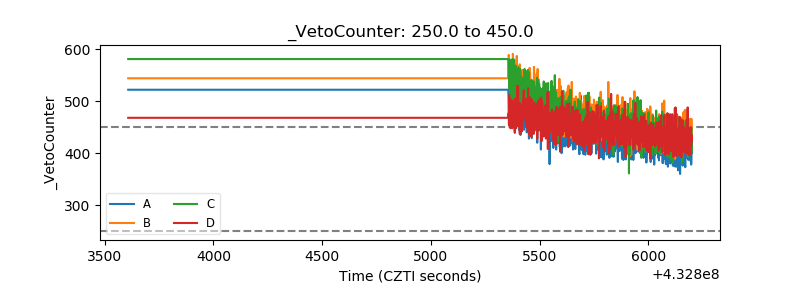 |