| Param | Original file | Final file |
|---|---|---|
| Filename | modeM0/AS1A09_006T07_9000005852_43126cztM0_level2.fits | modeM0/AS1A09_006T07_9000005852_43126cztM0_level2_quad_clean.evt |
| Size (bytes) | 359,962,560 | 83,928,960 |
| Size | 343.3 MB | 80.0 MB |
| Events in quadrant A | 4,664,467 | 514,622 |
| Events in quadrant B | 2,486,092 | 605,947 |
| Events in quadrant C | 2,379,470 | 563,262 |
| Events in quadrant D | 3,413,662 | 514,583 |
| Mode M9 | |||
|---|---|---|---|
| Quadrant | BADHDUFLAG | Total packets | Discarded packets |
| A | 0 | 21 | 0 |
| B | 0 | 21 | 0 |
| C | 0 | 21 | 0 |
| D | 0 | 21 | 0 |
| Mode M0 | |||
|---|---|---|---|
| Quadrant | BADHDUFLAG | Total packets | Discarded packets |
| A | 0 | 17067 | 2 |
| B | 0 | 10430 | 2 |
| C | 0 | 9877 | 2 |
| D | 0 | 13395 | 2 |
| Mode SS | |||
|---|---|---|---|
| Quadrant | BADHDUFLAG | Total packets | Discarded packets |
| A | 0 | 100 | 0 |
| B | 0 | 100 | 0 |
| C | 0 | 100 | 0 |
| D | 0 | 100 | 0 |
| Quadrant | Total seconds | Saturated seconds | Saturation percentage |
|---|---|---|---|
| A | 4887 | 698 | 14.282791% |
| B | 4888 | 31 | 0.634206% |
| C | 4888 | 2 | 0.040917% |
| D | 4888 | 165 | 3.375614% |
Noise dominated data is calculated using 1-second bins in cleaned event files. If a bin has >2000 counts, and if more than 50% of those come from <1% of pixels, then it is considered to be noise-dominated and hence unusable.
| Quadrant | # 1 sec bins | Bins with >0 counts | Bins with >2000 counts | High rate bins dominated by noise | Noise dominated (total time) | Noise dominated (detector-on time) | Marked lightcurve |
|---|---|---|---|---|---|---|---|
| A | 6950 | 4888 | 566 | 566 | 8.14% | 11.58% | 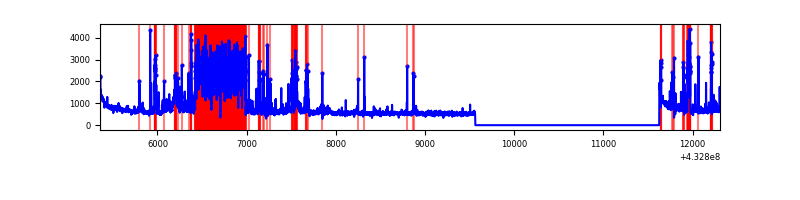 |
| B | 6951 | 4889 | 19 | 19 | 0.27% | 0.39% | 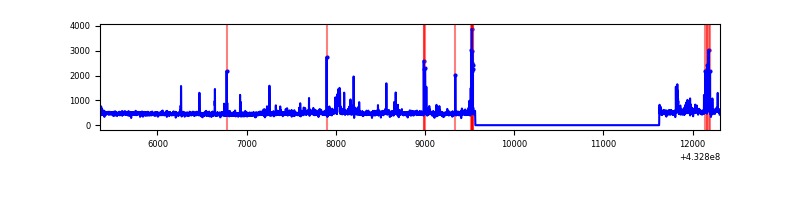 |
| C | 6951 | 4889 | 0 | 0 | 0.00% | 0.00% | 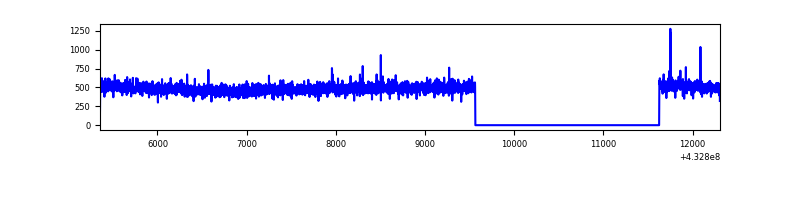 |
| D | 6951 | 4889 | 127 | 127 | 1.83% | 2.60% | 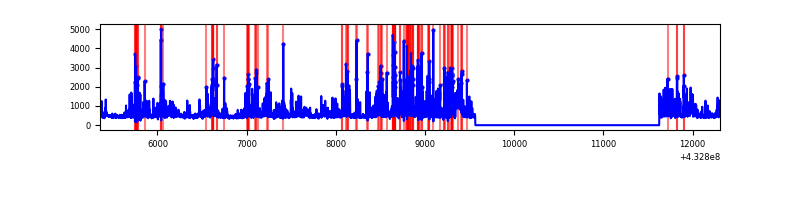 |
Top three noisy pixels from each quadrant. If the there are fewer than three noisy pixels in the level2.evt file, extra rows are filled as -1
| Pixel properties | Quadrant properties | ||||||
|---|---|---|---|---|---|---|---|
| Quadrant | DetID | PixID | Counts | Sigma | Mean | Median | Sigma |
| A | 15 | 222 | 1663297 | 14970.46 | 542 | 532 | 111.1 |
| A | 10 | 83 | 530372 | 4770.34 | 542 | 532 | 111.1 |
| A | 15 | 237 | 303699 | 2729.52 | 542 | 532 | 111.1 |
| B | 5 | 255 | 133866 | 1209.78 | 567 | 552 | 110.2 |
| B | 0 | 229 | 96854 | 873.91 | 567 | 552 | 110.2 |
| B | 0 | 189 | 18934 | 166.81 | 567 | 552 | 110.2 |
| C | 15 | 214 | 207647 | 1618.43 | 552 | 557 | 128.0 |
| C | 0 | 239 | 6382 | 45.52 | 552 | 557 | 128.0 |
| C | 12 | 249 | 5693 | 40.14 | 552 | 557 | 128.0 |
| D | 1 | 52 | 1149027 | 8259.47 | 553 | 539 | 139.1 |
| D | 5 | 32 | 55247 | 393.44 | 553 | 539 | 139.1 |
| D | 13 | 171 | 29362 | 207.28 | 553 | 539 | 139.1 |
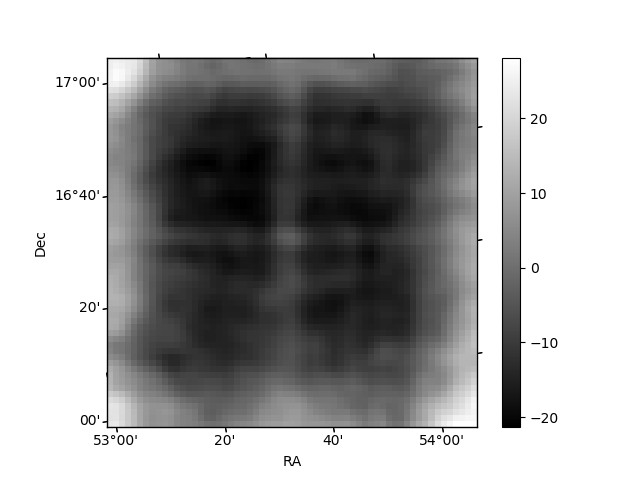
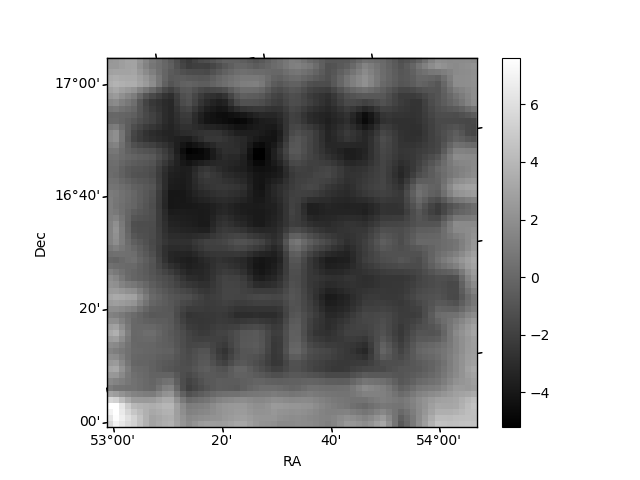
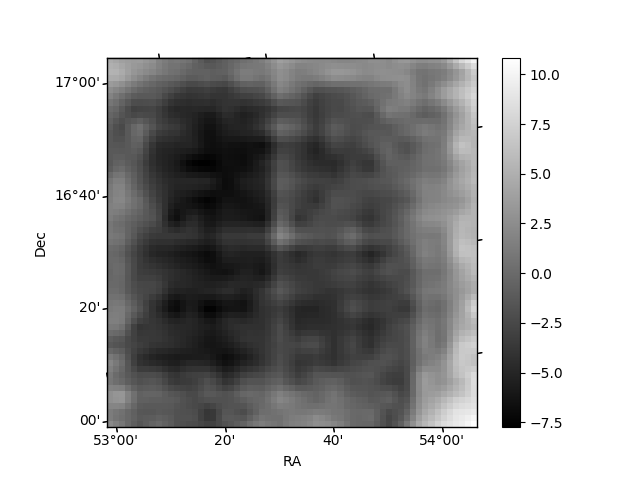
Histogram calculated using DETX and DETY for each event in the final _common_clean file
| Quadrant A | 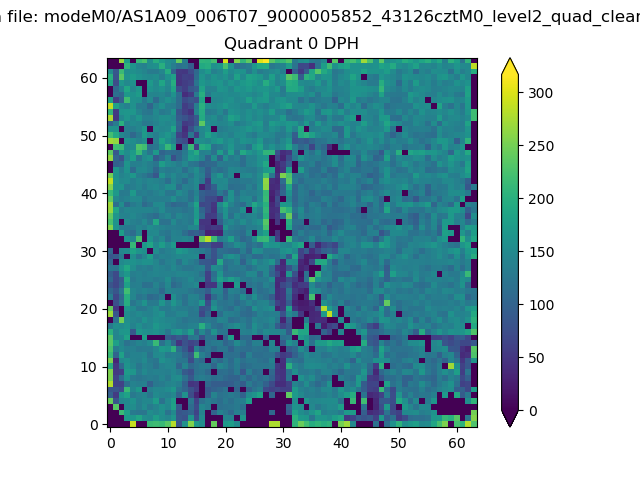 |
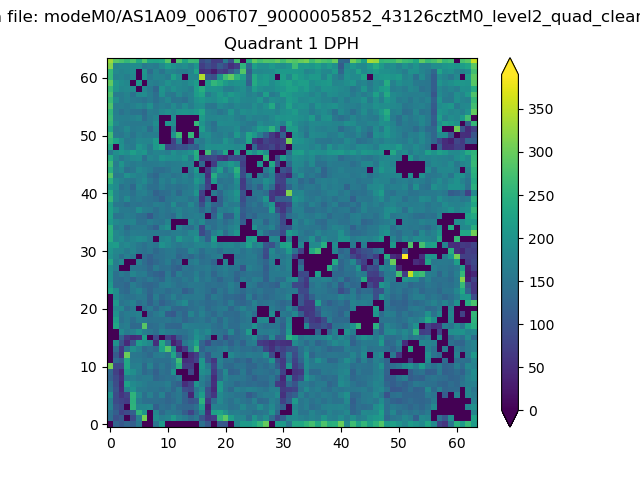 |
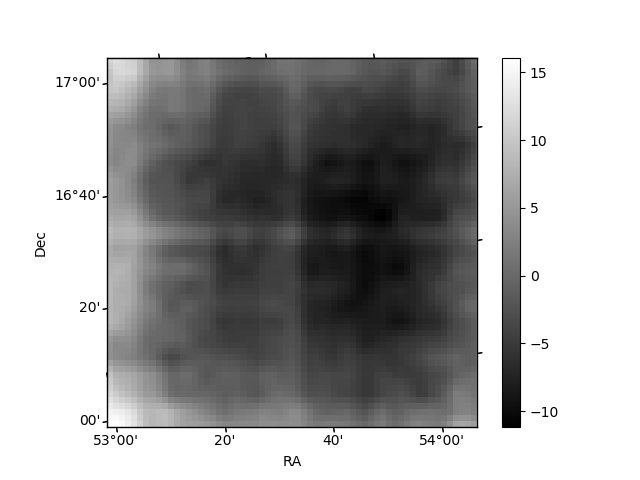
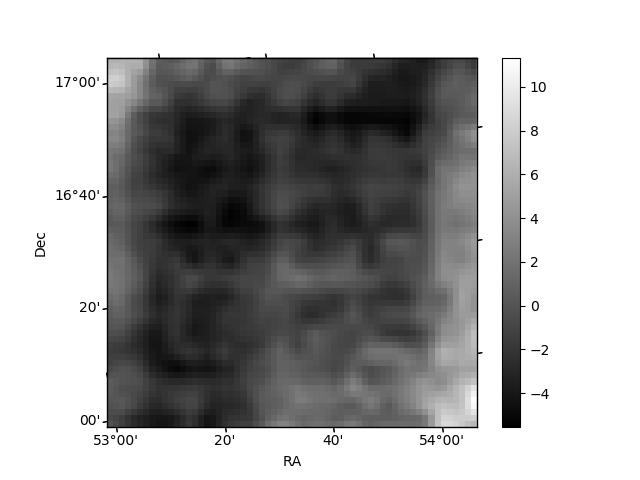
Quadrant B |
|---|---|---|---|
| Quadrant D | 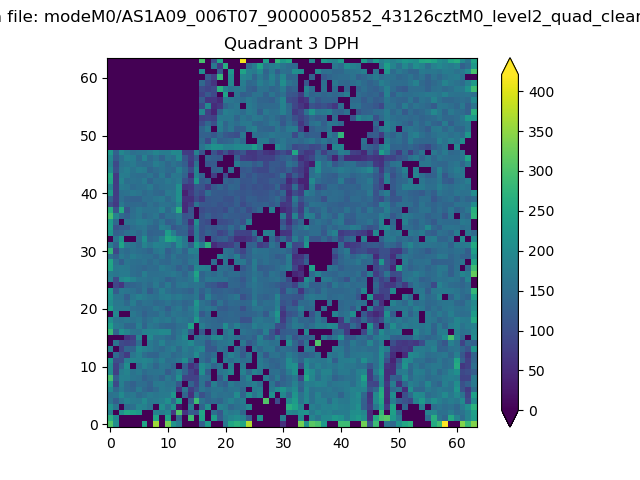 |
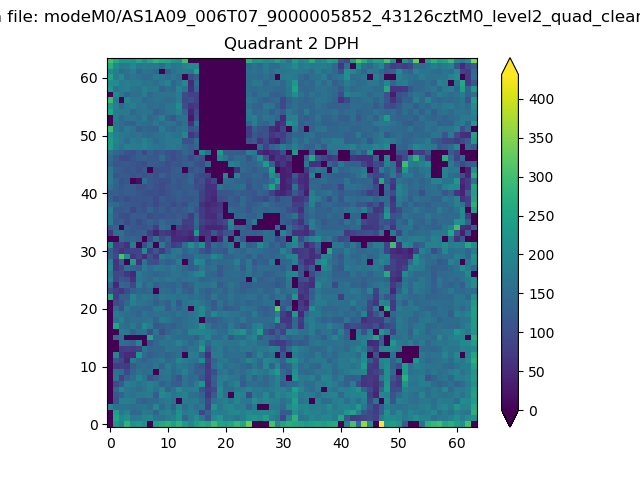 |
Quadrant C |
| Plot type | Count rate plots | Images |
|---|---|---|
| Comparison with Poisson distribution Blue bars denote a histogram of data divided into 1 sec bins. Red curve is a Poisson curve with rate = median count rate of data. |
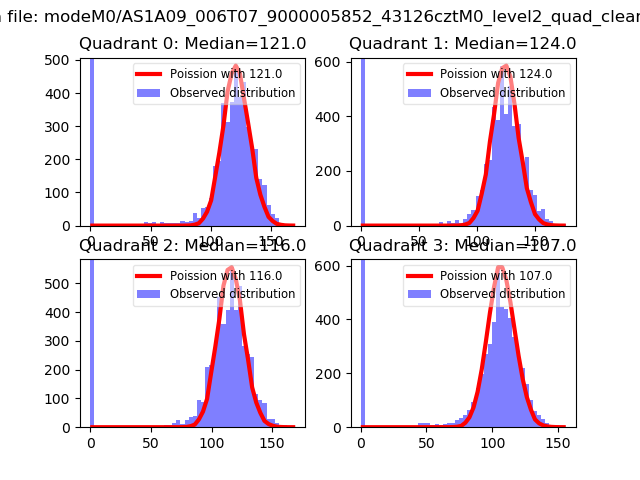 |
 |
| Quadrant-wise count rates Data is divided into 100 sec bins |
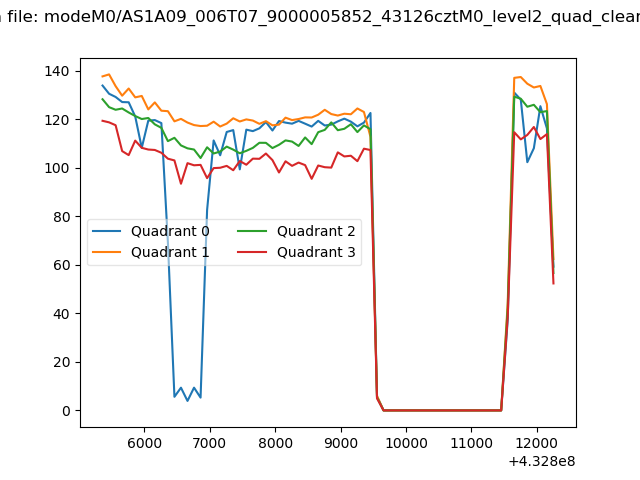 |
|
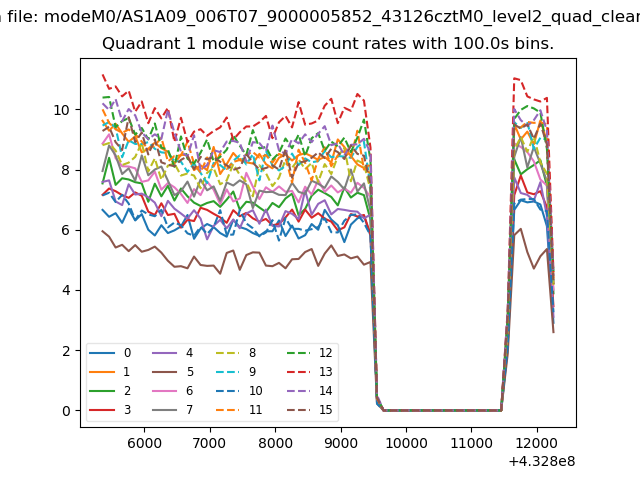
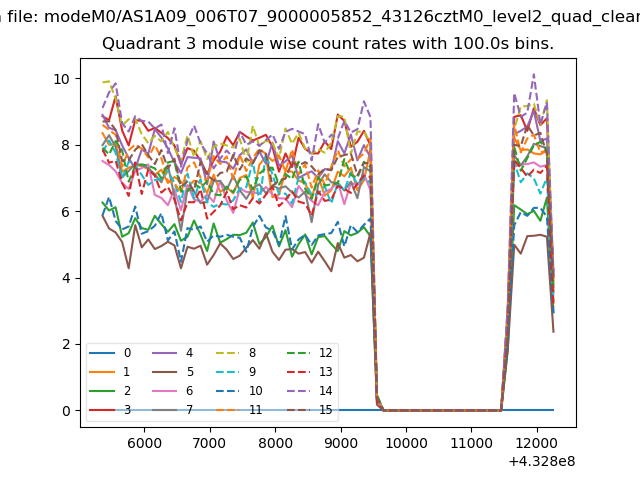
| Module-wise count rates for Quadrant A Data is divided into 100 sec bins |
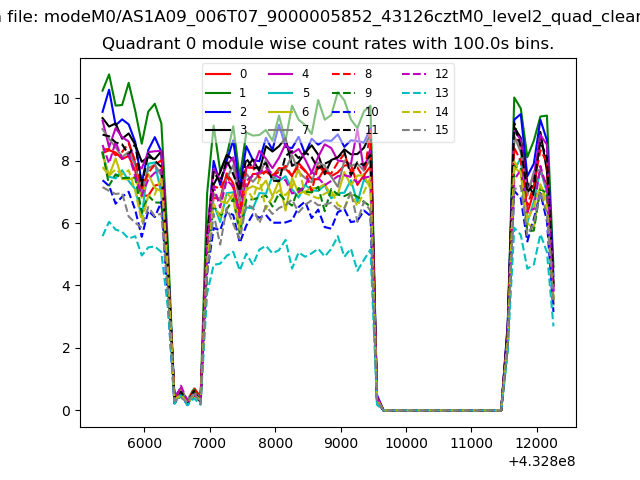 |
 |
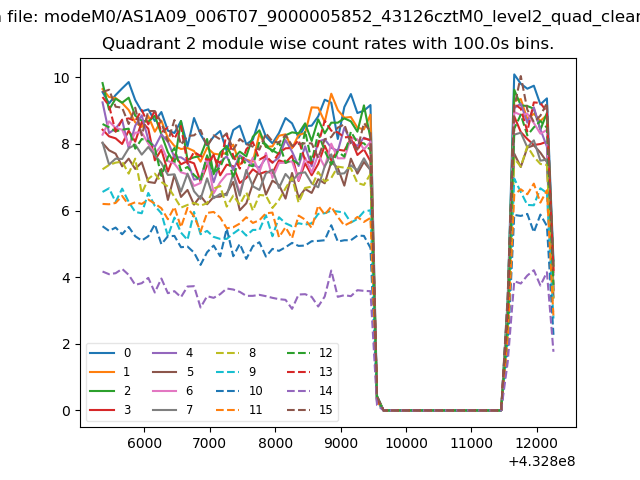
| Module-wise count rates for Quadrant B Data is divided into 100 sec bins |
 |
 |
| Module-wise count rates for Quadrant C Data is divided into 100 sec bins |
 |
 |
| Module-wise count rates for Quadrant D Data is divided into 100 sec bins |
 |
 |
| Parameter | Plot |
|---|---|
| CZT HV Monitor |  |
| D_VDD |  |
| Temperature 1 | 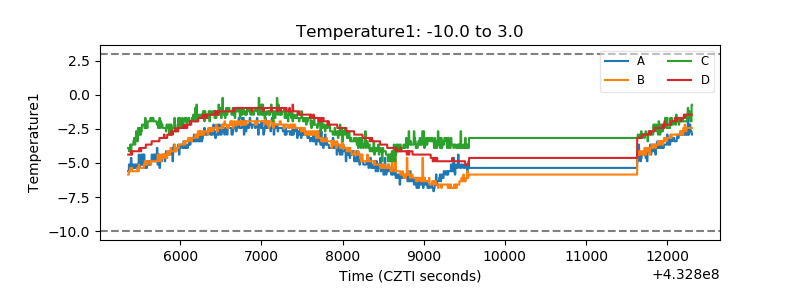 |
| Veto HV Monitor | 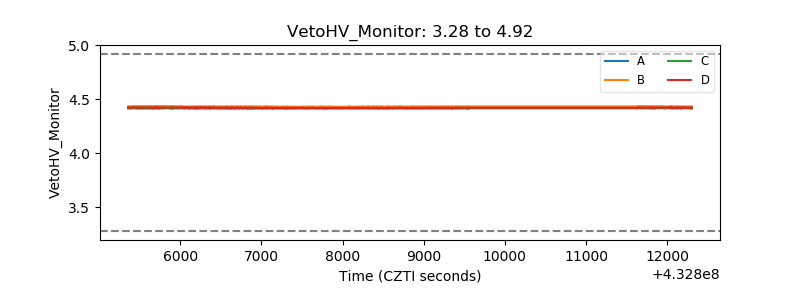 |
| Veto LLD | 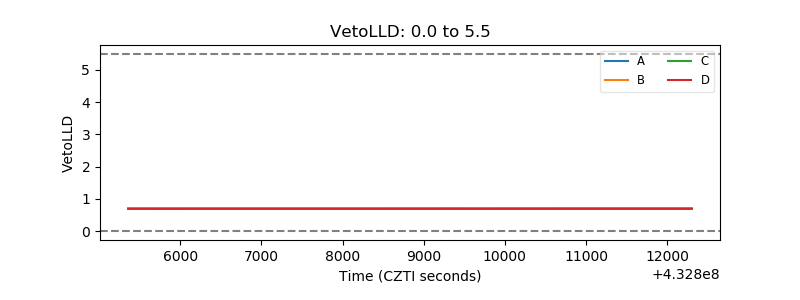 |
| Alpha Counter | 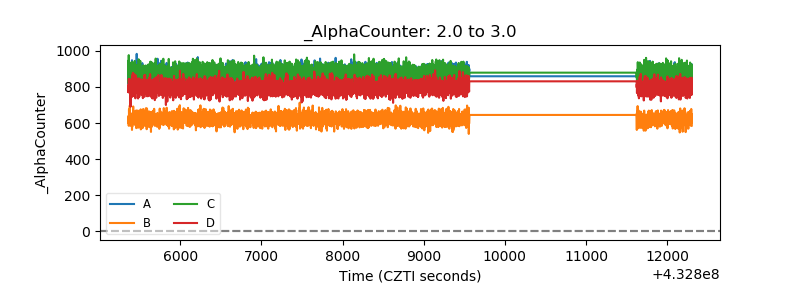 |
| _CPM_Rate | 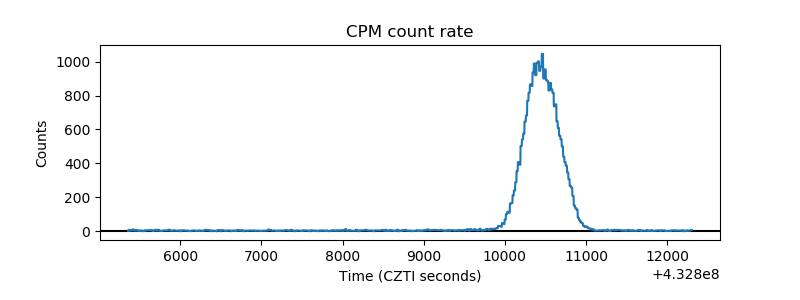 |
| CZT Counter | 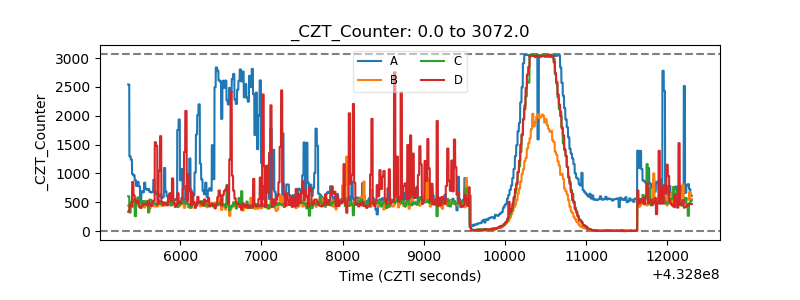 |
| +2.5 Volts monitor | 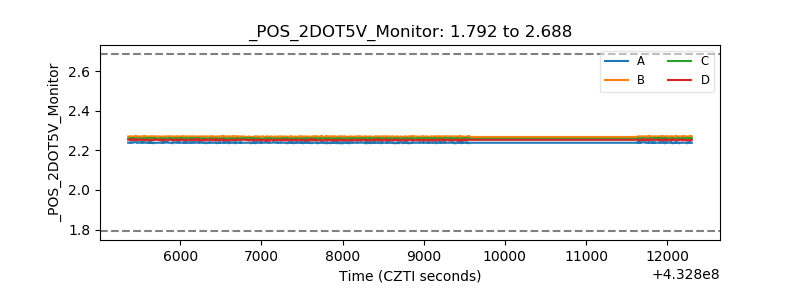 |
| +5 Volts monitor | 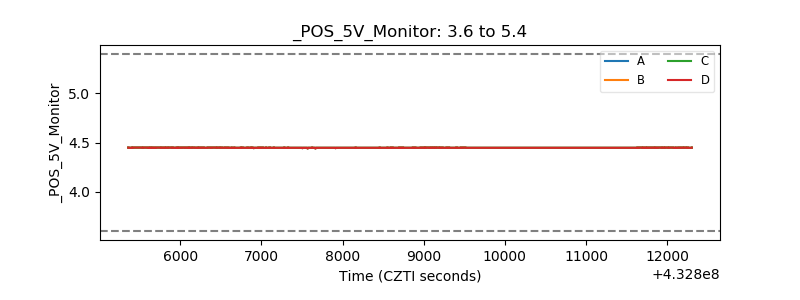 |
| _ROLL_ROT | 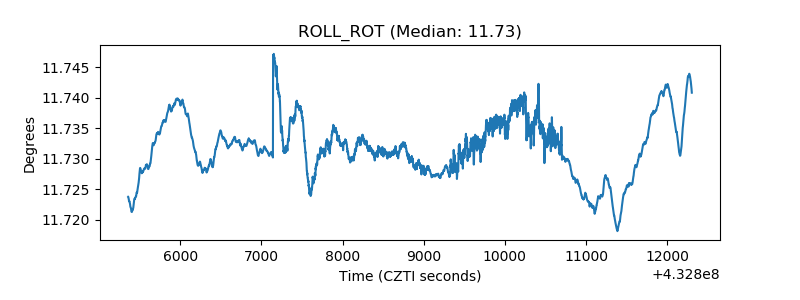 |
| _Roll_DEC | 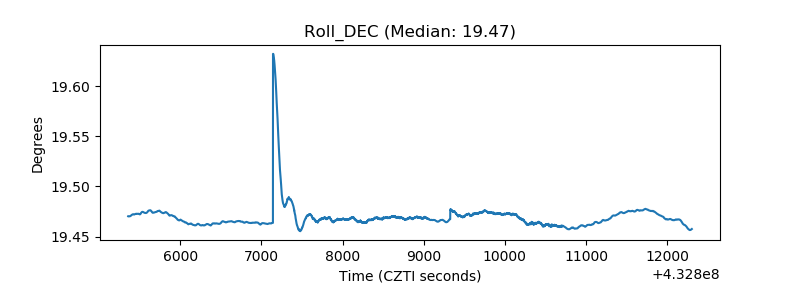 |
| _Roll_RA | 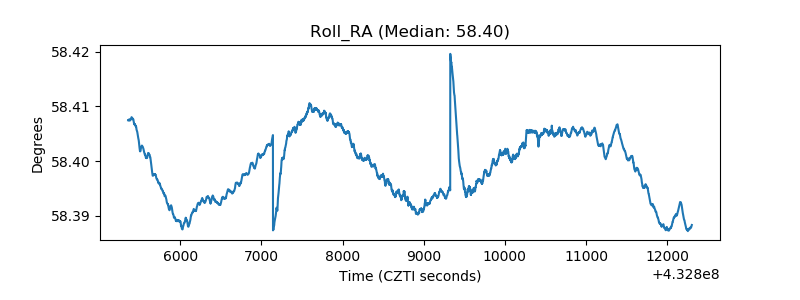 |
| Veto Counter | 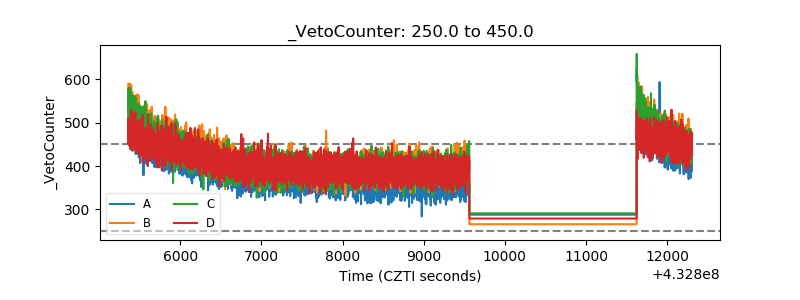 |