| Param | Original file | Final file |
|---|---|---|
| Filename | modeM0/AS1A09_006T07_9000005852_43129cztM0_level2.fits | modeM0/AS1A09_006T07_9000005852_43129cztM0_level2_quad_clean.evt |
| Size (bytes) | 334,946,880 | 84,646,080 |
| Size | 319.4 MB | 80.7 MB |
| Events in quadrant A | 3,771,672 | 552,160 |
| Events in quadrant B | 2,937,540 | 586,884 |
| Events in quadrant C | 2,439,943 | 550,971 |
| Events in quadrant D | 2,845,538 | 510,101 |
| Mode M9 | |||
|---|---|---|---|
| Quadrant | BADHDUFLAG | Total packets | Discarded packets |
| A | 0 | 26 | 0 |
| B | 0 | 27 | 0 |
| C | 0 | 27 | 0 |
| D | 0 | 27 | 0 |
| Mode M0 | |||
|---|---|---|---|
| Quadrant | BADHDUFLAG | Total packets | Discarded packets |
| A | 0 | 14578 | 2 |
| B | 0 | 12315 | 2 |
| C | 0 | 10528 | 2 |
| D | 0 | 12109 | 4 |
| Mode SS | |||
|---|---|---|---|
| Quadrant | BADHDUFLAG | Total packets | Discarded packets |
| A | 0 | 104 | 0 |
| B | 0 | 104 | 0 |
| C | 0 | 104 | 0 |
| D | 0 | 104 | 0 |
| Quadrant | Total seconds | Saturated seconds | Saturation percentage |
|---|---|---|---|
| A | 5186 | 267 | 5.148477% |
| B | 5186 | 51 | 0.983417% |
| C | 5186 | 5 | 0.096413% |
| D | 5185 | 32 | 0.617165% |
Noise dominated data is calculated using 1-second bins in cleaned event files. If a bin has >2000 counts, and if more than 50% of those come from <1% of pixels, then it is considered to be noise-dominated and hence unusable.
| Quadrant | # 1 sec bins | Bins with >0 counts | Bins with >2000 counts | High rate bins dominated by noise | Noise dominated (total time) | Noise dominated (detector-on time) | Marked lightcurve |
|---|---|---|---|---|---|---|---|
| A | 7129 | 5187 | 201 | 201 | 2.82% | 3.88% | 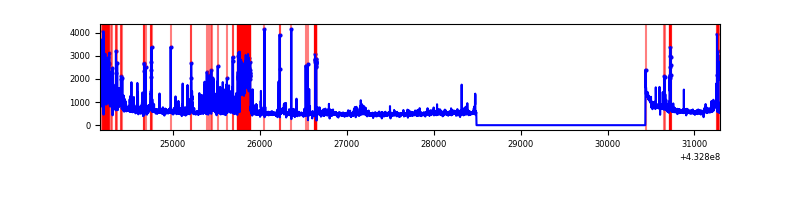 |
| B | 7129 | 5187 | 11 | 11 | 0.15% | 0.21% | 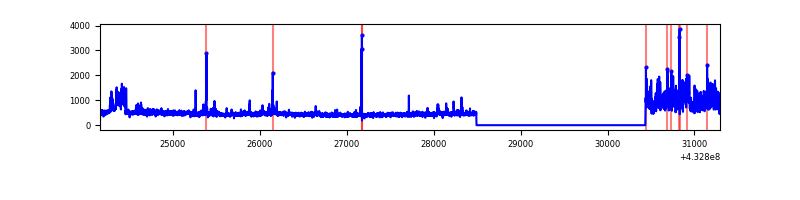 |
| C | 7129 | 5187 | 0 | 0 | 0.00% | 0.00% | 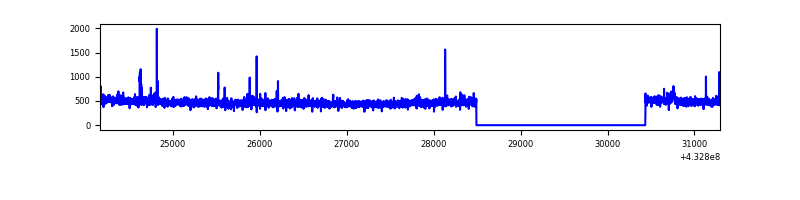 |
| D | 7128 | 5186 | 27 | 27 | 0.38% | 0.52% | 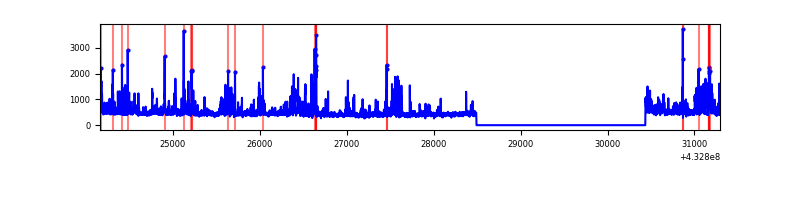 |
Top three noisy pixels from each quadrant. If the there are fewer than three noisy pixels in the level2.evt file, extra rows are filled as -1
| Pixel properties | Quadrant properties | ||||||
|---|---|---|---|---|---|---|---|
| Quadrant | DetID | PixID | Counts | Sigma | Mean | Median | Sigma |
| A | 15 | 222 | 651094 | 5622.9 | 563 | 552 | 115.7 |
| A | 10 | 83 | 587124 | 5069.98 | 563 | 552 | 115.7 |
| A | 15 | 237 | 135573 | 1167.04 | 563 | 552 | 115.7 |
| B | 0 | 186 | 505108 | 4547.37 | 567 | 551 | 111.0 |
| B | 5 | 255 | 78102 | 698.94 | 567 | 551 | 111.0 |
| B | 0 | 229 | 67745 | 605.59 | 567 | 551 | 111.0 |
| C | 15 | 214 | 218189 | 1673.25 | 555 | 560 | 130.1 |
| C | 0 | 239 | 24511 | 184.15 | 555 | 560 | 130.1 |
| C | 3 | 233 | 11203 | 81.83 | 555 | 560 | 130.1 |
| D | 1 | 52 | 586130 | 4265.38 | 556 | 540 | 137.3 |
| D | 13 | 171 | 53087 | 382.75 | 556 | 540 | 137.3 |
| D | 2 | 234 | 25716 | 183.38 | 556 | 540 | 137.3 |
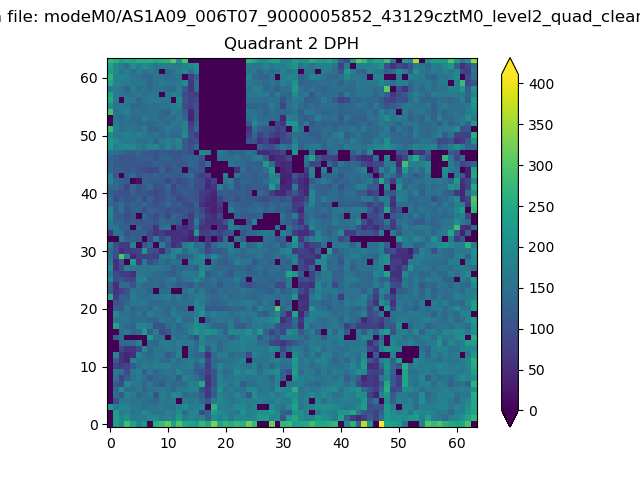
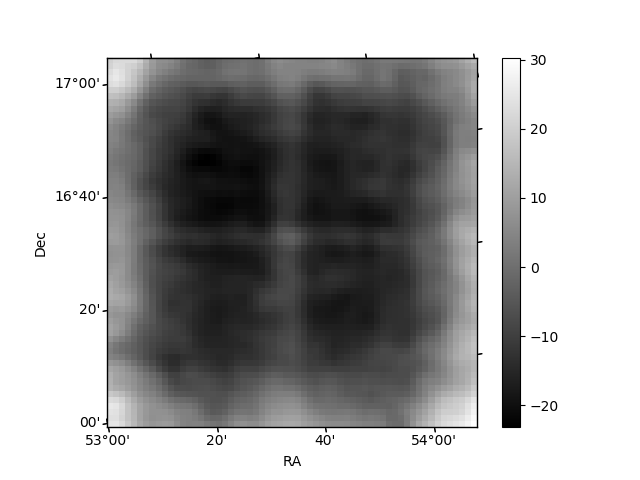
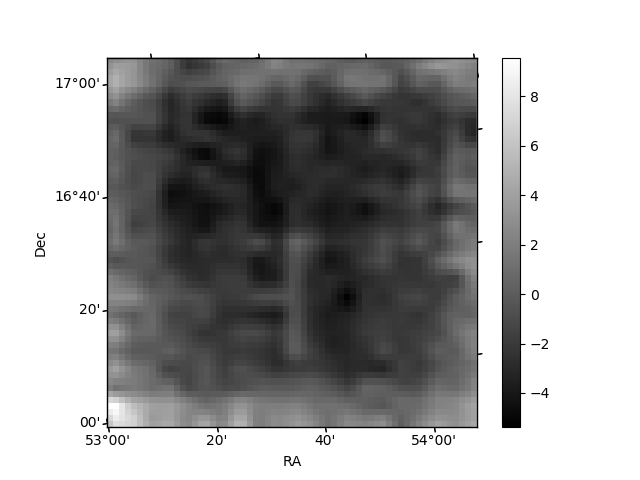
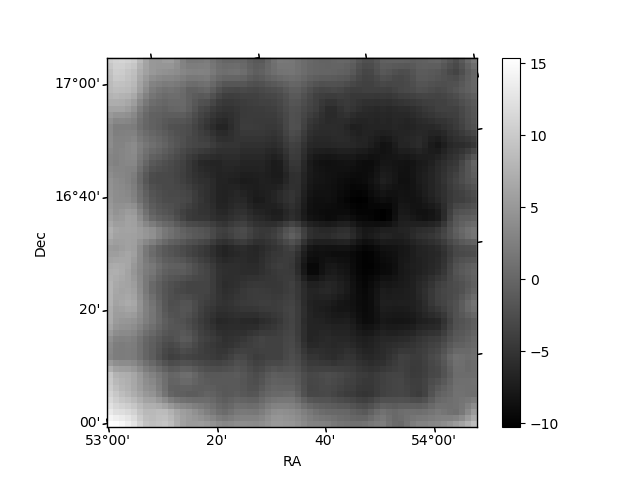
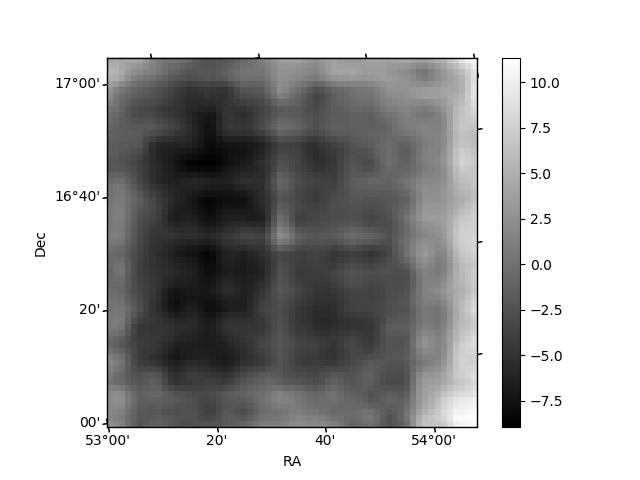
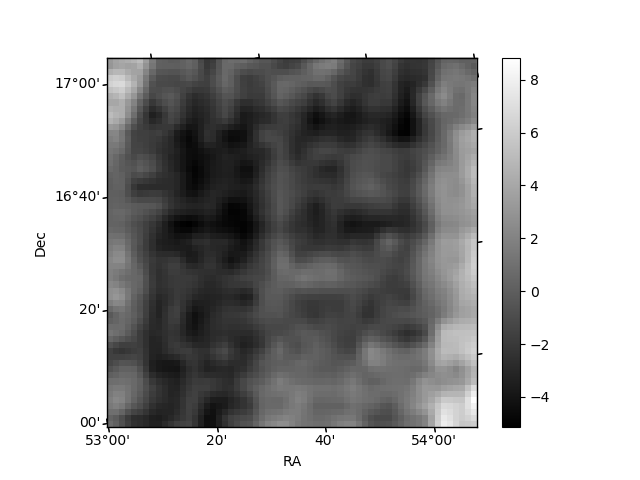
Histogram calculated using DETX and DETY for each event in the final _common_clean file
| Quadrant A | 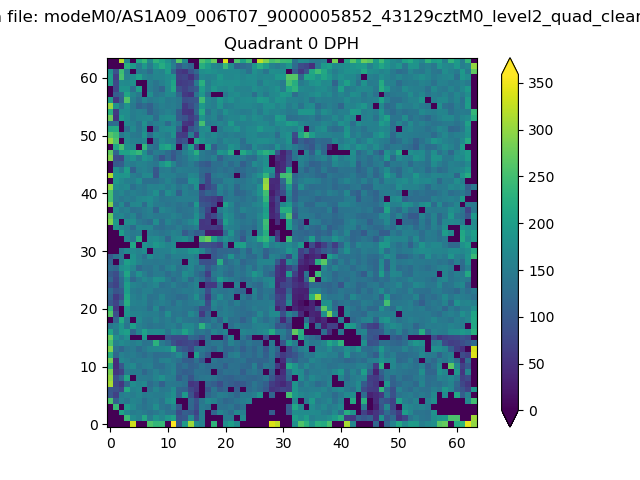 |
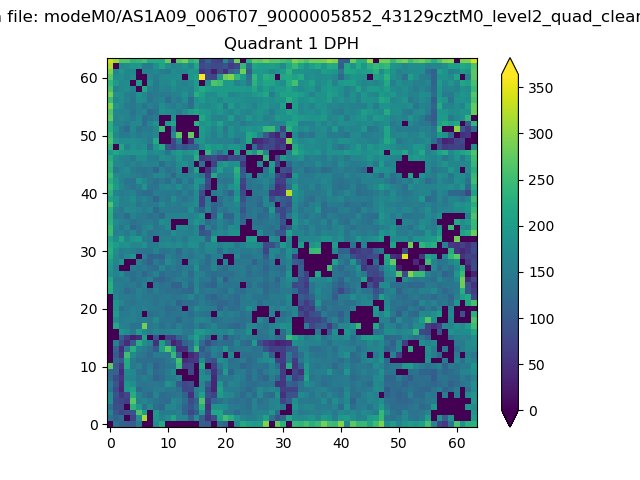 |
Quadrant B |
|---|---|---|---|
| Quadrant D | 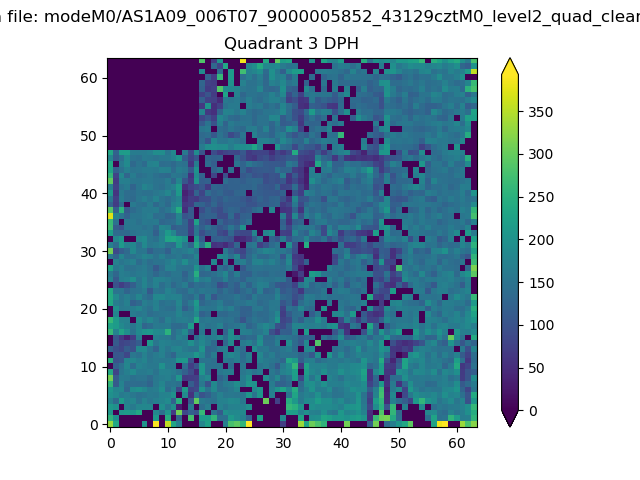 |
 |
Quadrant C |
| Plot type | Count rate plots | Images |
|---|---|---|
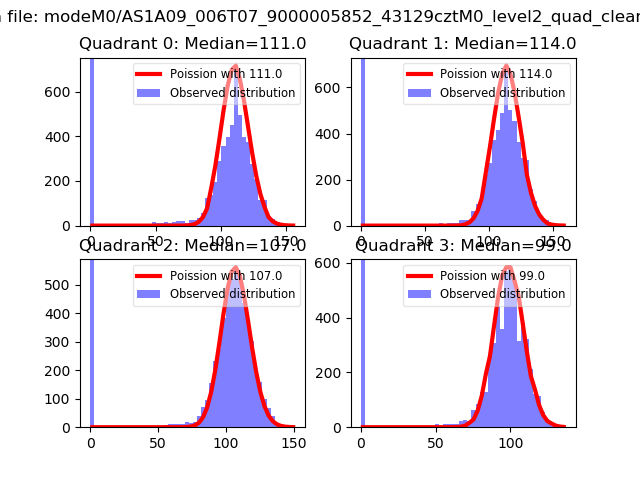
| Comparison with Poisson distribution Blue bars denote a histogram of data divided into 1 sec bins. Red curve is a Poisson curve with rate = median count rate of data. |
 |
 |
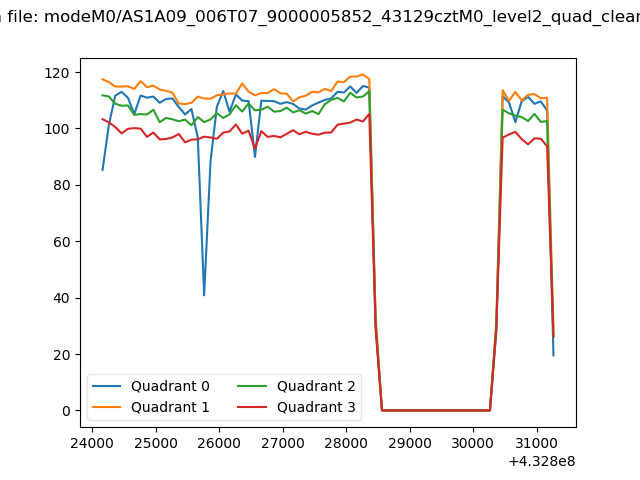
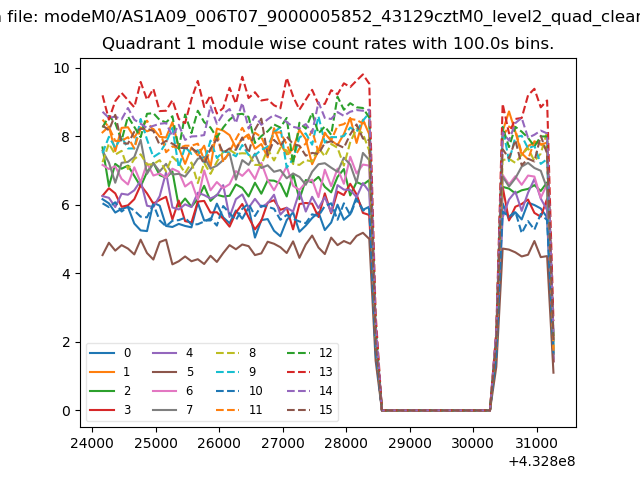
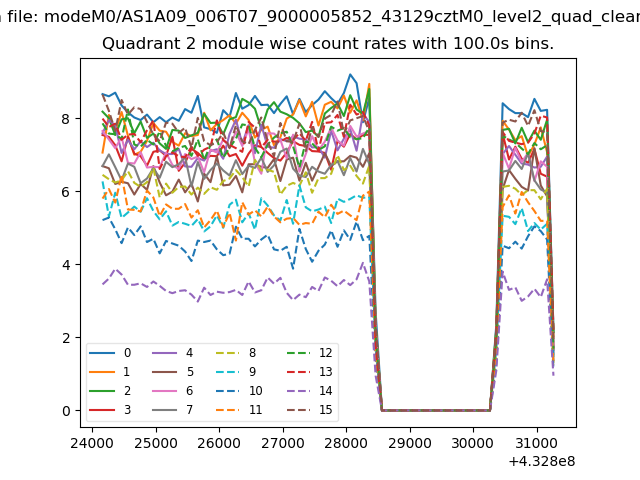
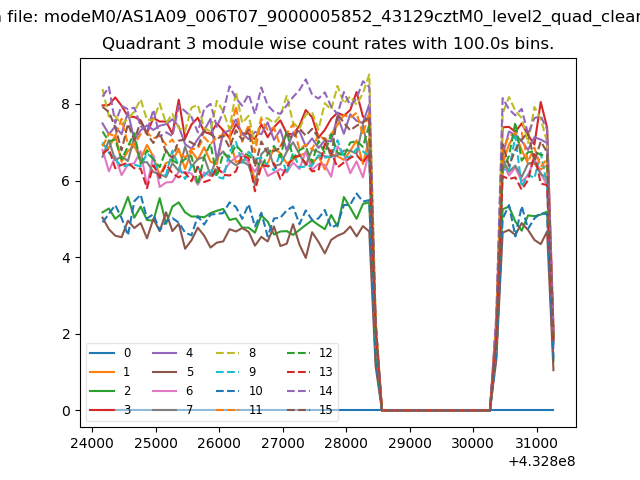
| Quadrant-wise count rates Data is divided into 100 sec bins |
 |
|
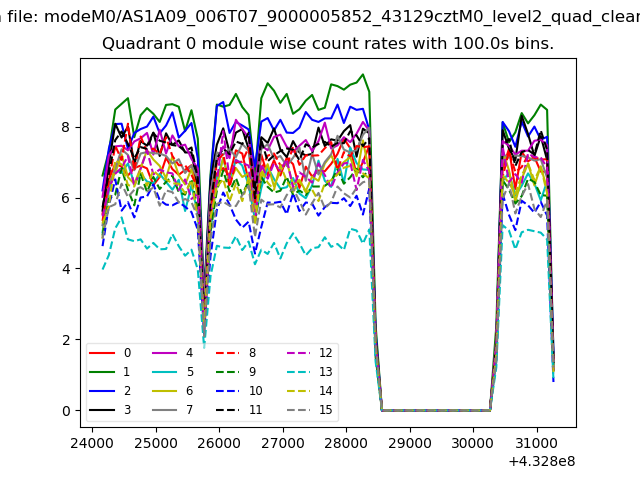
| Module-wise count rates for Quadrant A Data is divided into 100 sec bins |
 |
 |
| Module-wise count rates for Quadrant B Data is divided into 100 sec bins |
 |
 |
| Module-wise count rates for Quadrant C Data is divided into 100 sec bins |
 |
 |
| Module-wise count rates for Quadrant D Data is divided into 100 sec bins |
 |
 |
| Parameter | Plot |
|---|---|
| CZT HV Monitor | 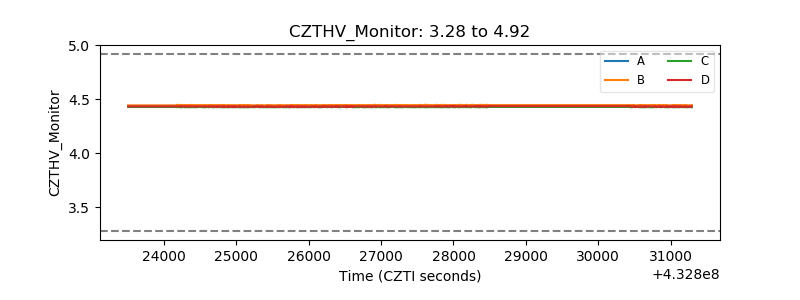 |
| D_VDD | 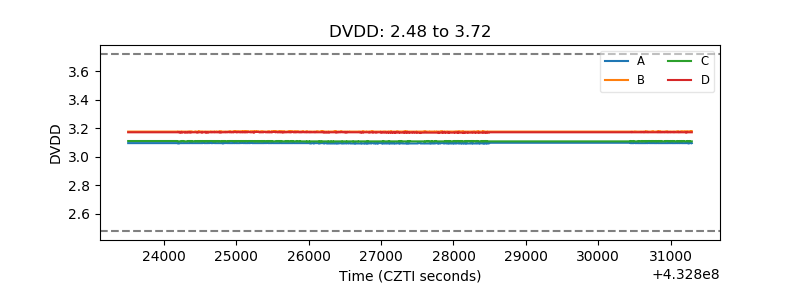 |
| Temperature 1 | 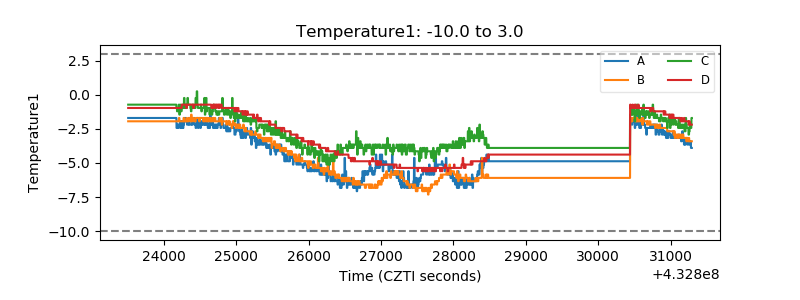 |
| Veto HV Monitor |  |
| Veto LLD | 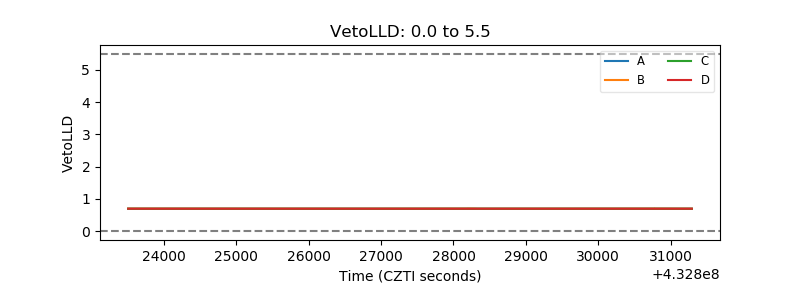 |
| Alpha Counter | 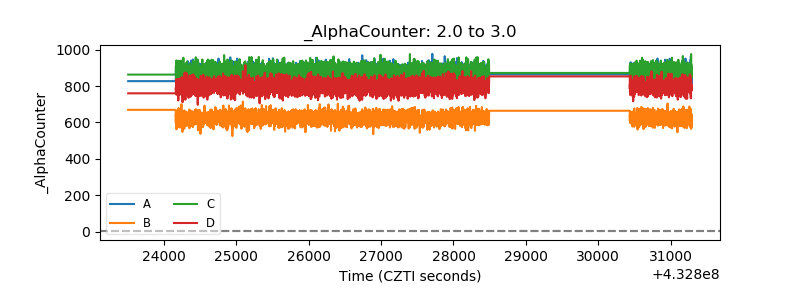 |
| _CPM_Rate | 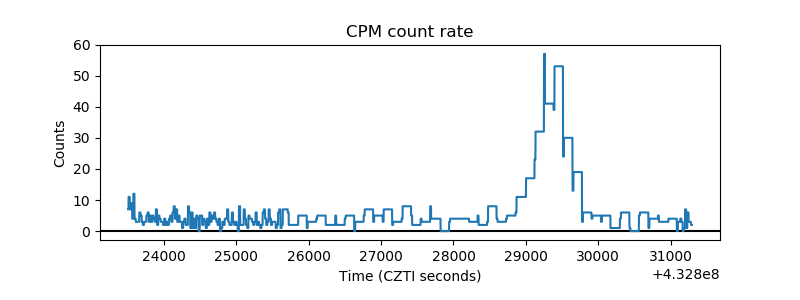 |
| CZT Counter | 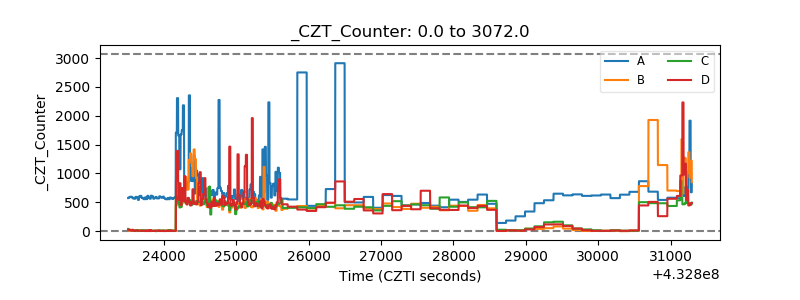 |
| +2.5 Volts monitor | 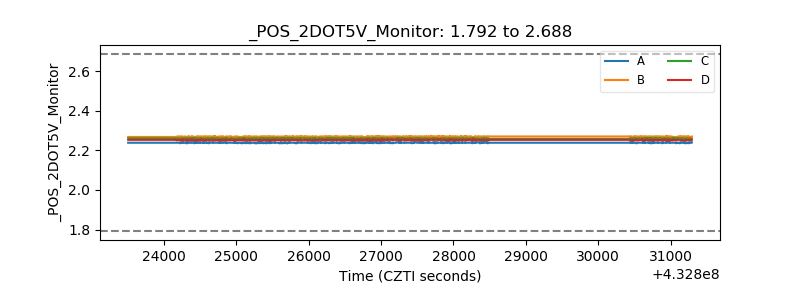 |
| +5 Volts monitor | 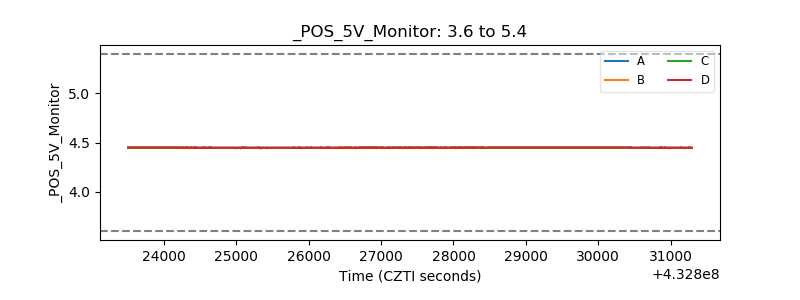 |
| _ROLL_ROT | 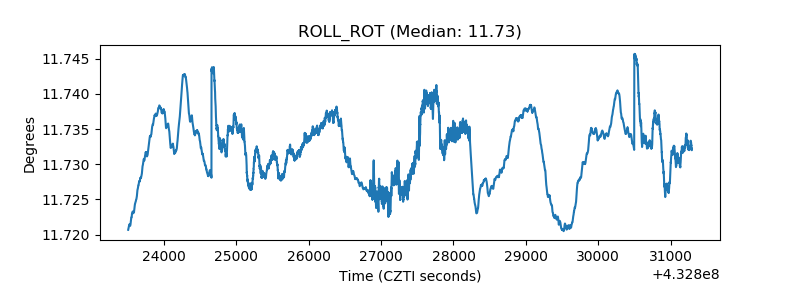 |
| _Roll_DEC | 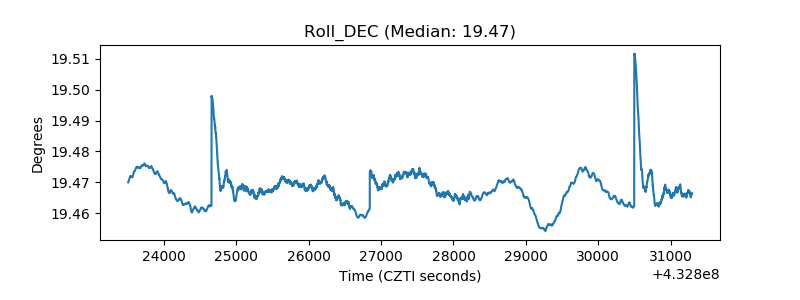 |
| _Roll_RA | 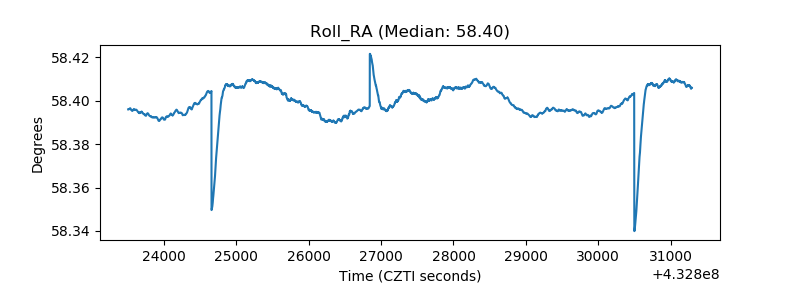 |
| Veto Counter | 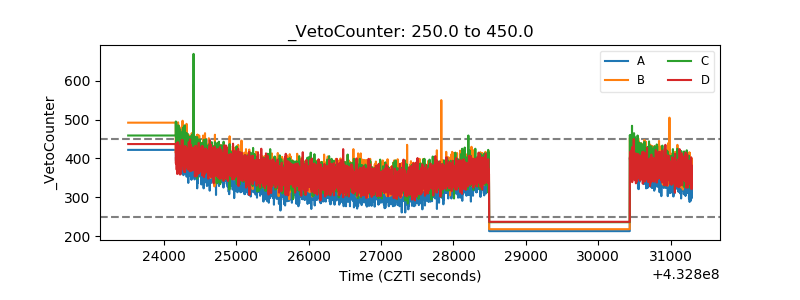 |