| Param | Original file | Final file |
|---|---|---|
| Filename | modeM0/AS1A09_006T07_9000005852_43130cztM0_level2.fits | modeM0/AS1A09_006T07_9000005852_43130cztM0_level2_quad_clean.evt |
| Size (bytes) | 339,024,960 | 89,939,520 |
| Size | 323.3 MB | 85.8 MB |
| Events in quadrant A | 3,311,660 | 603,049 |
| Events in quadrant B | 3,194,303 | 615,471 |
| Events in quadrant C | 2,667,157 | 581,866 |
| Events in quadrant D | 2,948,208 | 537,918 |
| Mode M9 | |||
|---|---|---|---|
| Quadrant | BADHDUFLAG | Total packets | Discarded packets |
| A | 0 | 32 | 0 |
| B | 0 | 32 | 0 |
| C | 0 | 33 | 1 |
| D | 0 | 32 | 0 |
| Mode M0 | |||
|---|---|---|---|
| Quadrant | BADHDUFLAG | Total packets | Discarded packets |
| A | 0 | 13334 | 2 |
| B | 0 | 13355 | 2 |
| C | 0 | 11432 | 2 |
| D | 0 | 12725 | 2 |
| Mode SS | |||
|---|---|---|---|
| Quadrant | BADHDUFLAG | Total packets | Discarded packets |
| A | 0 | 112 | 0 |
| B | 0 | 112 | 0 |
| C | 0 | 112 | 0 |
| D | 0 | 112 | 0 |
| Quadrant | Total seconds | Saturated seconds | Saturation percentage |
|---|---|---|---|
| A | 5502 | 53 | 0.963286% |
| B | 5501 | 66 | 1.199782% |
| C | 5501 | 9 | 0.163607% |
| D | 5501 | 60 | 1.090711% |
Noise dominated data is calculated using 1-second bins in cleaned event files. If a bin has >2000 counts, and if more than 50% of those come from <1% of pixels, then it is considered to be noise-dominated and hence unusable.
| Quadrant | # 1 sec bins | Bins with >0 counts | Bins with >2000 counts | High rate bins dominated by noise | Noise dominated (total time) | Noise dominated (detector-on time) | Marked lightcurve |
|---|---|---|---|---|---|---|---|
| A | 7085 | 5503 | 29 | 29 | 0.41% | 0.53% | 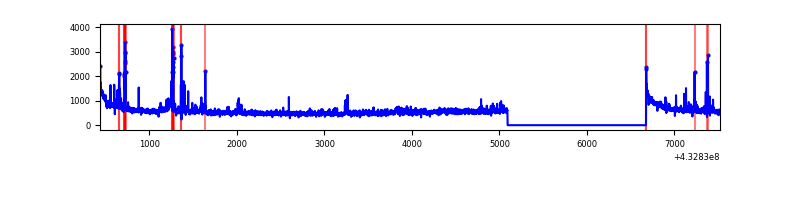 |
| B | 7084 | 5502 | 28 | 28 | 0.40% | 0.51% | 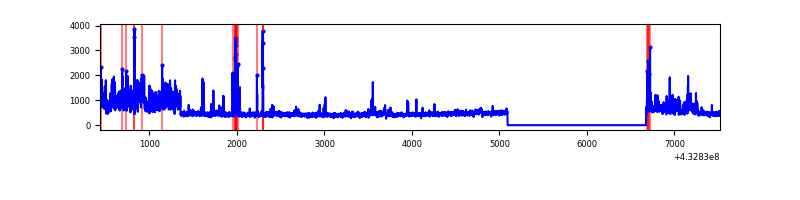 |
| C | 7084 | 5502 | 0 | 0 | 0.00% | 0.00% | 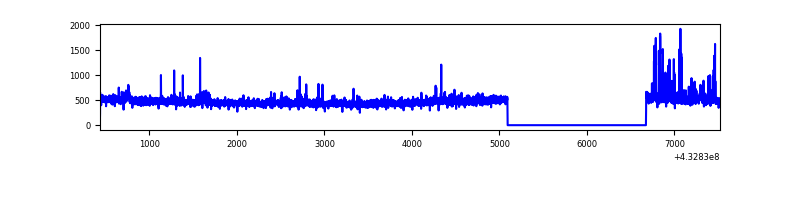 |
| D | 7084 | 5502 | 35 | 35 | 0.49% | 0.64% | 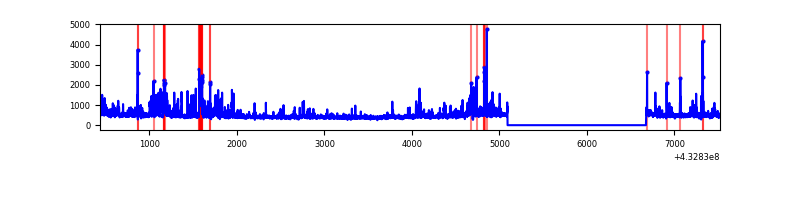 |
Top three noisy pixels from each quadrant. If the there are fewer than three noisy pixels in the level2.evt file, extra rows are filled as -1
| Pixel properties | Quadrant properties | ||||||
|---|---|---|---|---|---|---|---|
| Quadrant | DetID | PixID | Counts | Sigma | Mean | Median | Sigma |
| A | 10 | 83 | 617757 | 4948.23 | 599 | 585 | 124.7 |
| A | 15 | 222 | 147921 | 1181.28 | 599 | 585 | 124.7 |
| A | 12 | 189 | 121119 | 966.39 | 599 | 585 | 124.7 |
| B | 0 | 186 | 544328 | 4668.81 | 597 | 580 | 116.5 |
| B | 0 | 229 | 148821 | 1272.85 | 597 | 580 | 116.5 |
| B | 5 | 255 | 104750 | 894.44 | 597 | 580 | 116.5 |
| C | 15 | 214 | 229637 | 1662.22 | 585 | 590 | 137.8 |
| C | 0 | 239 | 122059 | 881.51 | 585 | 590 | 137.8 |
| C | 12 | 249 | 13422 | 93.12 | 585 | 590 | 137.8 |
| D | 1 | 52 | 589955 | 4066.5 | 584 | 566 | 144.9 |
| D | 2 | 234 | 27318 | 184.58 | 584 | 566 | 144.9 |
| D | 5 | 70 | 18889 | 126.42 | 584 | 566 | 144.9 |
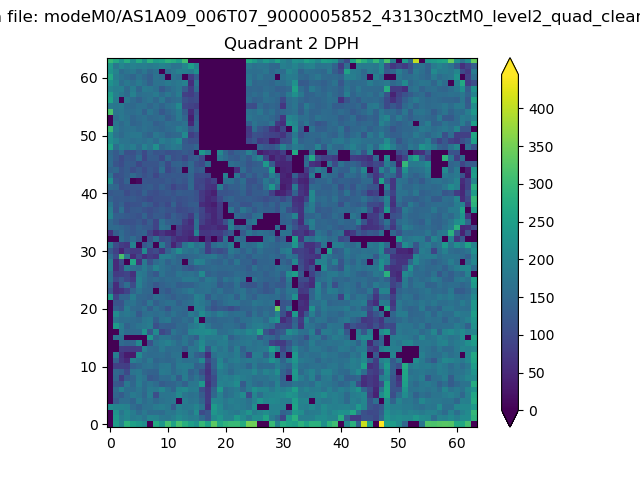
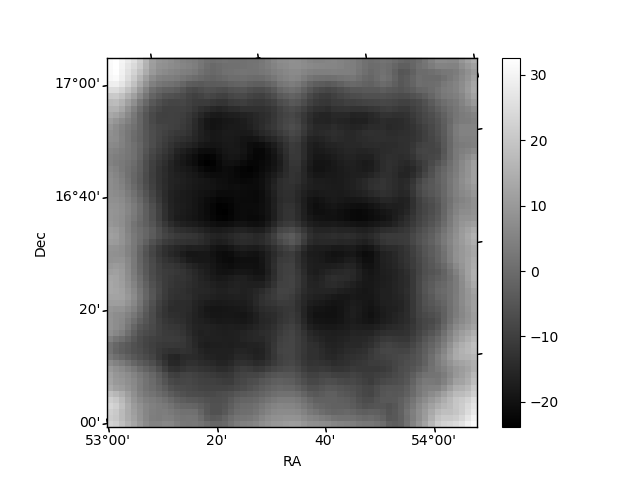
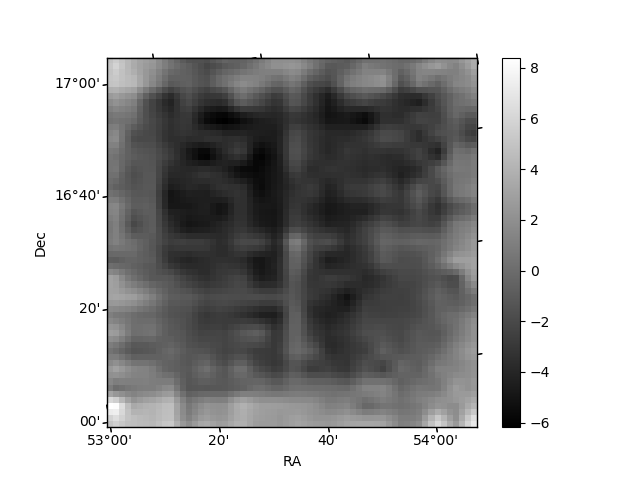
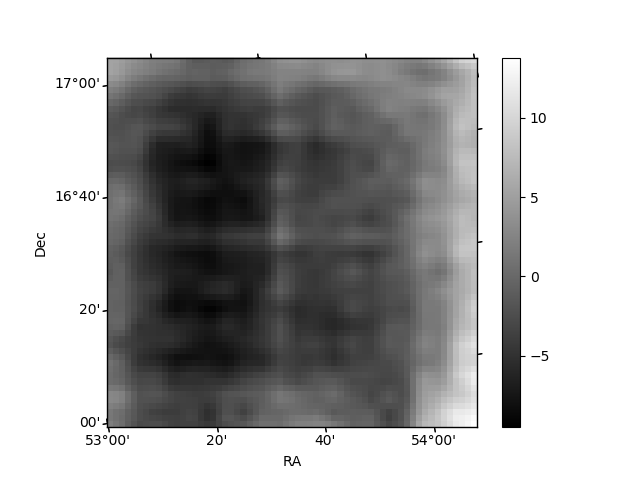
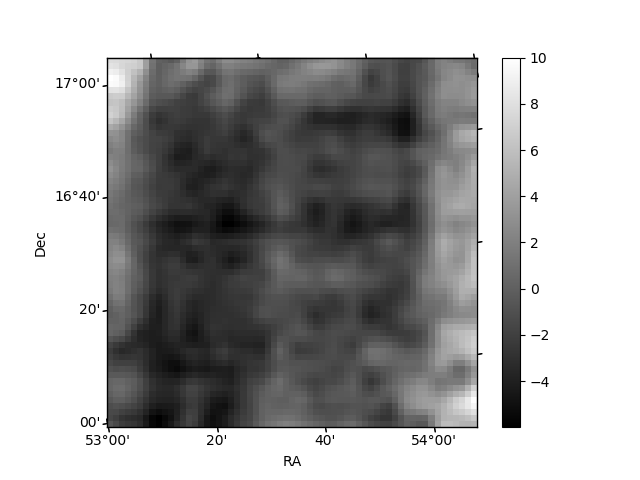
Histogram calculated using DETX and DETY for each event in the final _common_clean file
| Quadrant A | 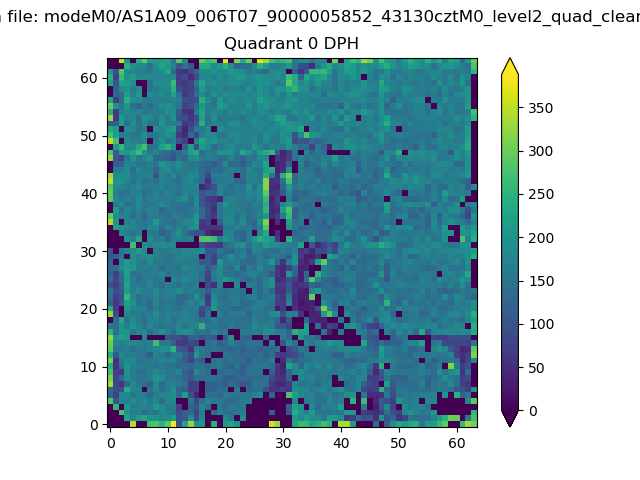 |
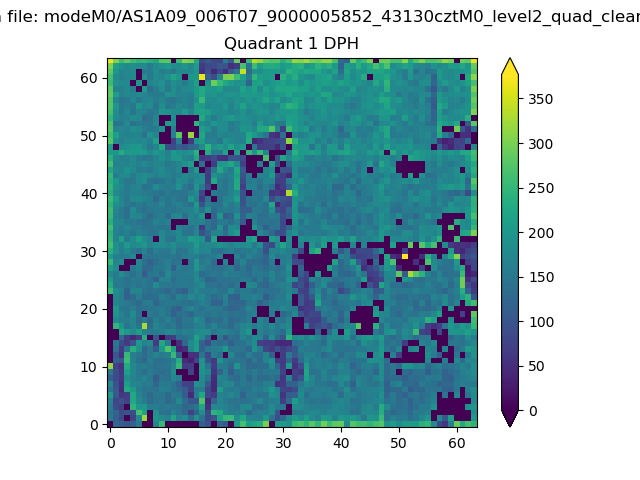 |
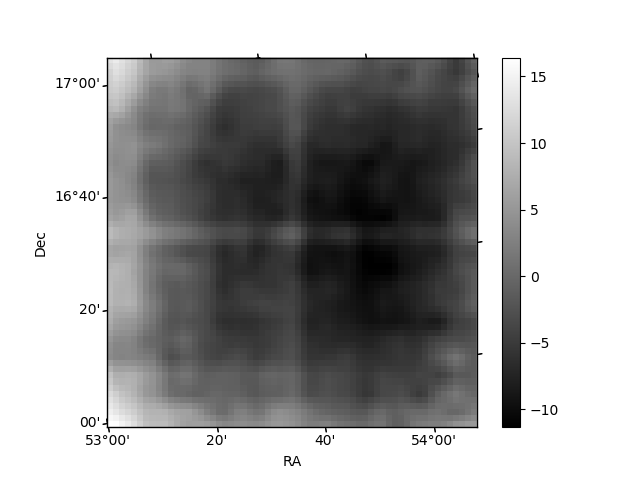
Quadrant B |
|---|---|---|---|
| Quadrant D | 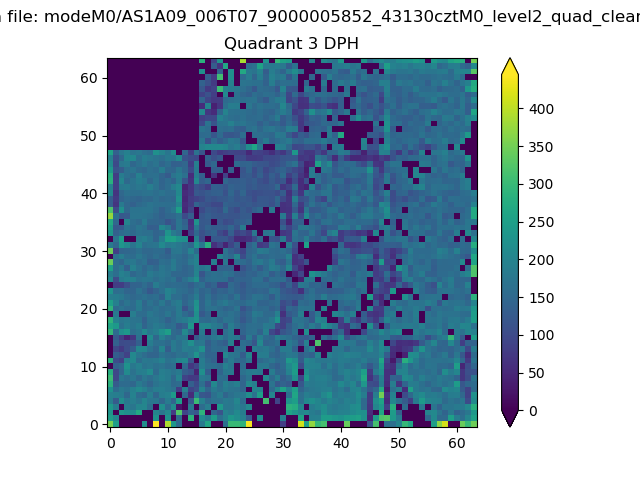 |
 |
Quadrant C |
| Plot type | Count rate plots | Images |
|---|---|---|
| Comparison with Poisson distribution Blue bars denote a histogram of data divided into 1 sec bins. Red curve is a Poisson curve with rate = median count rate of data. |
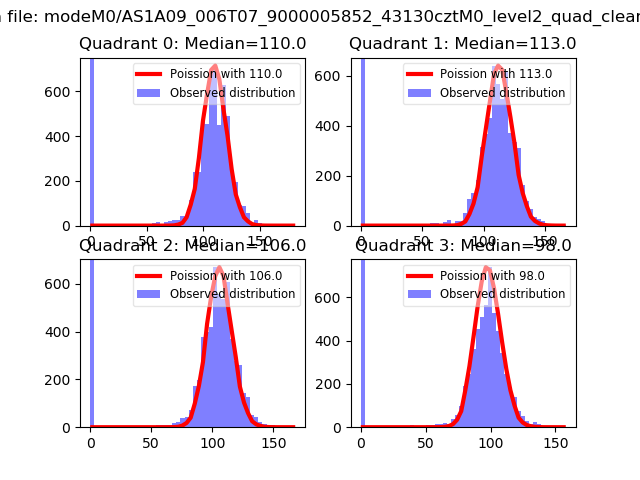 |
 |
| Quadrant-wise count rates Data is divided into 100 sec bins |
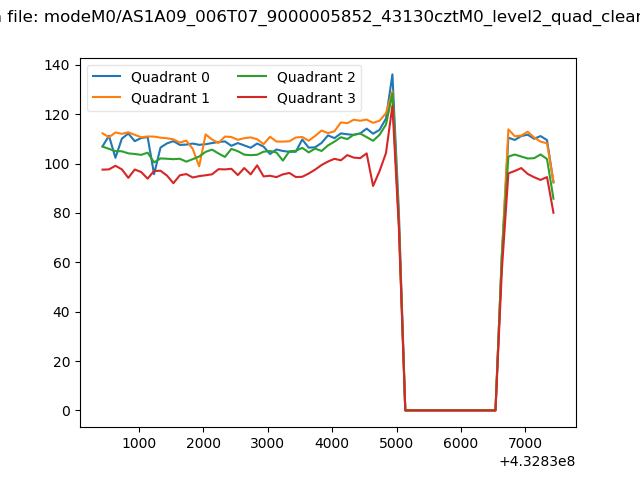 |
|
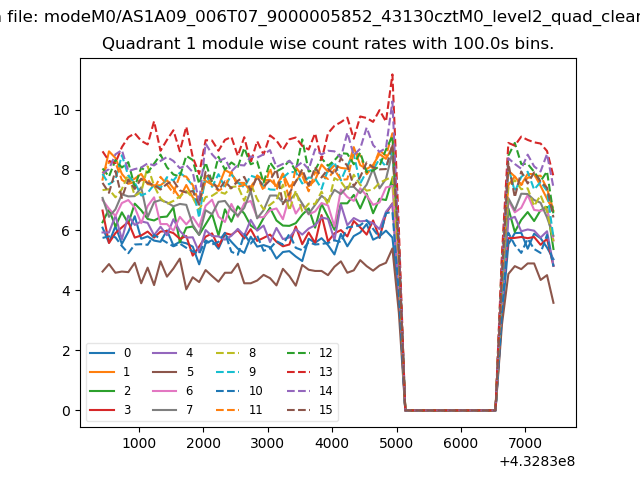
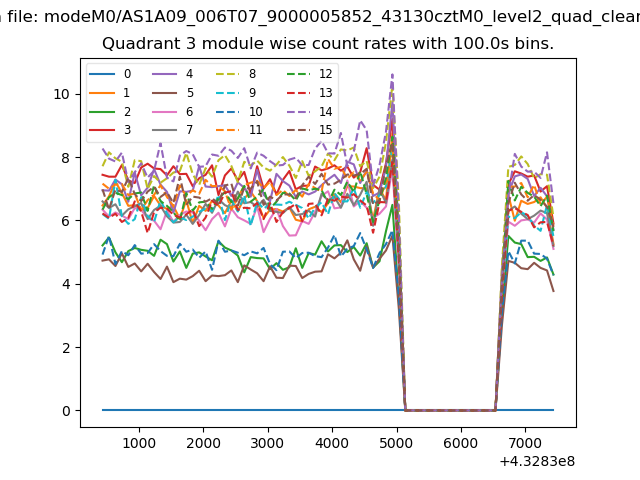
| Module-wise count rates for Quadrant A Data is divided into 100 sec bins |
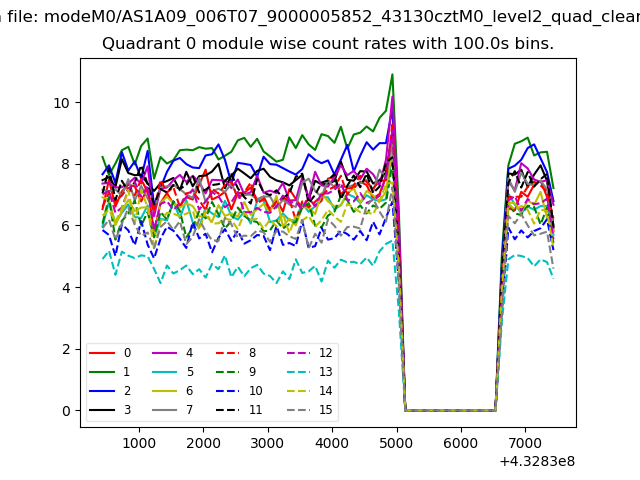 |
 |
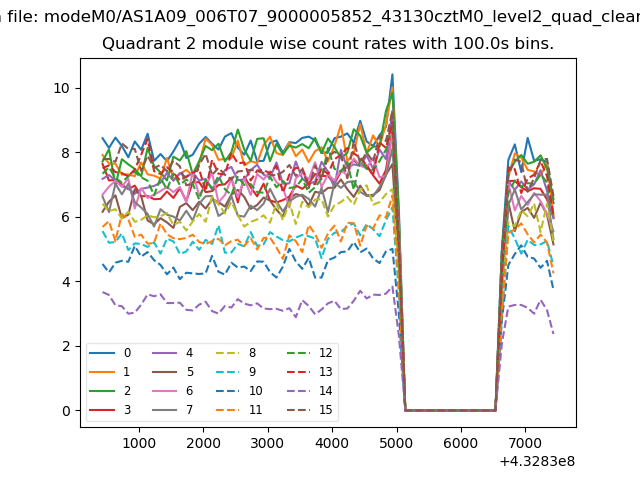
| Module-wise count rates for Quadrant B Data is divided into 100 sec bins |
 |
 |
| Module-wise count rates for Quadrant C Data is divided into 100 sec bins |
 |
 |
| Module-wise count rates for Quadrant D Data is divided into 100 sec bins |
 |
 |
| Parameter | Plot |
|---|---|
| CZT HV Monitor | 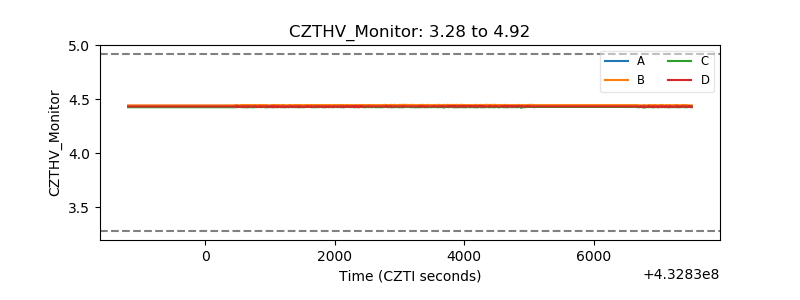 |
| D_VDD | 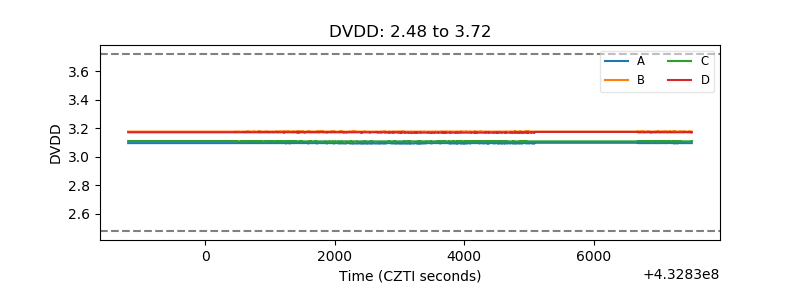 |
| Temperature 1 | 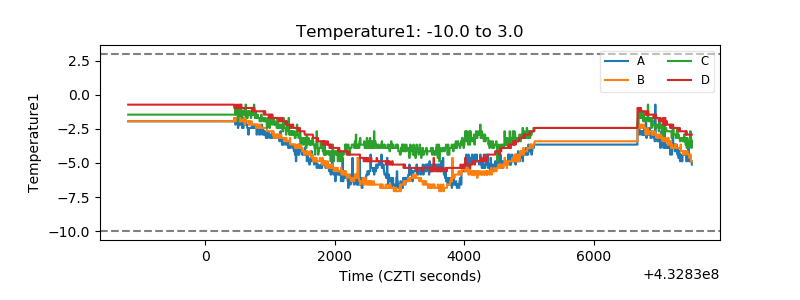 |
| Veto HV Monitor |  |
| Veto LLD | 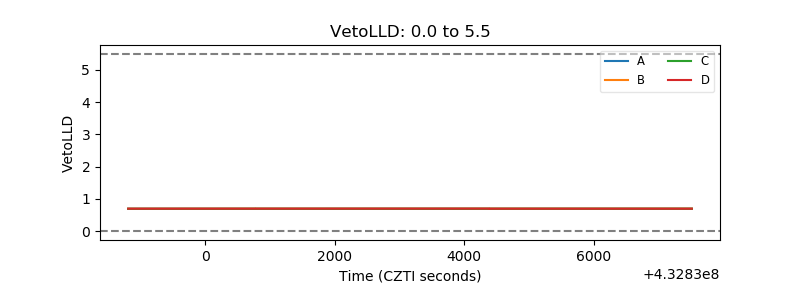 |
| Alpha Counter | 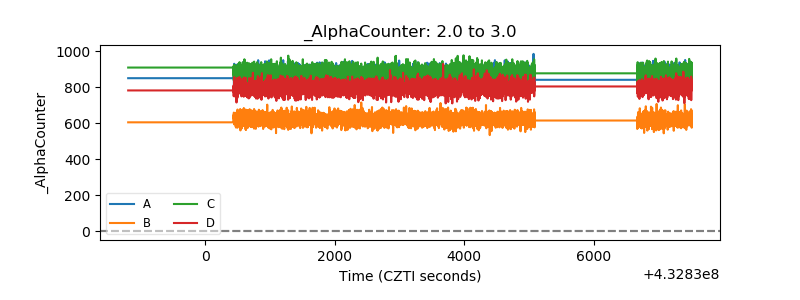 |
| _CPM_Rate |  |
| CZT Counter | 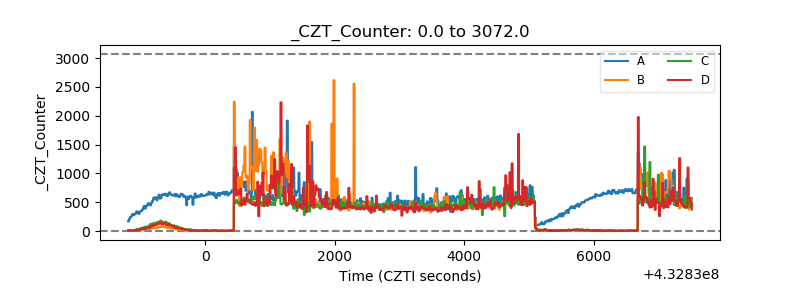 |
| +2.5 Volts monitor | 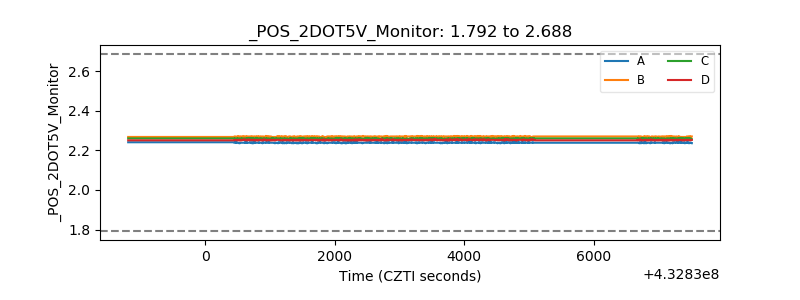 |
| +5 Volts monitor | 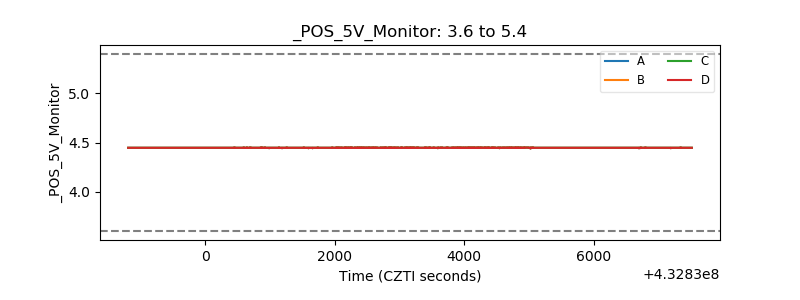 |
| _ROLL_ROT | 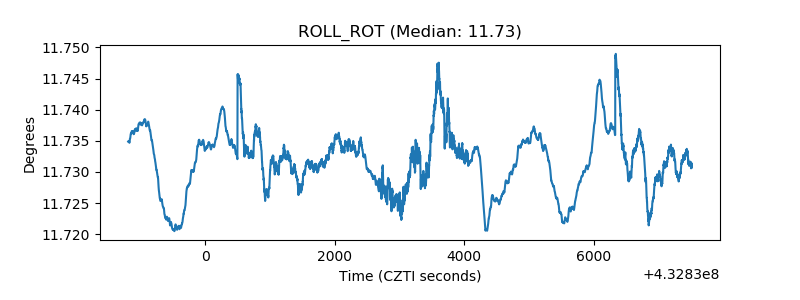 |
| _Roll_DEC | 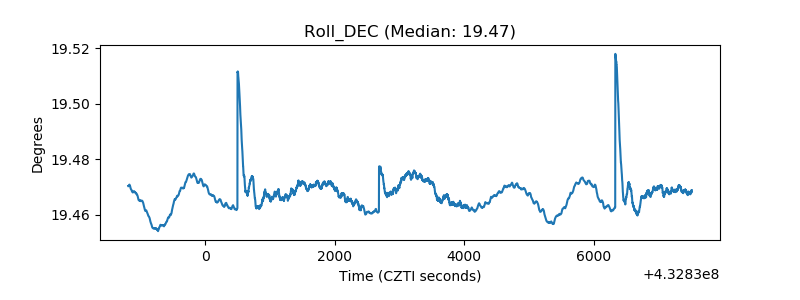 |
| _Roll_RA | 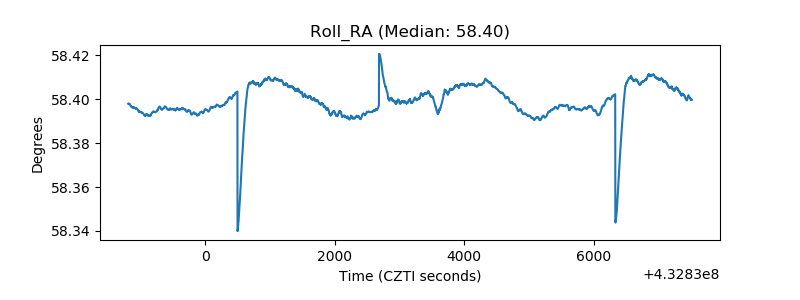 |
| Veto Counter | 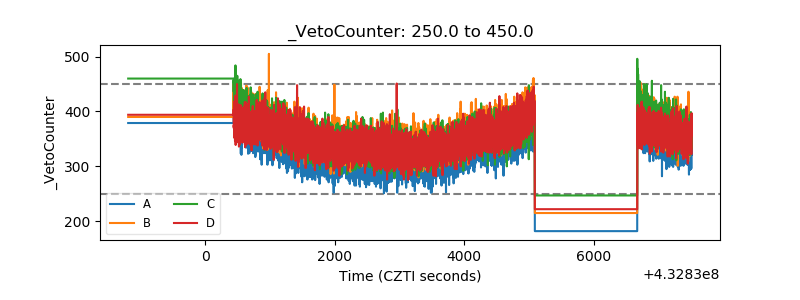 |