| Param | Original file | Final file |
|---|---|---|
| Filename | modeM0/AS1A09_006T07_9000005852_43132cztM0_level2.fits | modeM0/AS1A09_006T07_9000005852_43132cztM0_level2_quad_clean.evt |
| Size (bytes) | 384,707,520 | 96,405,120 |
| Size | 366.9 MB | 91.9 MB |
| Events in quadrant A | 4,184,282 | 634,892 |
| Events in quadrant B | 3,131,774 | 661,826 |
| Events in quadrant C | 2,794,065 | 629,507 |
| Events in quadrant D | 3,663,479 | 574,062 |
| Mode M9 | |||
|---|---|---|---|
| Quadrant | BADHDUFLAG | Total packets | Discarded packets |
| A | 0 | 28 | 0 |
| B | 0 | 28 | 0 |
| C | 0 | 28 | 0 |
| D | 0 | 28 | 0 |
| Mode M0 | |||
|---|---|---|---|
| Quadrant | BADHDUFLAG | Total packets | Discarded packets |
| A | 0 | 16369 | 2 |
| B | 0 | 13483 | 2 |
| C | 0 | 12158 | 2 |
| D | 0 | 15262 | 2 |
| Mode SS | |||
|---|---|---|---|
| Quadrant | BADHDUFLAG | Total packets | Discarded packets |
| A | 0 | 122 | 0 |
| B | 0 | 122 | 0 |
| C | 0 | 122 | 0 |
| D | 0 | 122 | 0 |
| Quadrant | Total seconds | Saturated seconds | Saturation percentage |
|---|---|---|---|
| A | 6003 | 164 | 2.731967% |
| B | 6002 | 64 | 1.066311% |
| C | 6002 | 4 | 0.066644% |
| D | 6002 | 134 | 2.232589% |
Noise dominated data is calculated using 1-second bins in cleaned event files. If a bin has >2000 counts, and if more than 50% of those come from <1% of pixels, then it is considered to be noise-dominated and hence unusable.
| Quadrant | # 1 sec bins | Bins with >0 counts | Bins with >2000 counts | High rate bins dominated by noise | Noise dominated (total time) | Noise dominated (detector-on time) | Marked lightcurve |
|---|---|---|---|---|---|---|---|
| A | 8660 | 6005 | 163 | 163 | 1.88% | 2.71% | 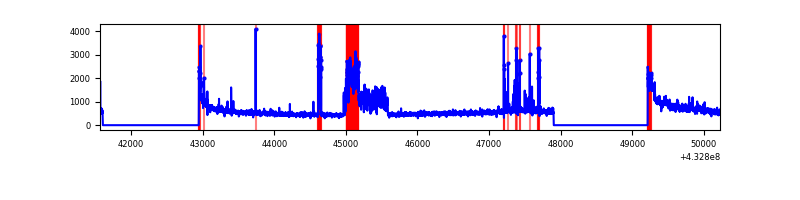 |
| B | 8659 | 6004 | 35 | 35 | 0.40% | 0.58% | 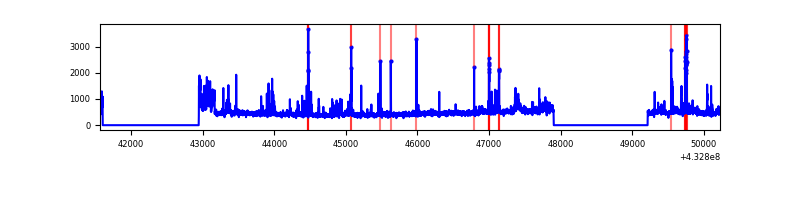 |
| C | 8659 | 6004 | 2 | 2 | 0.02% | 0.03% | 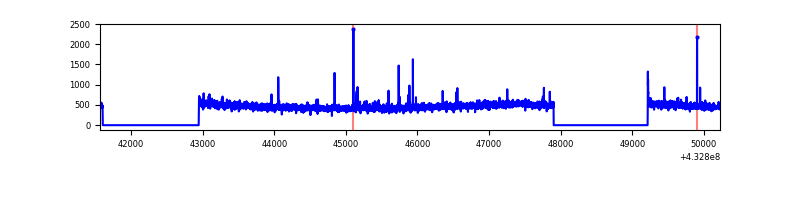 |
| D | 8659 | 6004 | 106 | 106 | 1.22% | 1.77% | 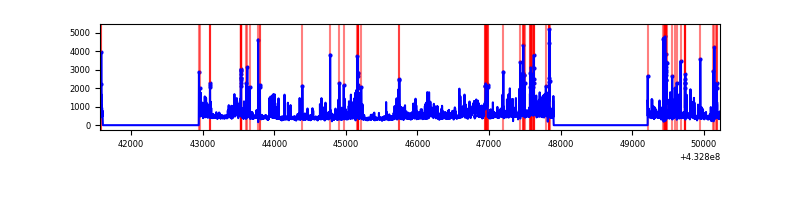 |
Top three noisy pixels from each quadrant. If the there are fewer than three noisy pixels in the level2.evt file, extra rows are filled as -1
| Pixel properties | Quadrant properties | ||||||
|---|---|---|---|---|---|---|---|
| Quadrant | DetID | PixID | Counts | Sigma | Mean | Median | Sigma |
| A | 15 | 222 | 907525 | 6824.29 | 644 | 630 | 132.9 |
| A | 10 | 83 | 632928 | 4757.98 | 644 | 630 | 132.9 |
| A | 15 | 237 | 116327 | 870.61 | 644 | 630 | 132.9 |
| B | 0 | 229 | 206860 | 1643.21 | 644 | 626 | 125.5 |
| B | 5 | 255 | 186919 | 1484.32 | 644 | 626 | 125.5 |
| B | 0 | 186 | 146411 | 1161.57 | 644 | 626 | 125.5 |
| C | 15 | 214 | 249946 | 1667.95 | 634 | 638 | 149.5 |
| C | 0 | 207 | 39788 | 261.93 | 634 | 638 | 149.5 |
| C | 14 | 254 | 13422 | 85.53 | 634 | 638 | 149.5 |
| D | 1 | 52 | 1005145 | 6438.89 | 627 | 609 | 156.0 |
| D | 12 | 218 | 96513 | 614.73 | 627 | 609 | 156.0 |
| D | 13 | 249 | 31184 | 195.98 | 627 | 609 | 156.0 |
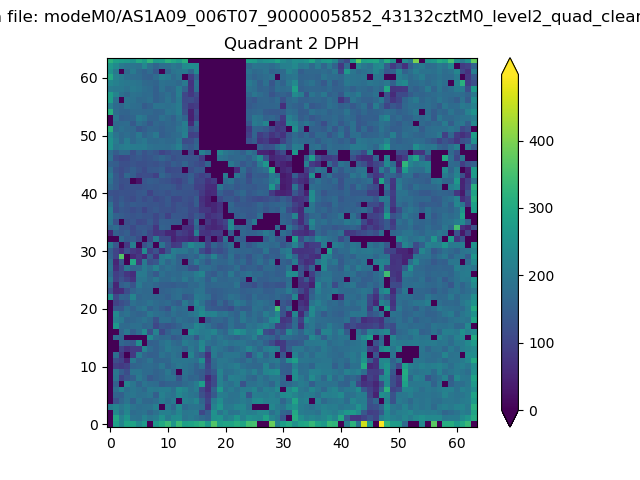
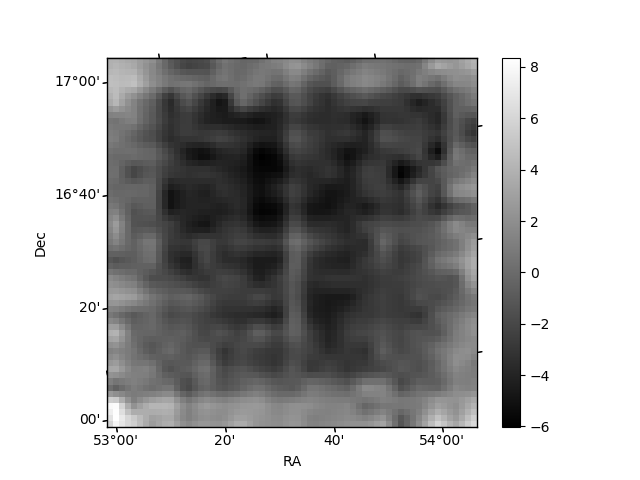
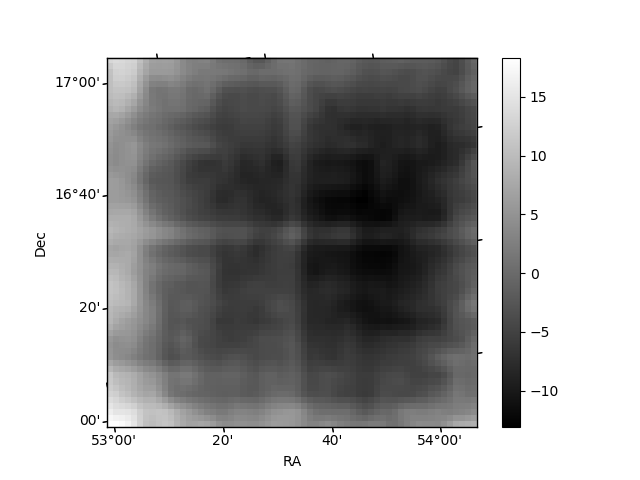
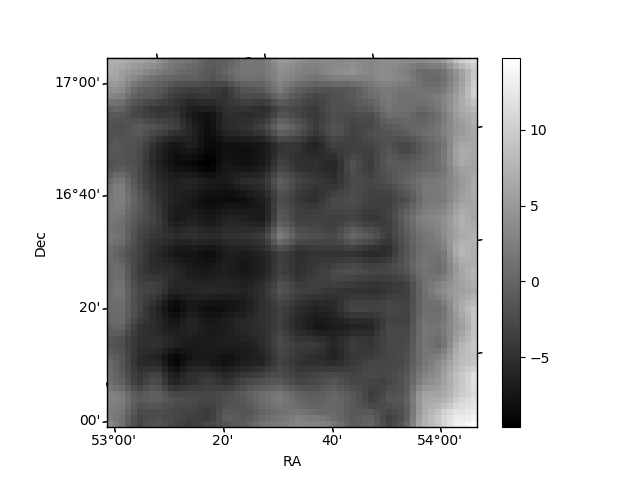
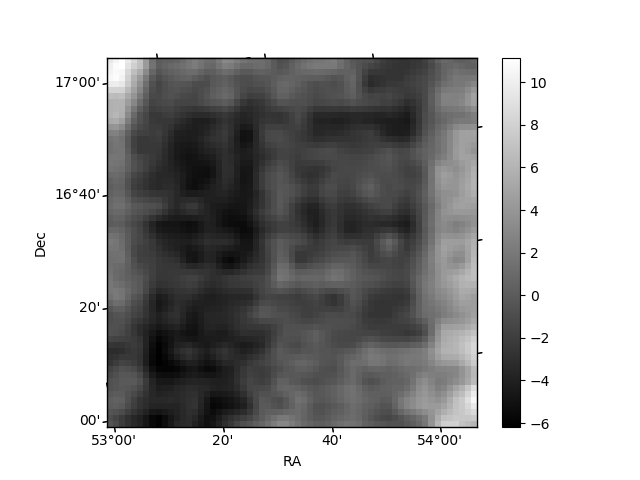
Histogram calculated using DETX and DETY for each event in the final _common_clean file
| Quadrant A |  |
 |
Quadrant B |
|---|---|---|---|
| Quadrant D | 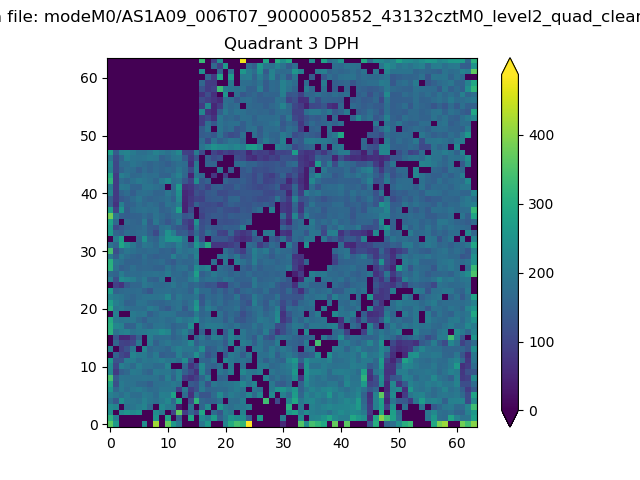 |
 |
Quadrant C |
| Plot type | Count rate plots | Images |
|---|---|---|
| Comparison with Poisson distribution Blue bars denote a histogram of data divided into 1 sec bins. Red curve is a Poisson curve with rate = median count rate of data. |
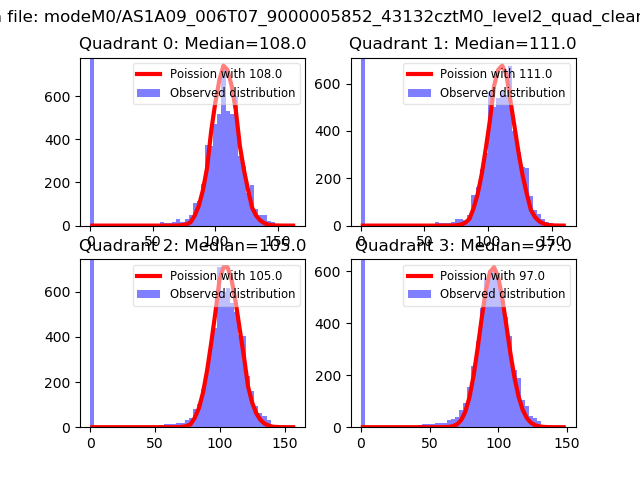 |
 |
| Quadrant-wise count rates Data is divided into 100 sec bins |
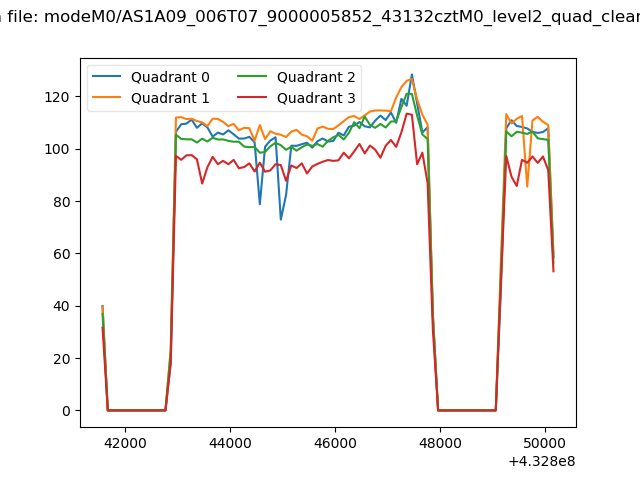 |
|
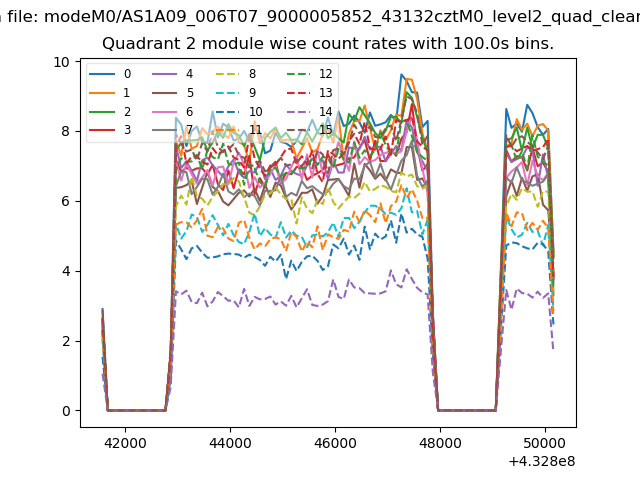
| Module-wise count rates for Quadrant A Data is divided into 100 sec bins |
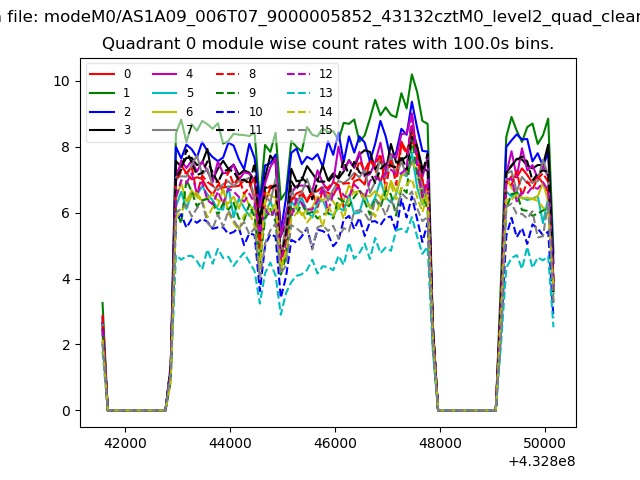 |
 |
| Module-wise count rates for Quadrant B Data is divided into 100 sec bins |
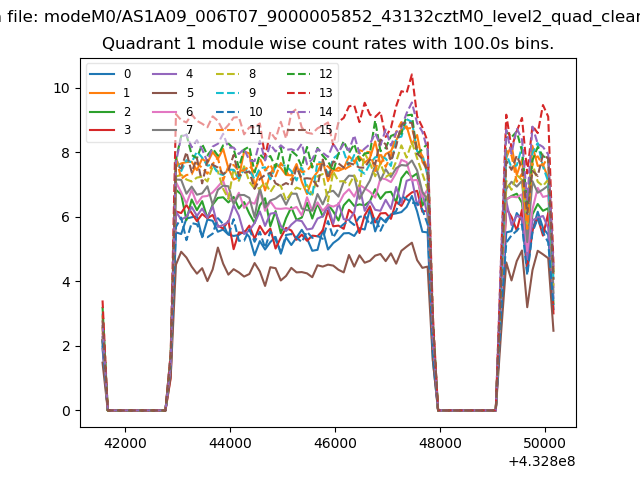 |
 |
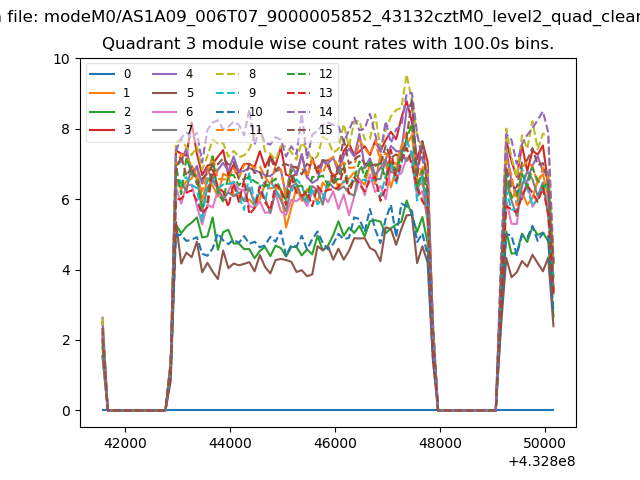
| Module-wise count rates for Quadrant C Data is divided into 100 sec bins |
 |
 |
| Module-wise count rates for Quadrant D Data is divided into 100 sec bins |
 |
 |
| Parameter | Plot |
|---|---|
| CZT HV Monitor | 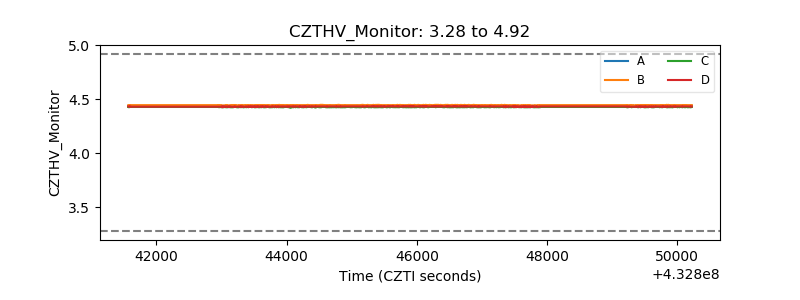 |
| D_VDD | 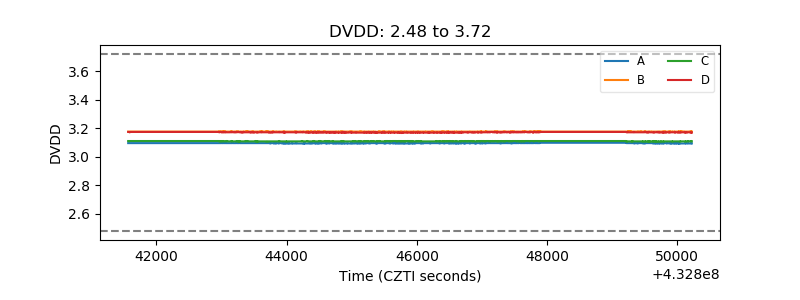 |
| Temperature 1 | 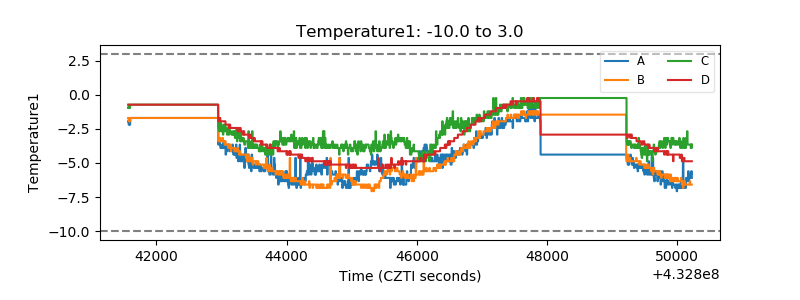 |
| Veto HV Monitor | 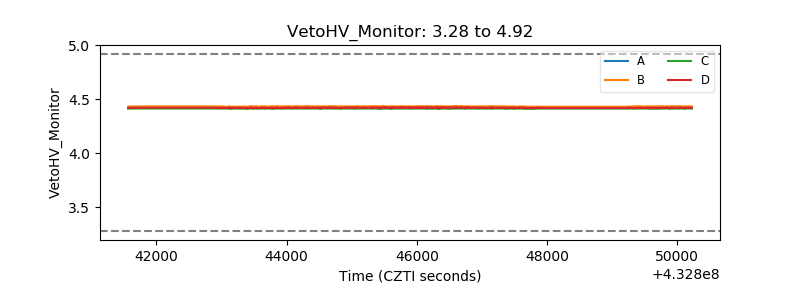 |
| Veto LLD | 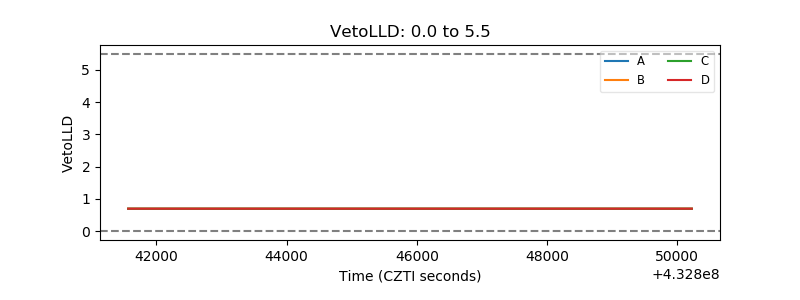 |
| Alpha Counter | 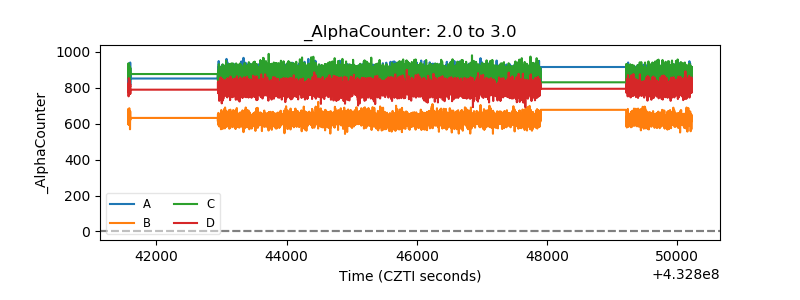 |
| _CPM_Rate |  |
| CZT Counter | 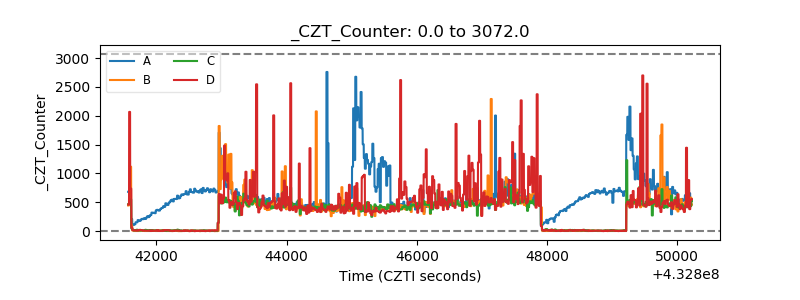 |
| +2.5 Volts monitor |  |
| +5 Volts monitor | 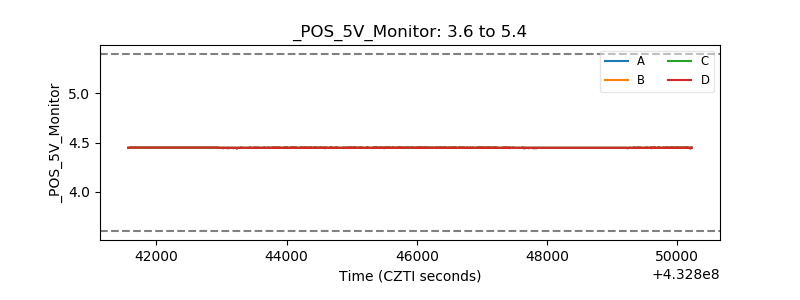 |
| _ROLL_ROT | 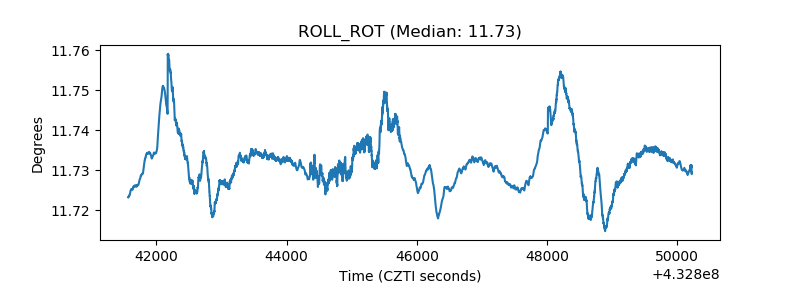 |
| _Roll_DEC | 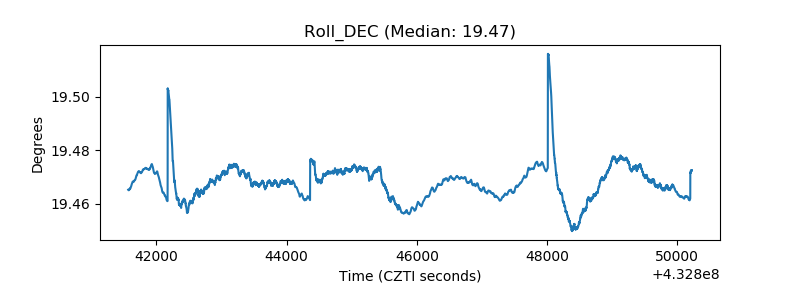 |
| _Roll_RA | 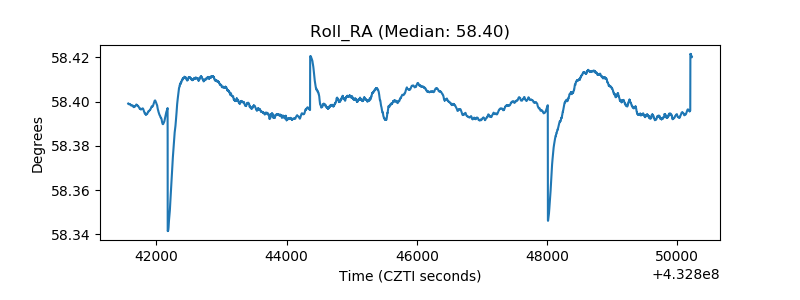 |
| Veto Counter | 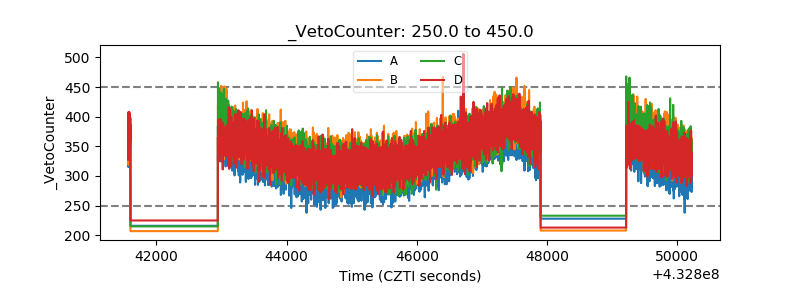 |