| Param | Original file | Final file |
|---|---|---|
| Filename | modeM0/AS1A09_107T01_9000005854_43136cztM0_level2.fits | modeM0/AS1A09_107T01_9000005854_43136cztM0_level2_quad_clean.evt |
| Size (bytes) | 345,859,200 | 88,750,080 |
| Size | 329.8 MB | 84.6 MB |
| Events in quadrant A | 3,780,352 | 569,534 |
| Events in quadrant B | 2,931,570 | 607,455 |
| Events in quadrant C | 2,593,532 | 587,281 |
| Events in quadrant D | 3,067,454 | 537,011 |
| Mode M0 | |||
|---|---|---|---|
| Quadrant | BADHDUFLAG | Total packets | Discarded packets |
| A | 0 | 14774 | 2 |
| B | 0 | 12806 | 2 |
| C | 0 | 11259 | 2 |
| D | 0 | 13043 | 2 |
| Mode M9 | |||
|---|---|---|---|
| Quadrant | BADHDUFLAG | Total packets | Discarded packets |
| A | 0 | 19 | 0 |
| B | 0 | 20 | 0 |
| C | 0 | 20 | 0 |
| D | 0 | 20 | 0 |
| Mode SS | |||
|---|---|---|---|
| Quadrant | BADHDUFLAG | Total packets | Discarded packets |
| A | 0 | 112 | 0 |
| B | 0 | 112 | 0 |
| C | 0 | 112 | 0 |
| D | 0 | 112 | 0 |
| Quadrant | Total seconds | Saturated seconds | Saturation percentage |
|---|---|---|---|
| A | 5517 | 234 | 4.241436% |
| B | 5517 | 66 | 1.196302% |
| C | 5517 | 10 | 0.181258% |
| D | 5517 | 95 | 1.721950% |
Noise dominated data is calculated using 1-second bins in cleaned event files. If a bin has >2000 counts, and if more than 50% of those come from <1% of pixels, then it is considered to be noise-dominated and hence unusable.
| Quadrant | # 1 sec bins | Bins with >0 counts | Bins with >2000 counts | High rate bins dominated by noise | Noise dominated (total time) | Noise dominated (detector-on time) | Marked lightcurve |
|---|---|---|---|---|---|---|---|
| A | 7190 | 5518 | 185 | 185 | 2.57% | 3.35% |  |
| B | 7190 | 5518 | 24 | 24 | 0.33% | 0.43% |  |
| C | 7190 | 5518 | 6 | 6 | 0.08% | 0.11% | 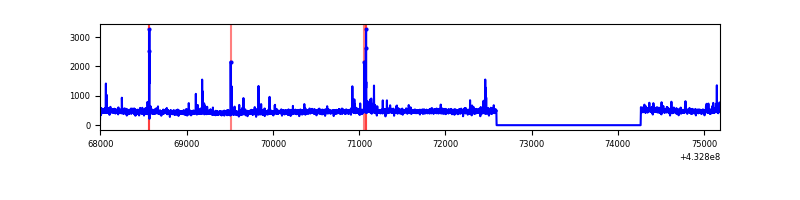 |
| D | 7190 | 5518 | 79 | 79 | 1.10% | 1.43% | 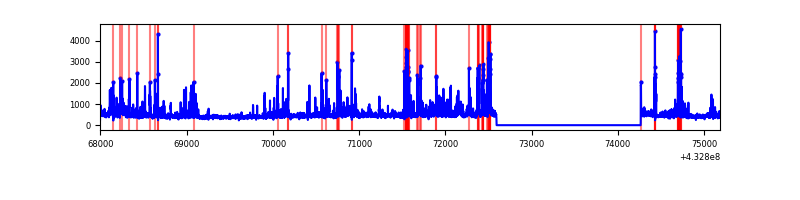 |
Top three noisy pixels from each quadrant. If the there are fewer than three noisy pixels in the level2.evt file, extra rows are filled as -1
| Pixel properties | Quadrant properties | ||||||
|---|---|---|---|---|---|---|---|
| Quadrant | DetID | PixID | Counts | Sigma | Mean | Median | Sigma |
| A | 15 | 237 | 611873 | 5146.89 | 574 | 562 | 118.8 |
| A | 10 | 83 | 582166 | 4896.78 | 574 | 562 | 118.8 |
| A | 12 | 189 | 226305 | 1900.63 | 574 | 562 | 118.8 |
| B | 0 | 186 | 497096 | 4416.73 | 581 | 563 | 112.4 |
| B | 5 | 255 | 131312 | 1163.03 | 581 | 563 | 112.4 |
| B | 0 | 229 | 24941 | 216.85 | 581 | 563 | 112.4 |
| C | 15 | 214 | 231870 | 1699.56 | 580 | 582 | 136.1 |
| C | 14 | 254 | 84135 | 613.97 | 580 | 582 | 136.1 |
| C | 12 | 249 | 5027 | 32.66 | 580 | 582 | 136.1 |
| D | 1 | 52 | 696048 | 4990.23 | 576 | 559 | 139.4 |
| D | 12 | 218 | 77520 | 552.21 | 576 | 559 | 139.4 |
| D | 13 | 249 | 51552 | 365.88 | 576 | 559 | 139.4 |
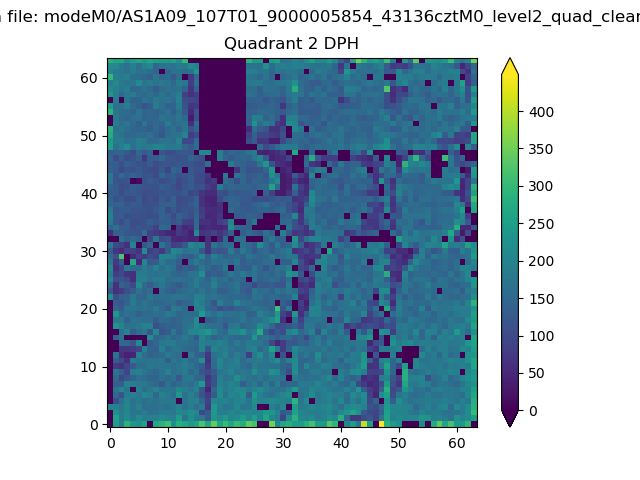
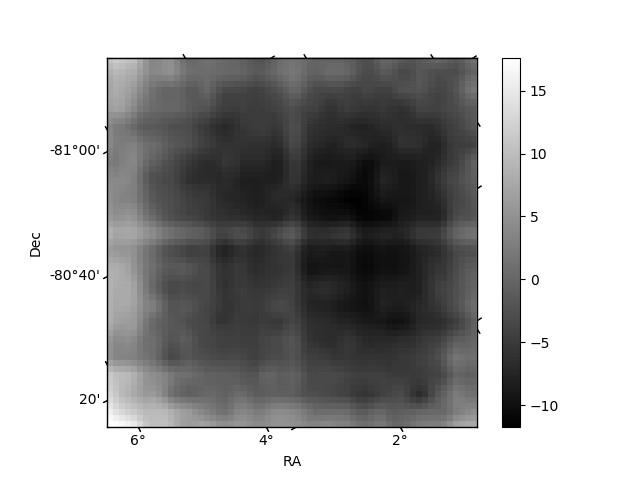
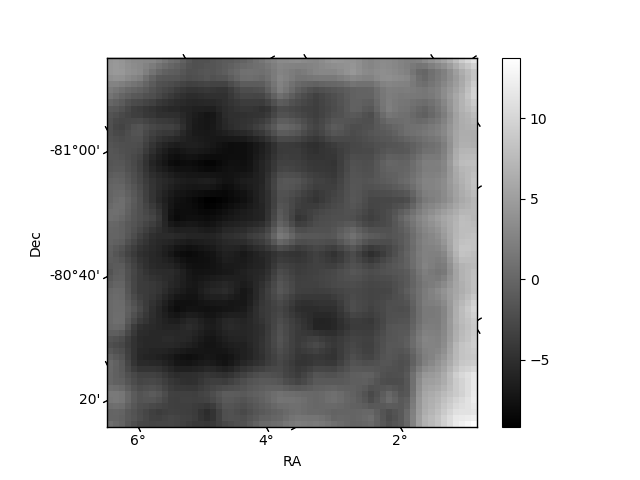
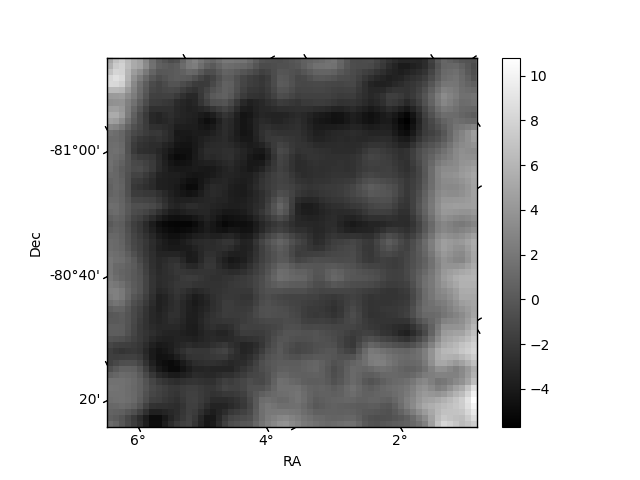
Histogram calculated using DETX and DETY for each event in the final _common_clean file
| Quadrant A | 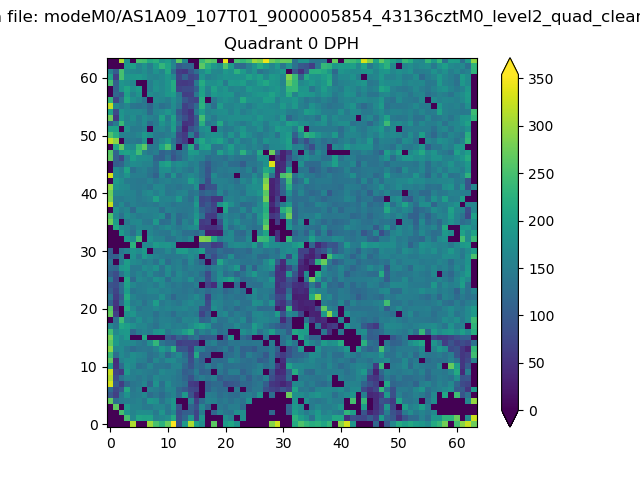 |
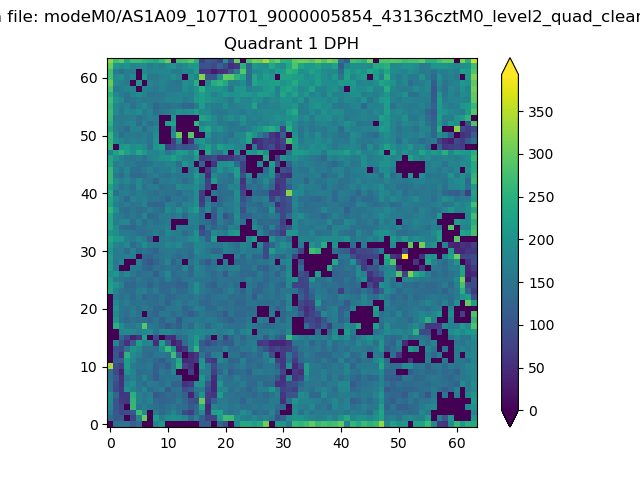 |
Quadrant B |
|---|---|---|---|
| Quadrant D | 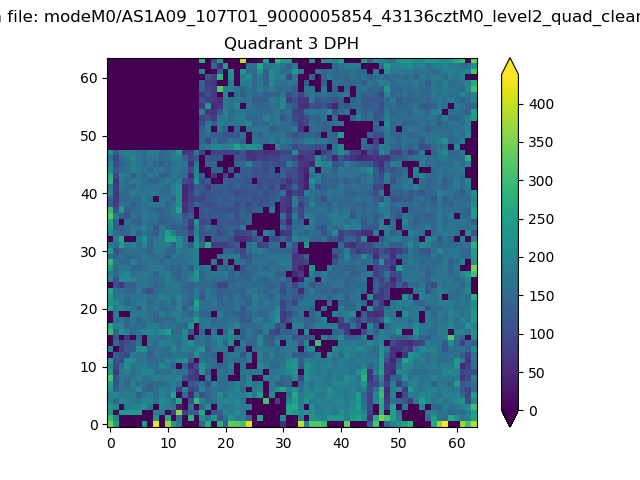 |
 |
Quadrant C |
| Plot type | Count rate plots | Images |
|---|---|---|
| Comparison with Poisson distribution Blue bars denote a histogram of data divided into 1 sec bins. Red curve is a Poisson curve with rate = median count rate of data. |
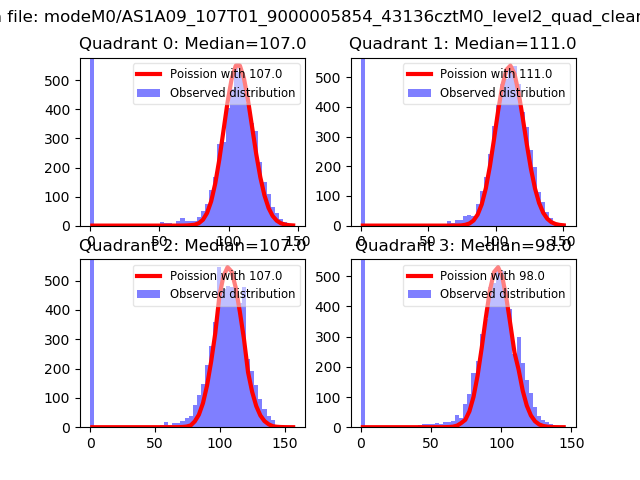 |
 |
| Quadrant-wise count rates Data is divided into 100 sec bins |
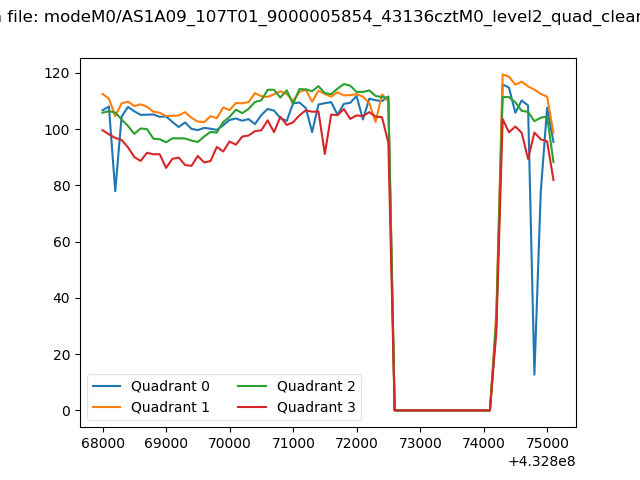 |
|
| Module-wise count rates for Quadrant A Data is divided into 100 sec bins |
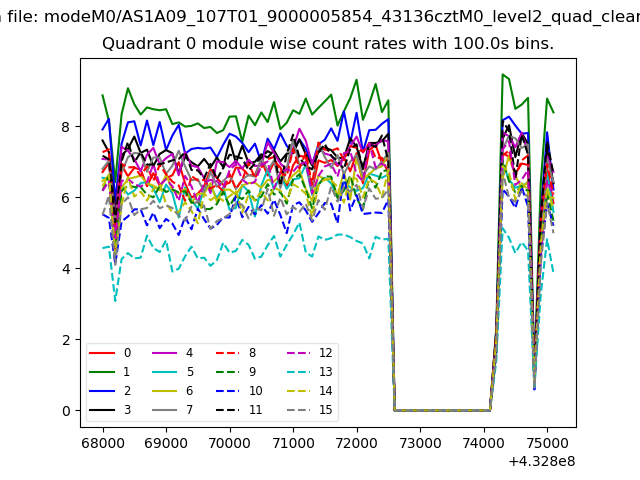 |
 |
| Module-wise count rates for Quadrant B Data is divided into 100 sec bins |
 |
 |
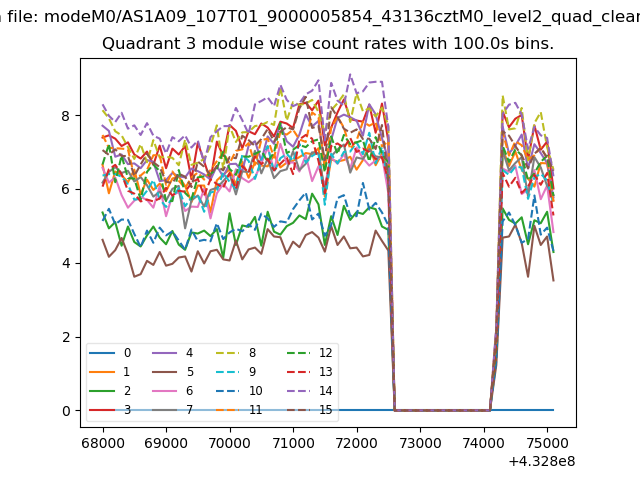
| Module-wise count rates for Quadrant C Data is divided into 100 sec bins |
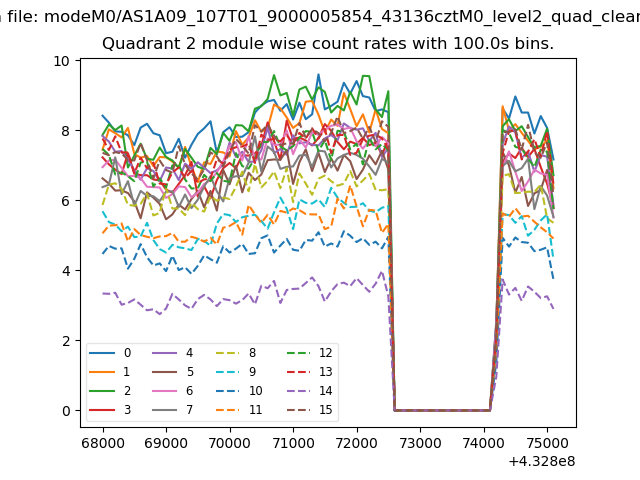 |
 |
| Module-wise count rates for Quadrant D Data is divided into 100 sec bins |
 |
 |
| Parameter | Plot |
|---|---|
| CZT HV Monitor | 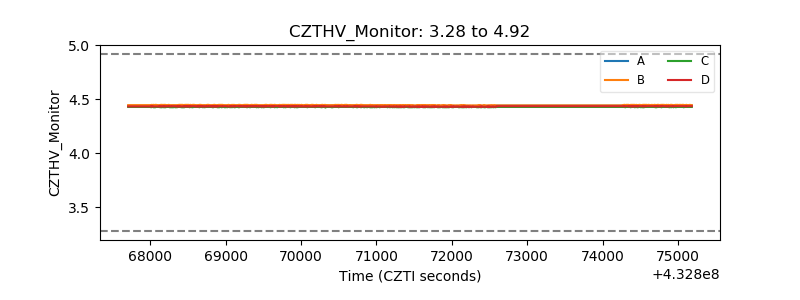 |
| D_VDD | 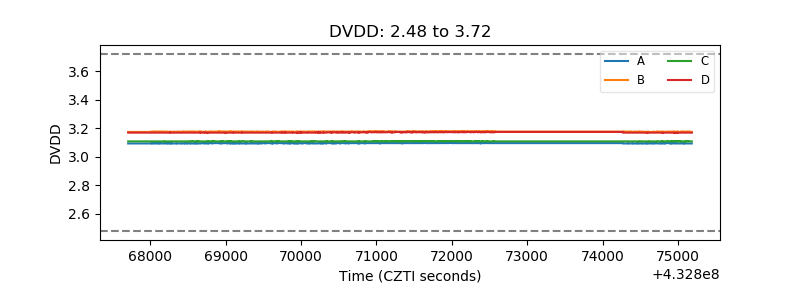 |
| Temperature 1 | 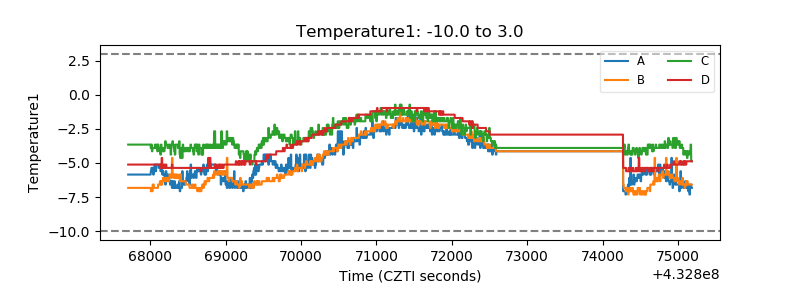 |
| Veto HV Monitor |  |
| Veto LLD | 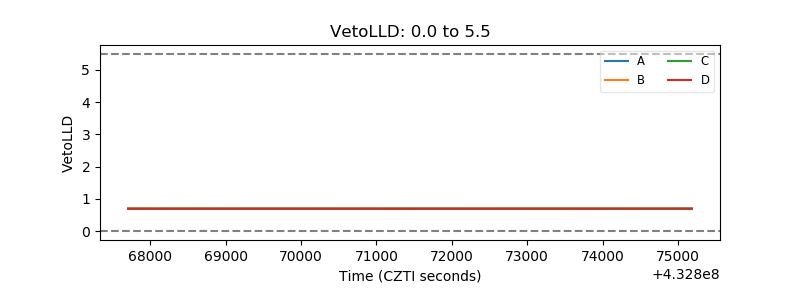 |
| Alpha Counter | 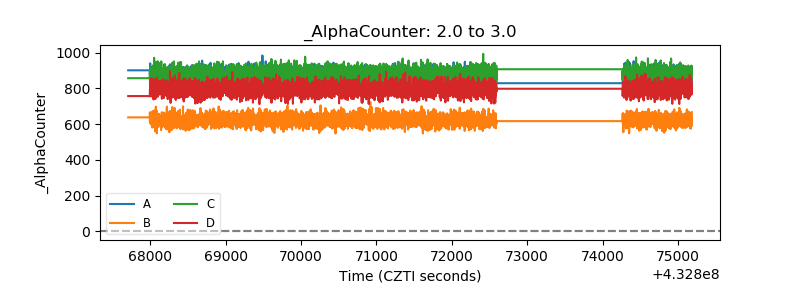 |
| _CPM_Rate |  |
| CZT Counter | 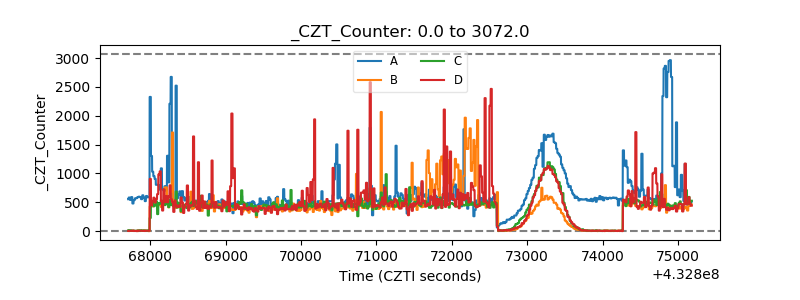 |
| +2.5 Volts monitor | 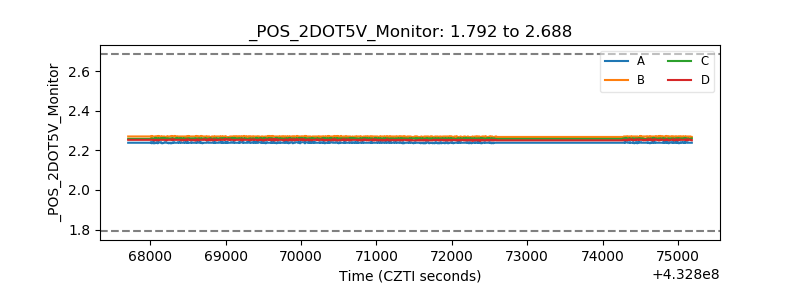 |
| +5 Volts monitor |  |
| _ROLL_ROT | 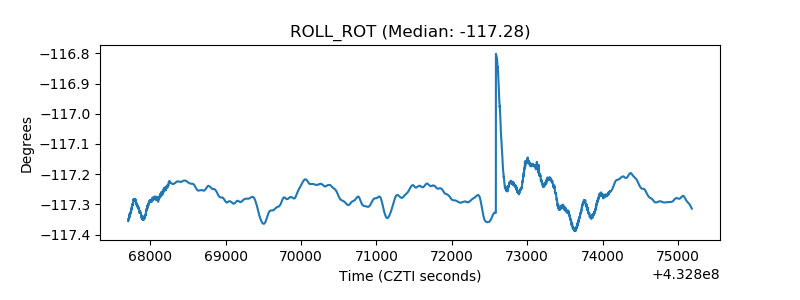 |
| _Roll_DEC | 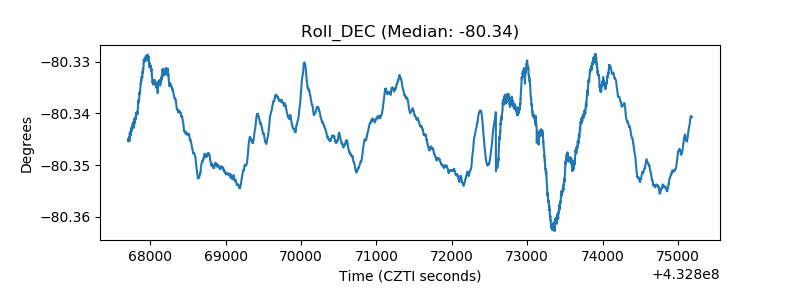 |
| _Roll_RA | 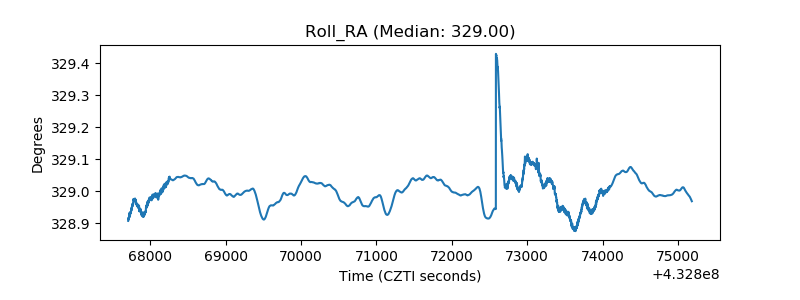 |
| Veto Counter | 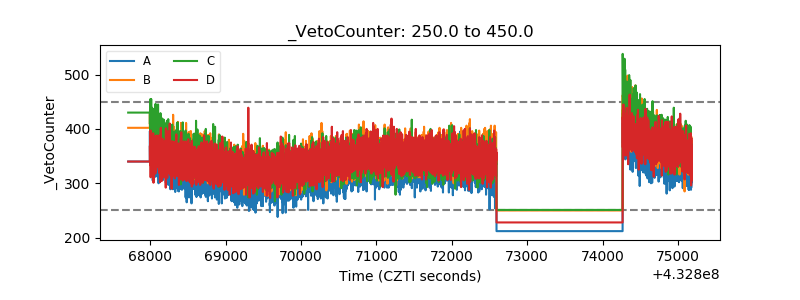 |