| Param | Original file | Final file |
|---|---|---|
| Filename | modeM0/AS1A09_107T01_9000005854_43138cztM0_level2.fits | modeM0/AS1A09_107T01_9000005854_43138cztM0_level2_quad_clean.evt |
| Size (bytes) | 336,643,200 | 88,191,360 |
| Size | 321.0 MB | 84.1 MB |
| Events in quadrant A | 3,994,506 | 561,310 |
| Events in quadrant B | 2,442,916 | 609,517 |
| Events in quadrant C | 2,571,906 | 591,624 |
| Events in quadrant D | 3,036,338 | 534,439 |
| Mode M0 | |||
|---|---|---|---|
| Quadrant | BADHDUFLAG | Total packets | Discarded packets |
| A | 0 | 15336 | 2 |
| B | 0 | 11034 | 2 |
| C | 0 | 10981 | 2 |
| D | 0 | 12790 | 2 |
| Mode M9 | |||
|---|---|---|---|
| Quadrant | BADHDUFLAG | Total packets | Discarded packets |
| A | 0 | 19 | 0 |
| B | 0 | 20 | 0 |
| C | 0 | 20 | 0 |
| D | 0 | 20 | 0 |
| Mode SS | |||
|---|---|---|---|
| Quadrant | BADHDUFLAG | Total packets | Discarded packets |
| A | 0 | 108 | 0 |
| B | 0 | 108 | 0 |
| C | 0 | 108 | 0 |
| D | 0 | 108 | 0 |
| Quadrant | Total seconds | Saturated seconds | Saturation percentage |
|---|---|---|---|
| A | 5336 | 306 | 5.734633% |
| B | 5336 | 16 | 0.299850% |
| C | 5336 | 11 | 0.206147% |
| D | 5336 | 129 | 2.417541% |
Noise dominated data is calculated using 1-second bins in cleaned event files. If a bin has >2000 counts, and if more than 50% of those come from <1% of pixels, then it is considered to be noise-dominated and hence unusable.
| Quadrant | # 1 sec bins | Bins with >0 counts | Bins with >2000 counts | High rate bins dominated by noise | Noise dominated (total time) | Noise dominated (detector-on time) | Marked lightcurve |
|---|---|---|---|---|---|---|---|
| A | 7129 | 5337 | 221 | 221 | 3.10% | 4.14% | 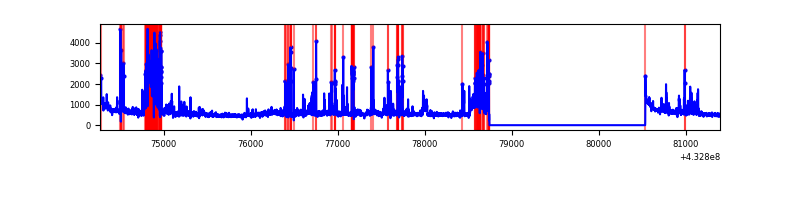 |
| B | 7129 | 5337 | 9 | 9 | 0.13% | 0.17% | 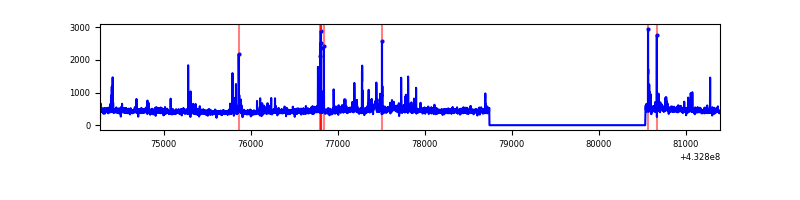 |
| C | 7129 | 5337 | 4 | 4 | 0.06% | 0.07% | 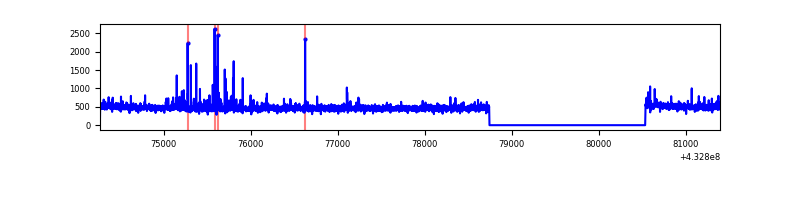 |
| D | 7129 | 5337 | 108 | 108 | 1.51% | 2.02% | 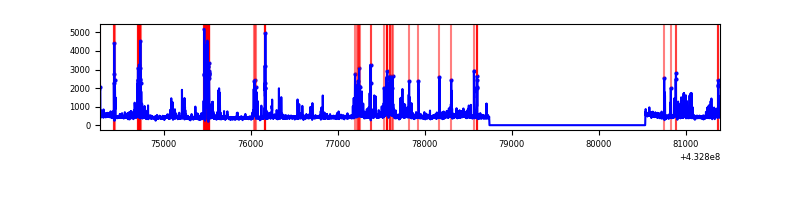 |
Top three noisy pixels from each quadrant. If the there are fewer than three noisy pixels in the level2.evt file, extra rows are filled as -1
| Pixel properties | Quadrant properties | ||||||
|---|---|---|---|---|---|---|---|
| Quadrant | DetID | PixID | Counts | Sigma | Mean | Median | Sigma |
| A | 15 | 237 | 879372 | 7673.62 | 558 | 547 | 114.5 |
| A | 10 | 83 | 564403 | 4923.41 | 558 | 547 | 114.5 |
| A | 12 | 189 | 229636 | 2000.33 | 558 | 547 | 114.5 |
| B | 5 | 255 | 91857 | 829.19 | 572 | 556 | 110.1 |
| B | 0 | 229 | 71406 | 643.45 | 572 | 556 | 110.1 |
| B | 0 | 186 | 18497 | 162.94 | 572 | 556 | 110.1 |
| C | 15 | 214 | 225233 | 1689.05 | 571 | 574 | 133.0 |
| C | 14 | 254 | 101268 | 757.05 | 571 | 574 | 133.0 |
| C | 0 | 239 | 7925 | 55.27 | 571 | 574 | 133.0 |
| D | 1 | 52 | 787140 | 5716.83 | 562 | 546 | 137.6 |
| D | 13 | 249 | 41975 | 301.1 | 562 | 546 | 137.6 |
| D | 2 | 234 | 24160 | 171.62 | 562 | 546 | 137.6 |
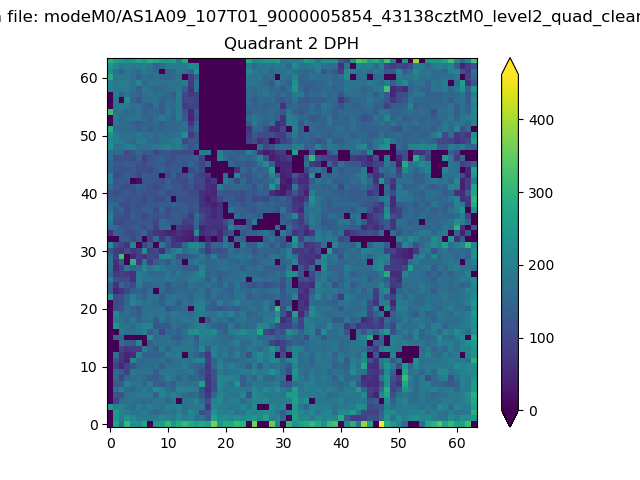
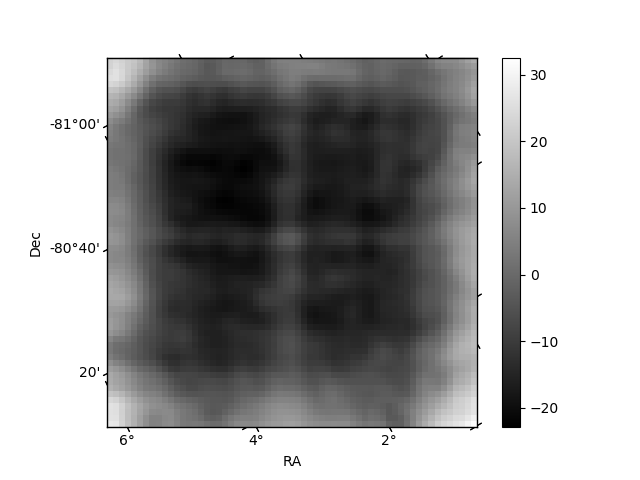
Histogram calculated using DETX and DETY for each event in the final _common_clean file
| Quadrant A | 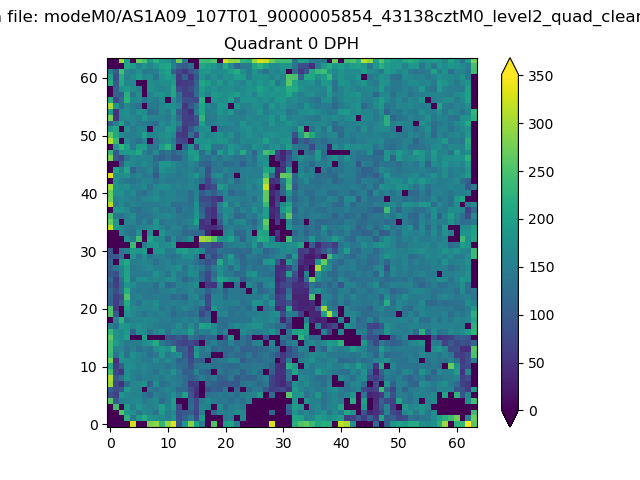 |
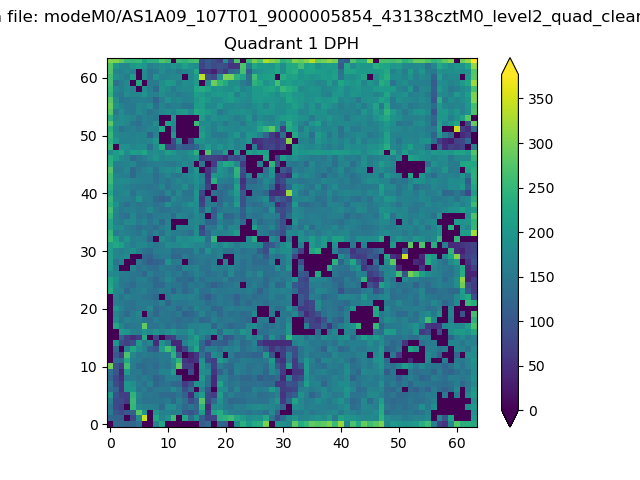 |
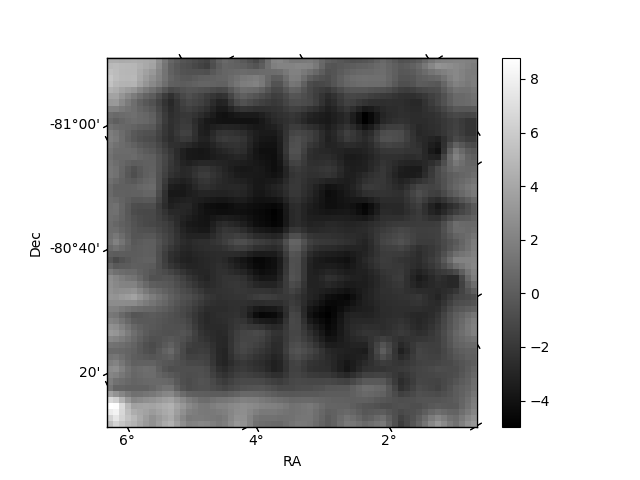
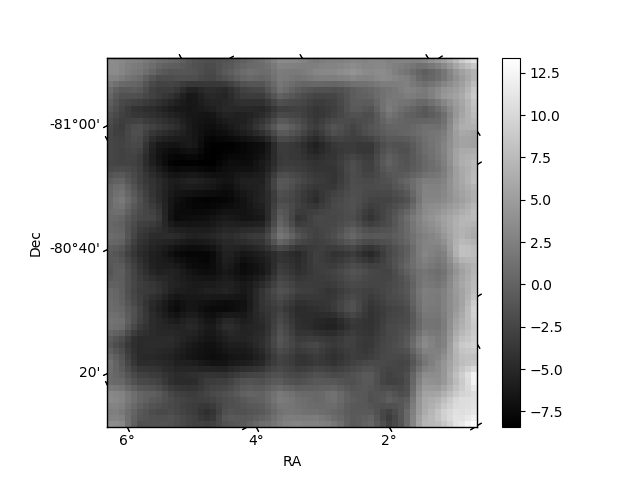
Quadrant B |
|---|---|---|---|
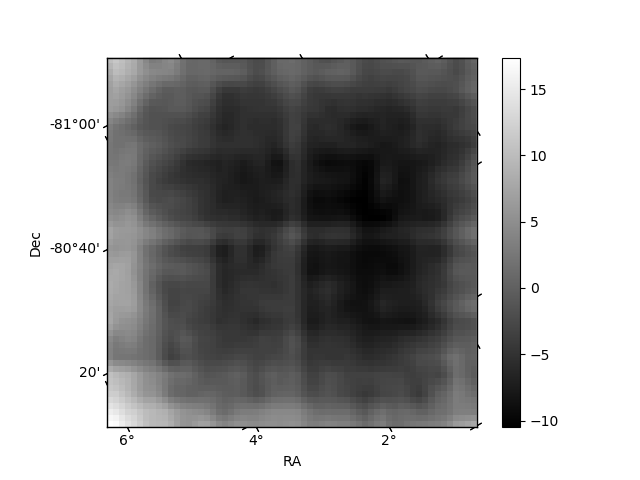
| Quadrant D | 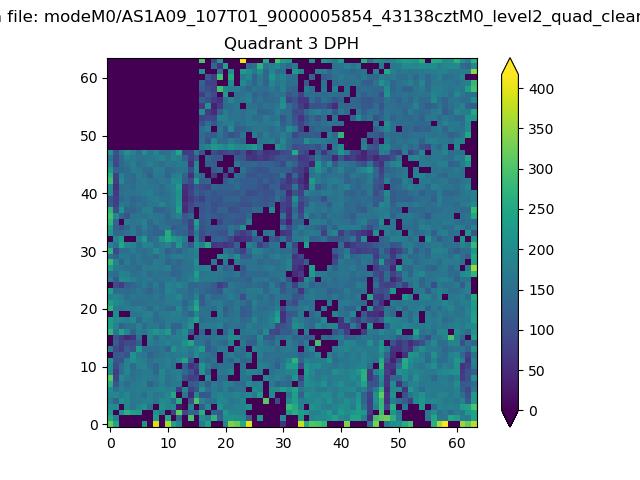 |
 |
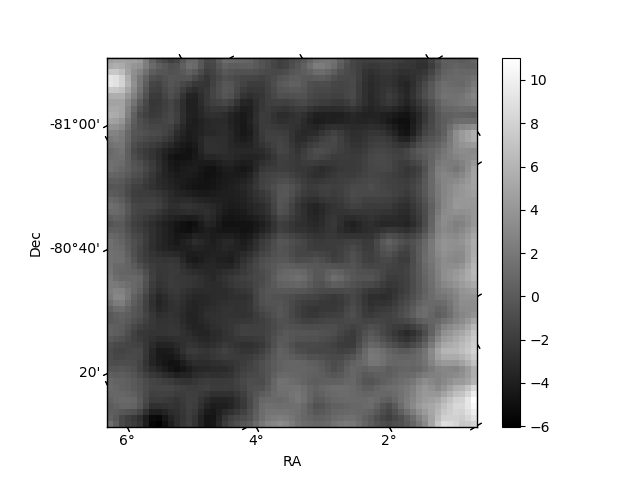
Quadrant C |
| Plot type | Count rate plots | Images |
|---|---|---|
| Comparison with Poisson distribution Blue bars denote a histogram of data divided into 1 sec bins. Red curve is a Poisson curve with rate = median count rate of data. |
 |
 |
| Quadrant-wise count rates Data is divided into 100 sec bins |
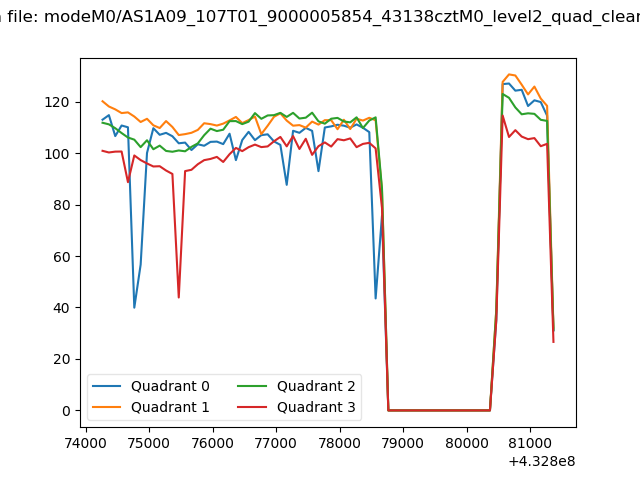 |
|
| Module-wise count rates for Quadrant A Data is divided into 100 sec bins |
 |
 |
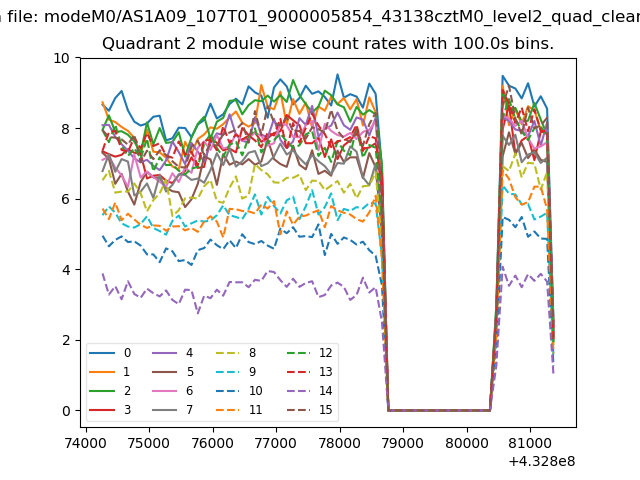
| Module-wise count rates for Quadrant B Data is divided into 100 sec bins |
 |
 |
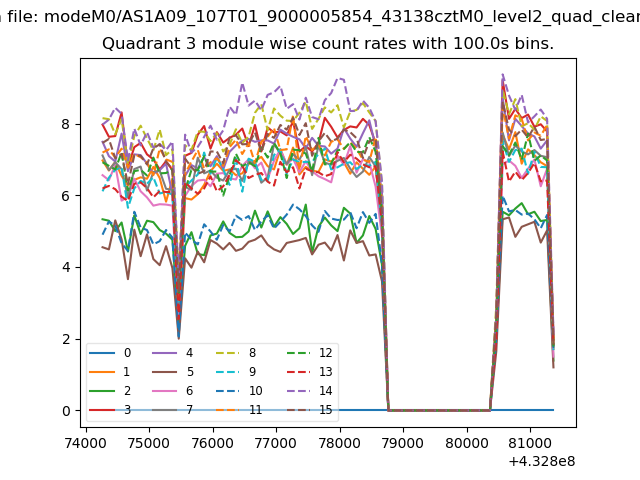
| Module-wise count rates for Quadrant C Data is divided into 100 sec bins |
 |
 |
| Module-wise count rates for Quadrant D Data is divided into 100 sec bins |
 |
 |
| Parameter | Plot |
|---|---|
| CZT HV Monitor | 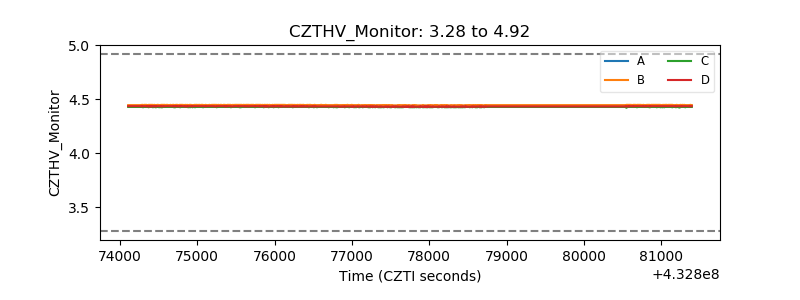 |
| D_VDD | 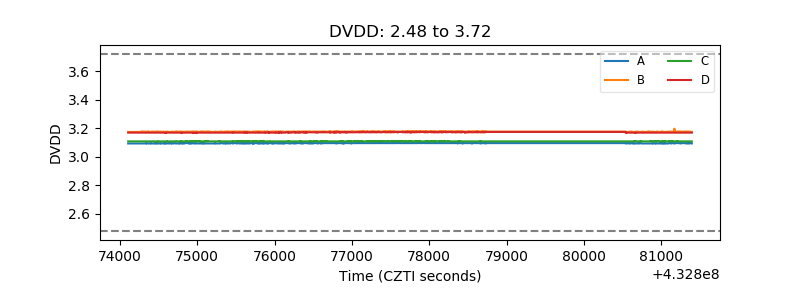 |
| Temperature 1 | 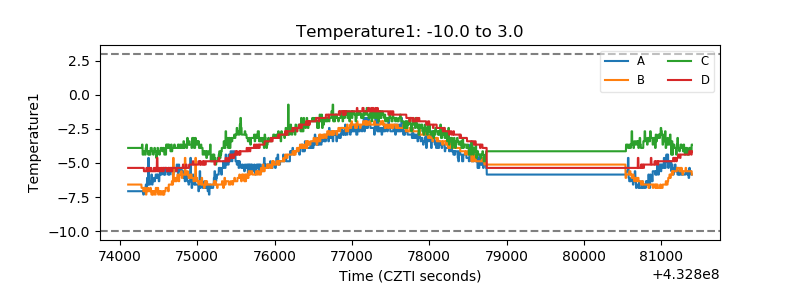 |
| Veto HV Monitor | 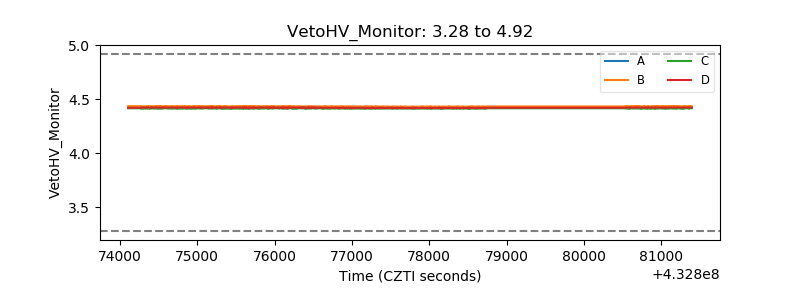 |
| Veto LLD | 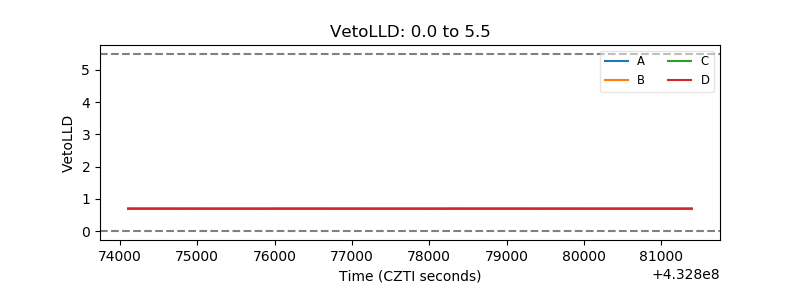 |
| Alpha Counter | 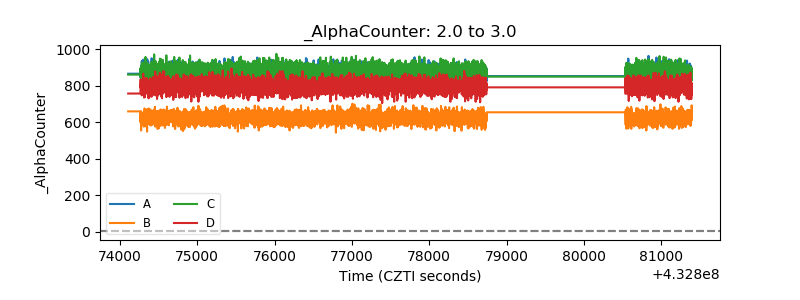 |
| _CPM_Rate | 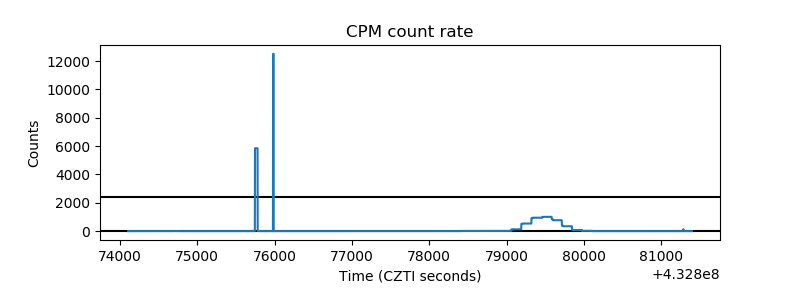 |
| CZT Counter |  |
| +2.5 Volts monitor |  |
| +5 Volts monitor |  |
| _ROLL_ROT | 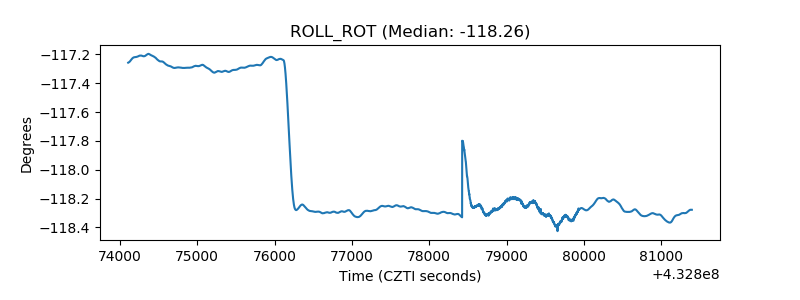 |
| _Roll_DEC | 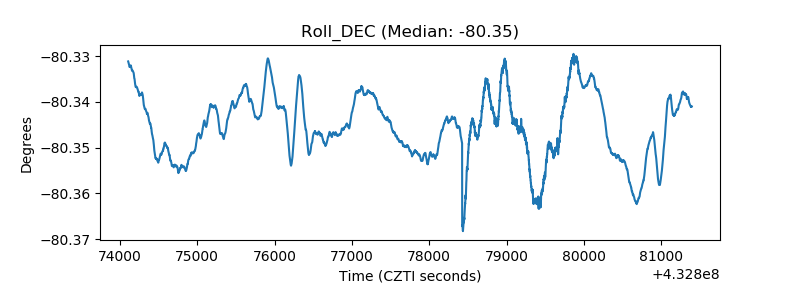 |
| _Roll_RA | 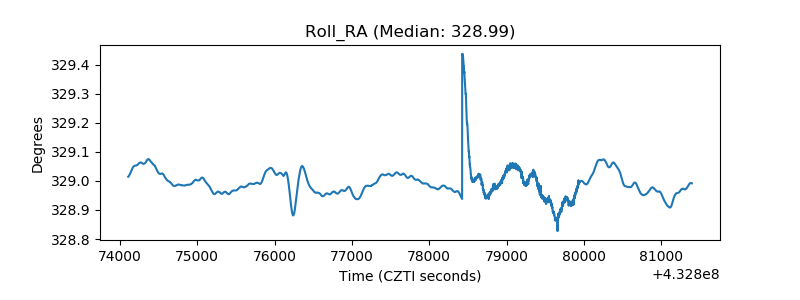 |
| Veto Counter | 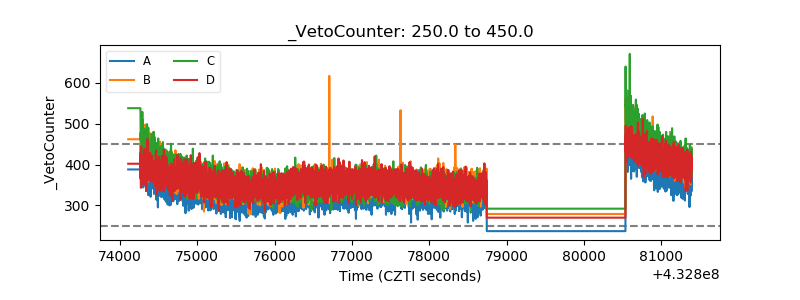 |