| Param | Original file | Final file |
|---|---|---|
| Filename | modeM0/AS1A09_107T01_9000005854_43139cztM0_level2.fits | modeM0/AS1A09_107T01_9000005854_43139cztM0_level2_quad_clean.evt |
| Size (bytes) | 307,186,560 | 90,230,400 |
| Size | 293.0 MB | 86.1 MB |
| Events in quadrant A | 3,377,464 | 594,343 |
| Events in quadrant B | 2,388,689 | 619,563 |
| Events in quadrant C | 2,496,521 | 607,007 |
| Events in quadrant D | 2,709,731 | 552,867 |
| Mode M0 | |||
|---|---|---|---|
| Quadrant | BADHDUFLAG | Total packets | Discarded packets |
| A | 0 | 13376 | 2 |
| B | 0 | 10561 | 3 |
| C | 0 | 10510 | 2 |
| D | 0 | 11660 | 2 |
| Mode M9 | |||
|---|---|---|---|
| Quadrant | BADHDUFLAG | Total packets | Discarded packets |
| A | 0 | 23 | 0 |
| B | 0 | 24 | 0 |
| C | 0 | 24 | 0 |
| D | 0 | 24 | 0 |
| Mode SS | |||
|---|---|---|---|
| Quadrant | BADHDUFLAG | Total packets | Discarded packets |
| A | 0 | 104 | 0 |
| B | 0 | 104 | 0 |
| C | 0 | 104 | 0 |
| D | 0 | 104 | 0 |
| Quadrant | Total seconds | Saturated seconds | Saturation percentage |
|---|---|---|---|
| A | 5118 | 50 | 0.976944% |
| B | 5117 | 10 | 0.195427% |
| C | 5117 | 7 | 0.136799% |
| D | 5117 | 53 | 1.035763% |
Noise dominated data is calculated using 1-second bins in cleaned event files. If a bin has >2000 counts, and if more than 50% of those come from <1% of pixels, then it is considered to be noise-dominated and hence unusable.
| Quadrant | # 1 sec bins | Bins with >0 counts | Bins with >2000 counts | High rate bins dominated by noise | Noise dominated (total time) | Noise dominated (detector-on time) | Marked lightcurve |
|---|---|---|---|---|---|---|---|
| A | 7032 | 5119 | 29 | 29 | 0.41% | 0.57% | 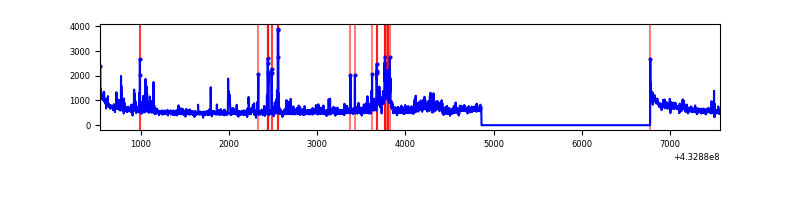 |
| B | 7031 | 5118 | 4 | 4 | 0.06% | 0.08% | 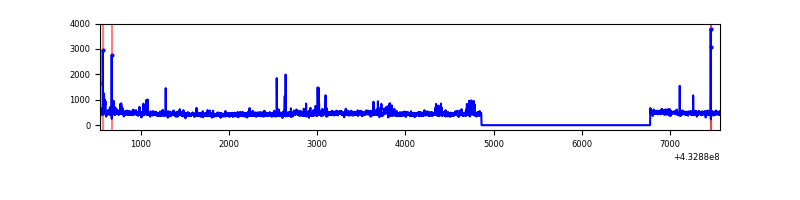 |
| C | 7031 | 5118 | 2 | 2 | 0.03% | 0.04% | 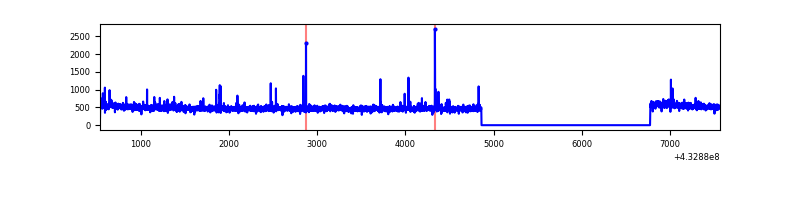 |
| D | 7031 | 5118 | 37 | 37 | 0.53% | 0.72% | 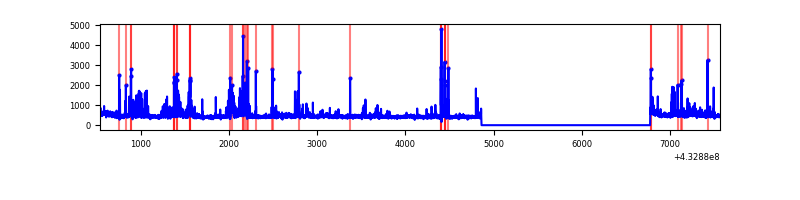 |
Top three noisy pixels from each quadrant. If the there are fewer than three noisy pixels in the level2.evt file, extra rows are filled as -1
| Pixel properties | Quadrant properties | ||||||
|---|---|---|---|---|---|---|---|
| Quadrant | DetID | PixID | Counts | Sigma | Mean | Median | Sigma |
| A | 10 | 83 | 562227 | 4846.63 | 565 | 555 | 115.9 |
| A | 12 | 189 | 287037 | 2472.04 | 565 | 555 | 115.9 |
| A | 15 | 237 | 233092 | 2006.55 | 565 | 555 | 115.9 |
| B | 0 | 229 | 111625 | 1023.58 | 565 | 550 | 108.5 |
| B | 5 | 255 | 46231 | 420.96 | 565 | 550 | 108.5 |
| B | 0 | 186 | 18062 | 161.38 | 565 | 550 | 108.5 |
| C | 15 | 214 | 228365 | 1743.52 | 565 | 567 | 130.7 |
| C | 14 | 254 | 56418 | 427.47 | 565 | 567 | 130.7 |
| C | 0 | 239 | 6757 | 47.38 | 565 | 567 | 130.7 |
| D | 1 | 52 | 334913 | 2450.72 | 561 | 546 | 136.4 |
| D | 12 | 6 | 73557 | 535.13 | 561 | 546 | 136.4 |
| D | 12 | 16 | 59266 | 430.38 | 561 | 546 | 136.4 |
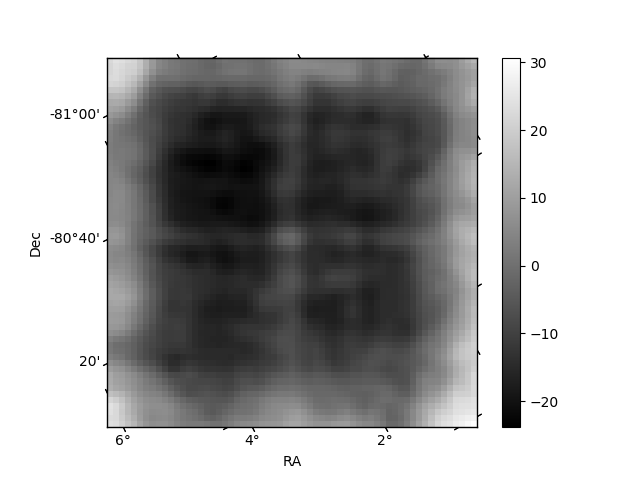
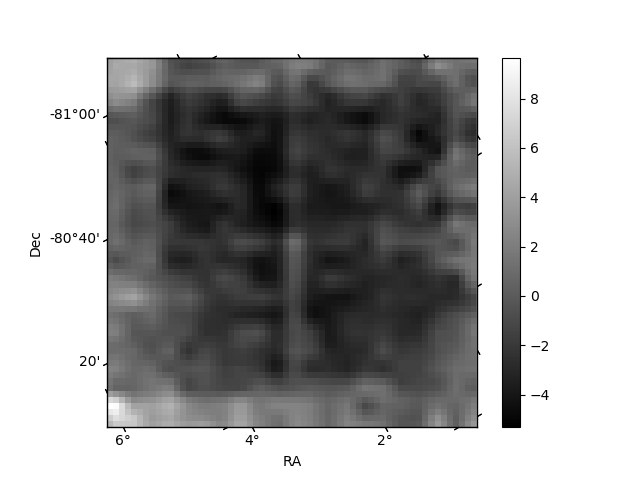
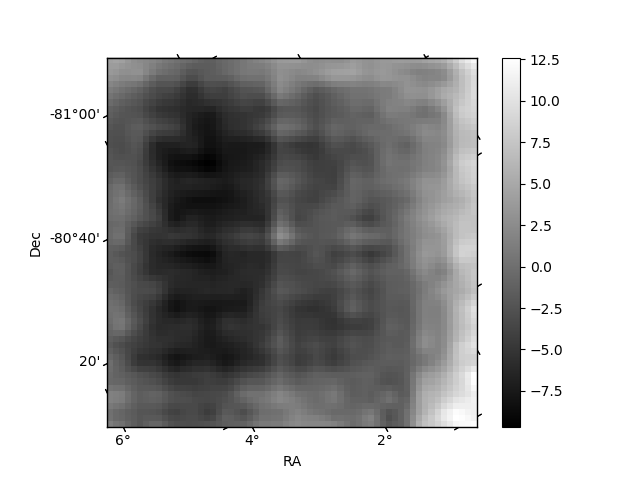
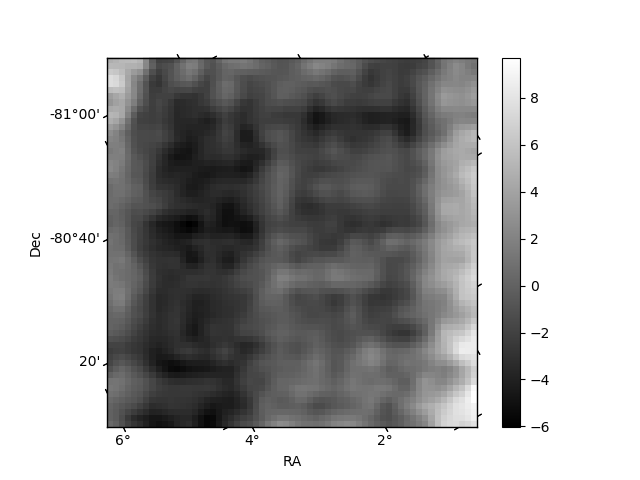
Histogram calculated using DETX and DETY for each event in the final _common_clean file
| Quadrant A | 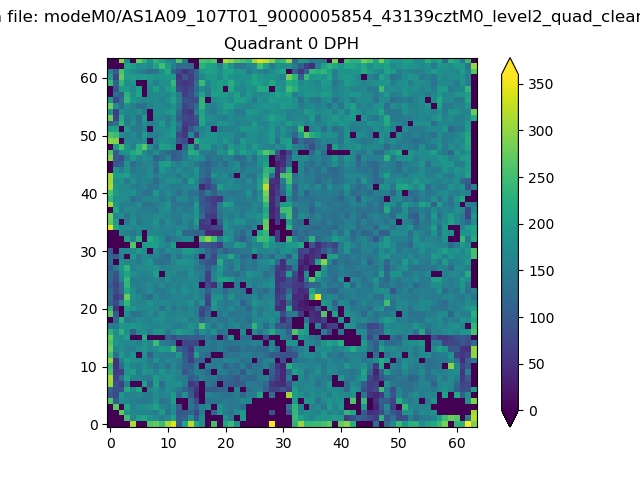 |
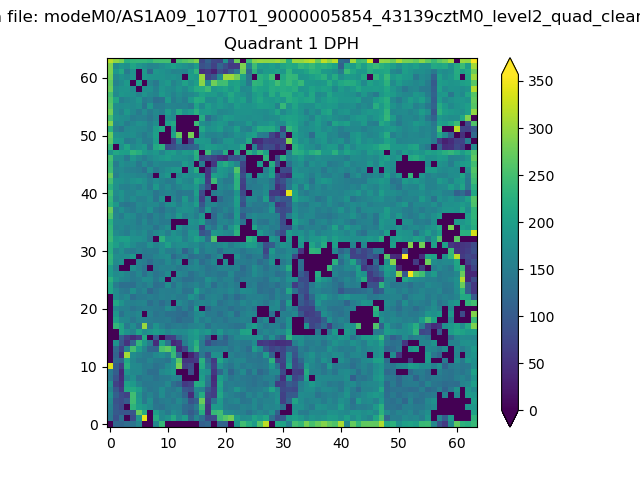 |
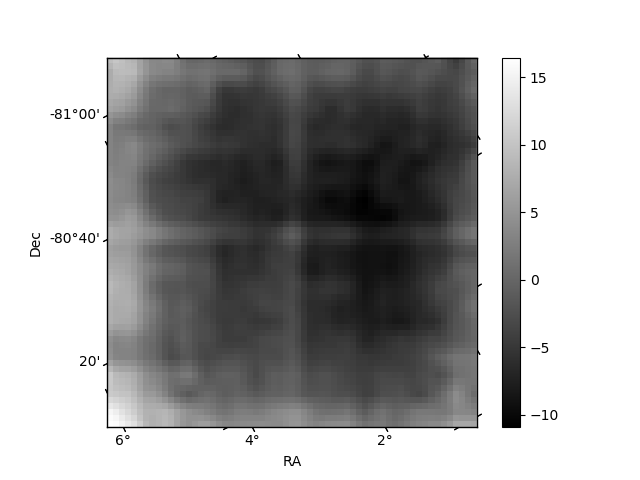
Quadrant B |
|---|---|---|---|
| Quadrant D | 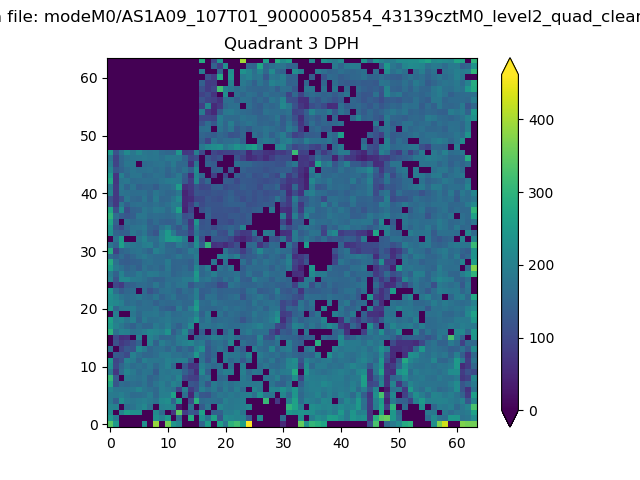 |
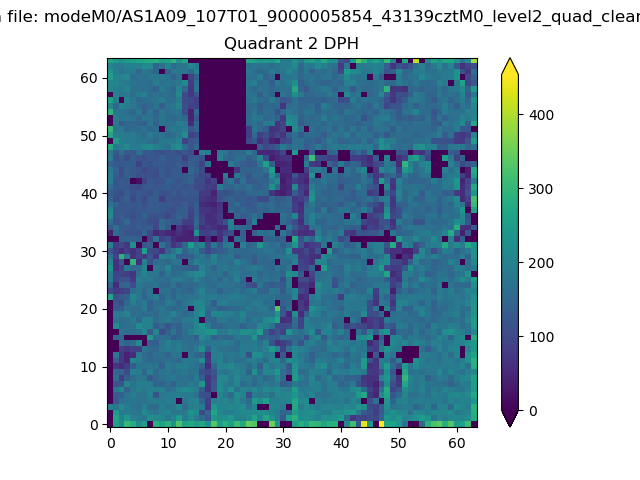 |
Quadrant C |
| Plot type | Count rate plots | Images |
|---|---|---|
| Comparison with Poisson distribution Blue bars denote a histogram of data divided into 1 sec bins. Red curve is a Poisson curve with rate = median count rate of data. |
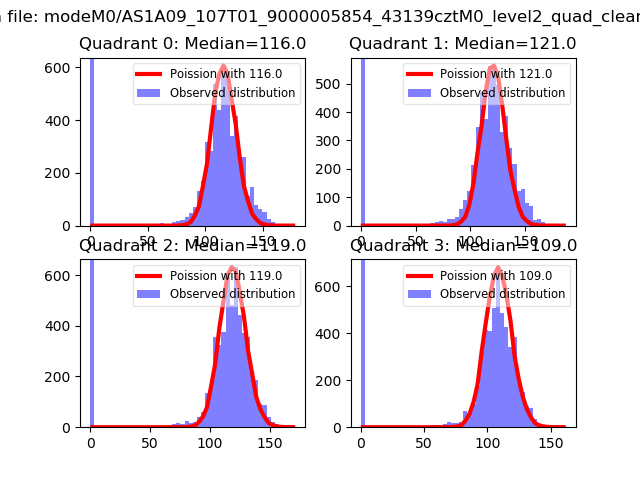 |
 |
| Quadrant-wise count rates Data is divided into 100 sec bins |
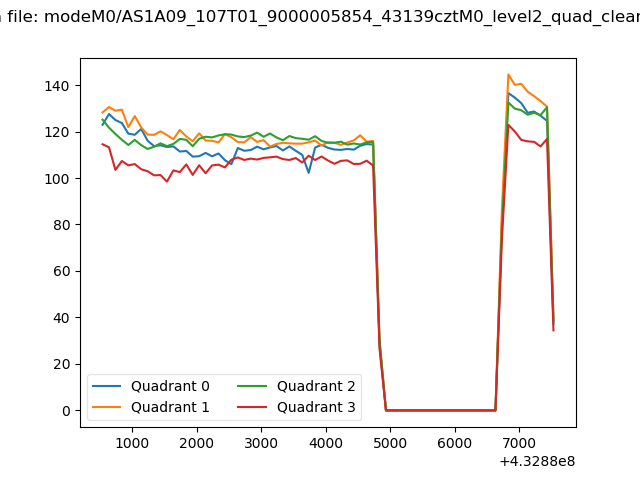 |
|
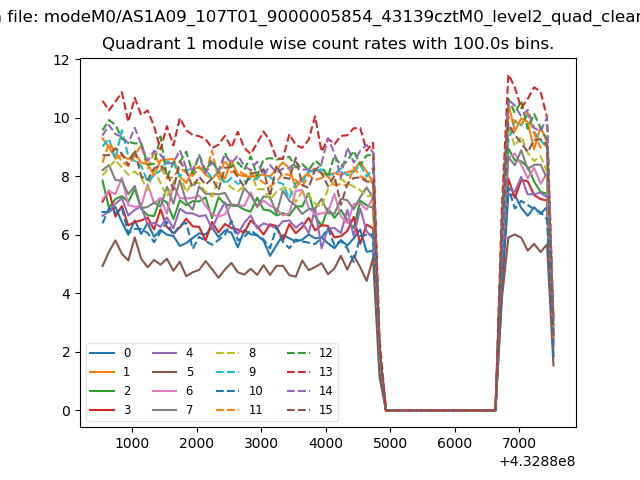
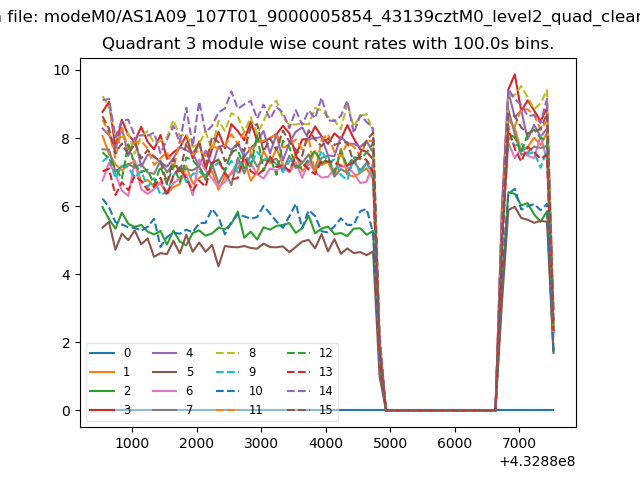
| Module-wise count rates for Quadrant A Data is divided into 100 sec bins |
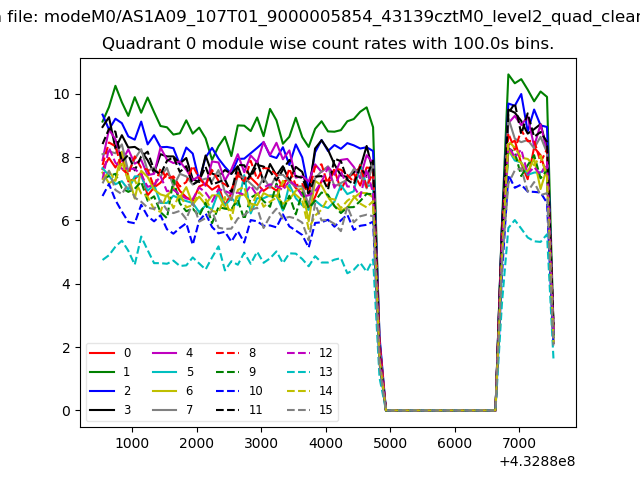 |
 |
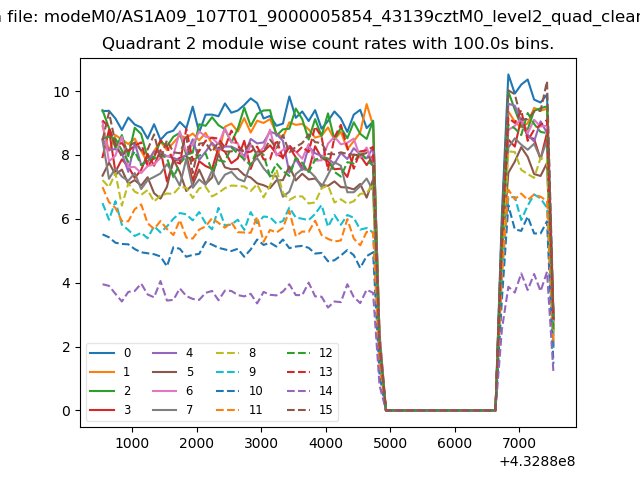
| Module-wise count rates for Quadrant B Data is divided into 100 sec bins |
 |
 |
| Module-wise count rates for Quadrant C Data is divided into 100 sec bins |
 |
 |
| Module-wise count rates for Quadrant D Data is divided into 100 sec bins |
 |
 |
| Parameter | Plot |
|---|---|
| CZT HV Monitor |  |
| D_VDD | 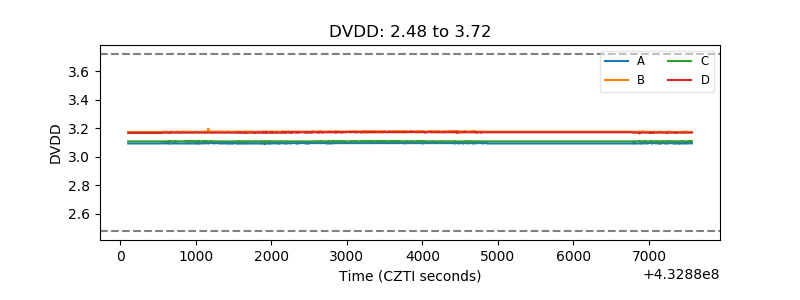 |
| Temperature 1 | 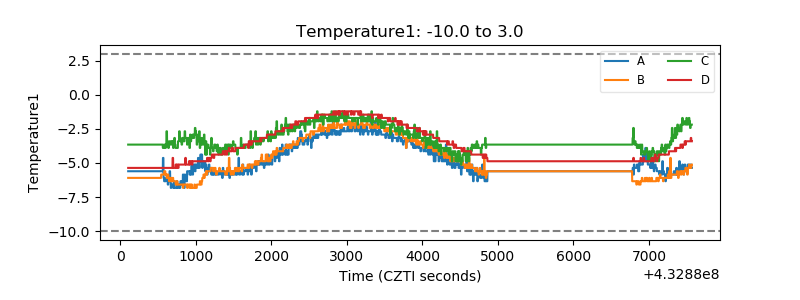 |
| Veto HV Monitor | 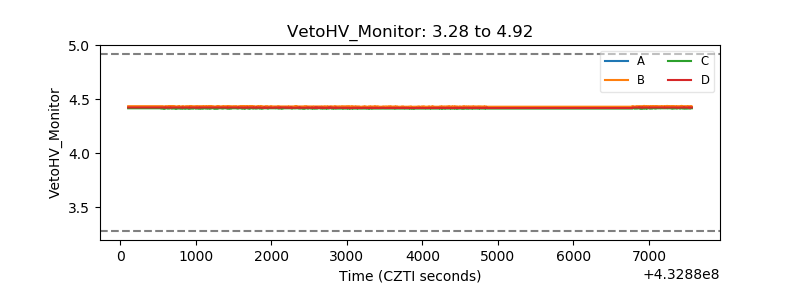 |
| Veto LLD | 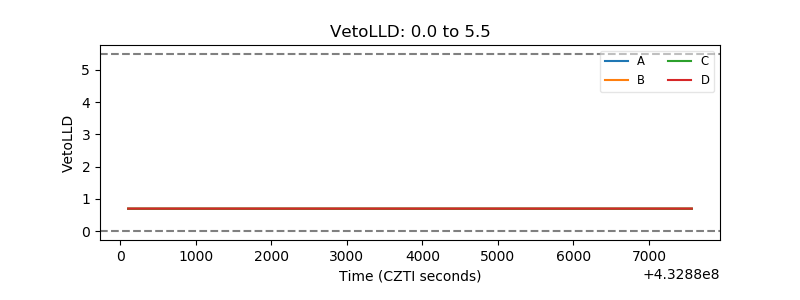 |
| Alpha Counter | 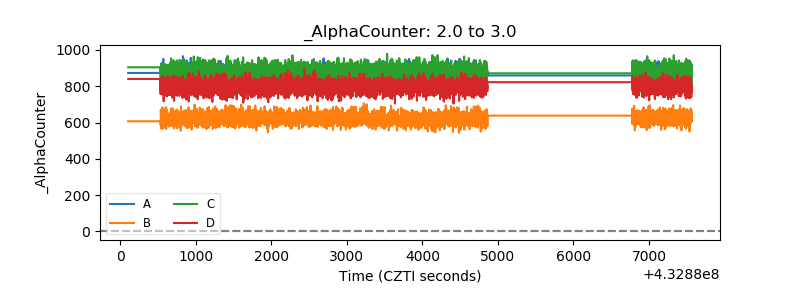 |
| _CPM_Rate | 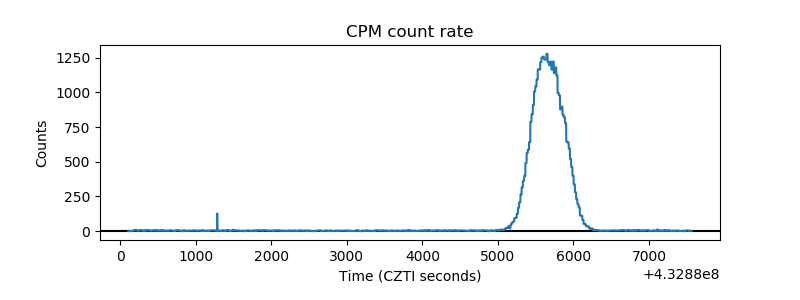 |
| CZT Counter | 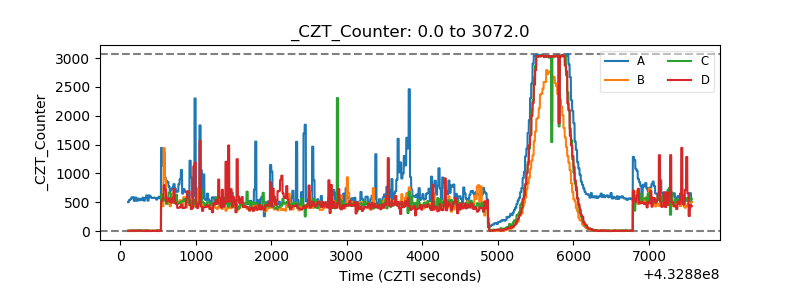 |
| +2.5 Volts monitor |  |
| +5 Volts monitor | 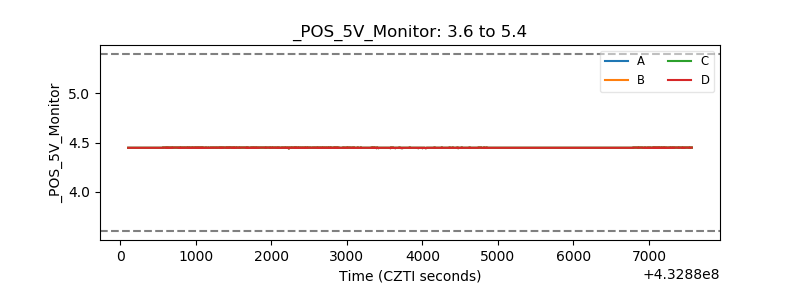 |
| _ROLL_ROT | 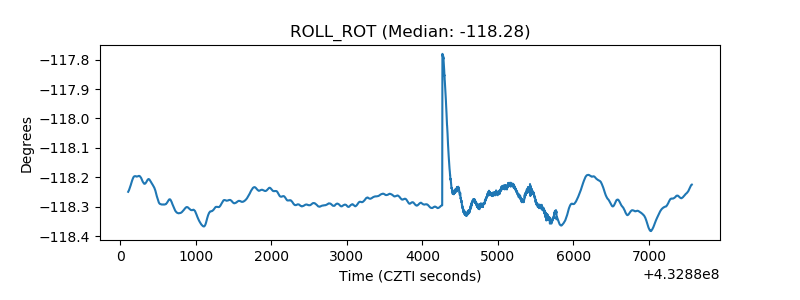 |
| _Roll_DEC | 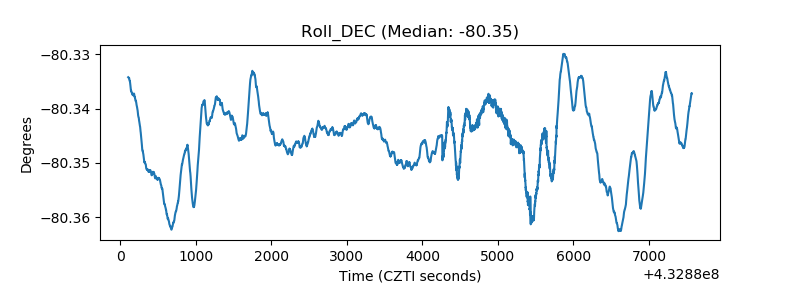 |
| _Roll_RA | 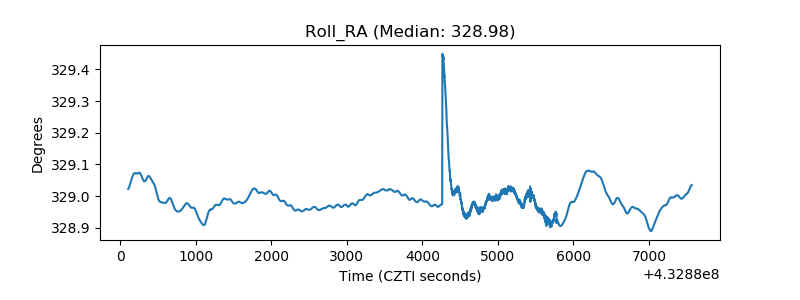 |
| Veto Counter | 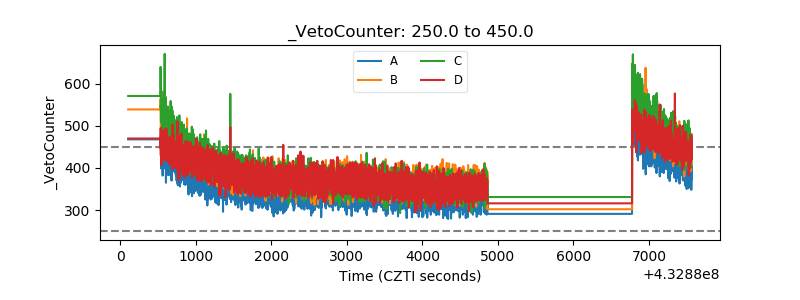 |