| Param | Original file | Final file |
|---|---|---|
| Filename | modeM0/AS1A09_107T01_9000005854_43140cztM0_level2.fits | modeM0/AS1A09_107T01_9000005854_43140cztM0_level2_quad_clean.evt |
| Size (bytes) | 322,390,080 | 92,980,800 |
| Size | 307.5 MB | 88.7 MB |
| Events in quadrant A | 3,681,265 | 618,640 |
| Events in quadrant B | 2,658,875 | 626,379 |
| Events in quadrant C | 2,511,750 | 634,951 |
| Events in quadrant D | 2,686,264 | 579,595 |
| Mode M0 | |||
|---|---|---|---|
| Quadrant | BADHDUFLAG | Total packets | Discarded packets |
| A | 0 | 14432 | 2 |
| B | 0 | 11248 | 3 |
| C | 0 | 10466 | 2 |
| D | 0 | 11388 | 2 |
| Mode M9 | |||
|---|---|---|---|
| Quadrant | BADHDUFLAG | Total packets | Discarded packets |
| A | 0 | 25 | 0 |
| B | 0 | 26 | 0 |
| C | 0 | 26 | 0 |
| D | 0 | 26 | 0 |
| Mode SS | |||
|---|---|---|---|
| Quadrant | BADHDUFLAG | Total packets | Discarded packets |
| A | 0 | 104 | 0 |
| B | 0 | 104 | 0 |
| C | 0 | 104 | 0 |
| D | 0 | 104 | 0 |
| Quadrant | Total seconds | Saturated seconds | Saturation percentage |
|---|---|---|---|
| A | 5081 | 45 | 0.885652% |
| B | 5080 | 183 | 3.602362% |
| C | 5080 | 8 | 0.157480% |
| D | 5080 | 47 | 0.925197% |
Noise dominated data is calculated using 1-second bins in cleaned event files. If a bin has >2000 counts, and if more than 50% of those come from <1% of pixels, then it is considered to be noise-dominated and hence unusable.
| Quadrant | # 1 sec bins | Bins with >0 counts | Bins with >2000 counts | High rate bins dominated by noise | Noise dominated (total time) | Noise dominated (detector-on time) | Marked lightcurve |
|---|---|---|---|---|---|---|---|
| A | 7114 | 5082 | 25 | 25 | 0.35% | 0.49% | 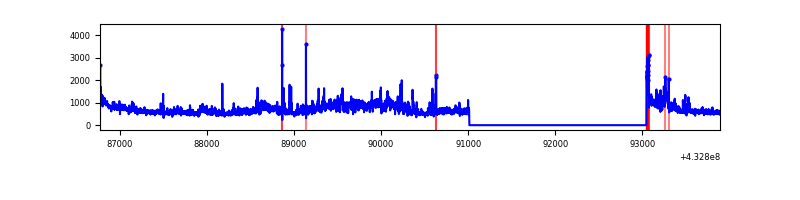 |
| B | 7112 | 5080 | 136 | 136 | 1.91% | 2.68% | 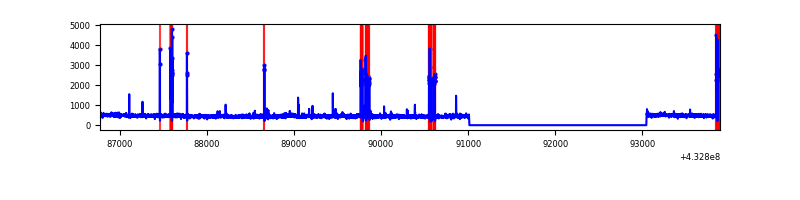 |
| C | 7113 | 5081 | 3 | 3 | 0.04% | 0.06% | 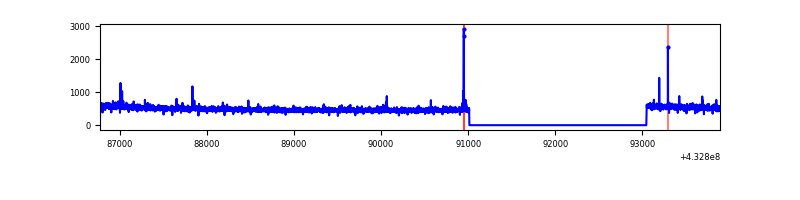 |
| D | 7113 | 5081 | 39 | 39 | 0.55% | 0.77% | 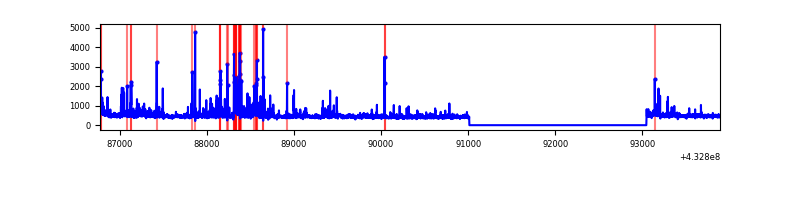 |
Top three noisy pixels from each quadrant. If the there are fewer than three noisy pixels in the level2.evt file, extra rows are filled as -1
| Pixel properties | Quadrant properties | ||||||
|---|---|---|---|---|---|---|---|
| Quadrant | DetID | PixID | Counts | Sigma | Mean | Median | Sigma |
| A | 10 | 83 | 558046 | 4738.33 | 577 | 566 | 117.7 |
| A | 15 | 222 | 410622 | 3485.29 | 577 | 566 | 117.7 |
| A | 12 | 189 | 323324 | 2743.3 | 577 | 566 | 117.7 |
| B | 0 | 229 | 422091 | 4028.35 | 558 | 546 | 104.6 |
| B | 5 | 255 | 23209 | 216.57 | 558 | 546 | 104.6 |
| B | 0 | 186 | 22103 | 206.0 | 558 | 546 | 104.6 |
| C | 15 | 214 | 231256 | 1759.5 | 575 | 578 | 131.1 |
| C | 14 | 254 | 29348 | 219.44 | 575 | 578 | 131.1 |
| C | 0 | 239 | 4908 | 33.03 | 575 | 578 | 131.1 |
| D | 12 | 16 | 188377 | 1360.18 | 574 | 559 | 138.1 |
| D | 1 | 52 | 173049 | 1249.18 | 574 | 559 | 138.1 |
| D | 12 | 6 | 28960 | 205.68 | 574 | 559 | 138.1 |
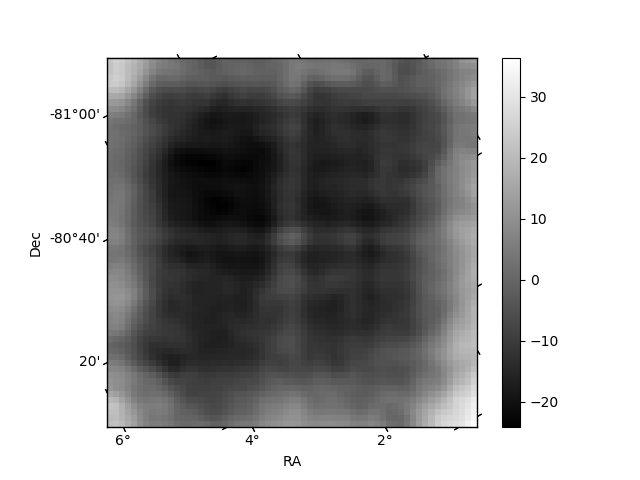
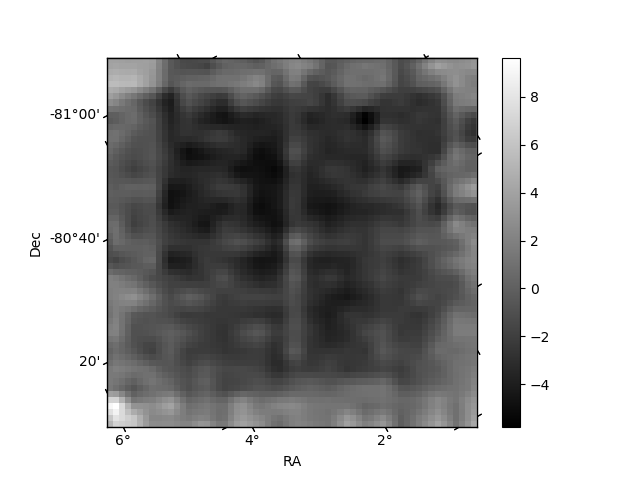
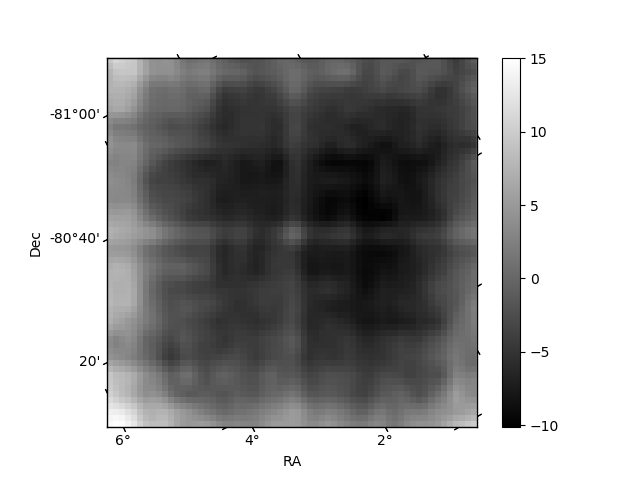
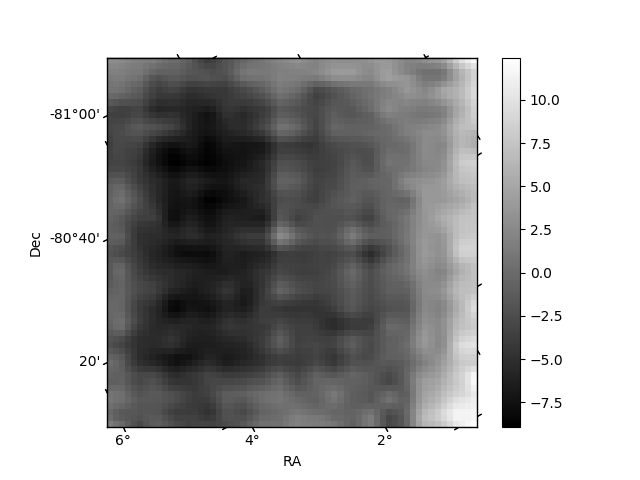
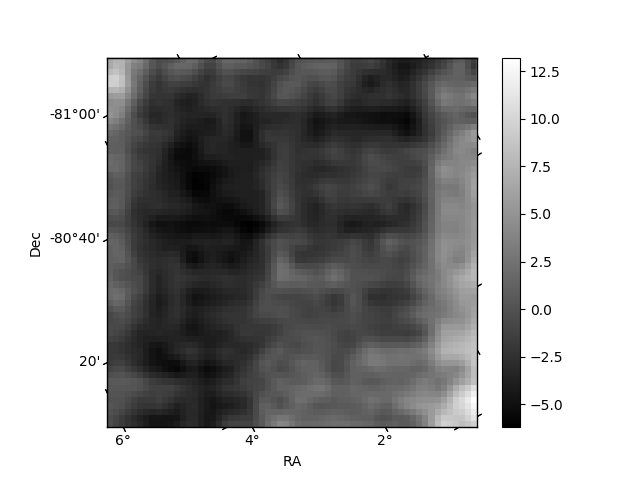
Histogram calculated using DETX and DETY for each event in the final _common_clean file
| Quadrant A | 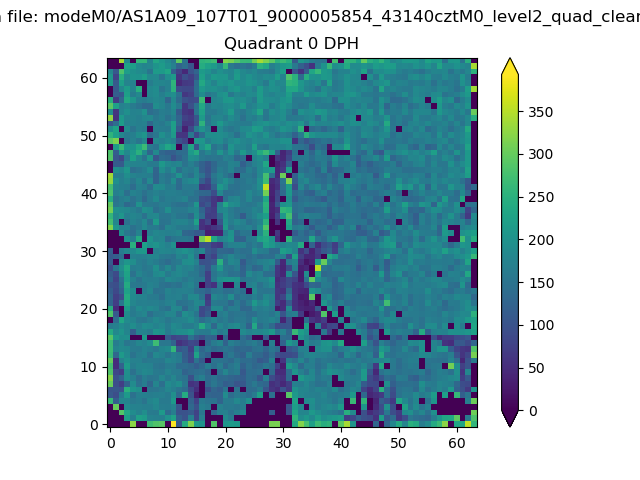 |
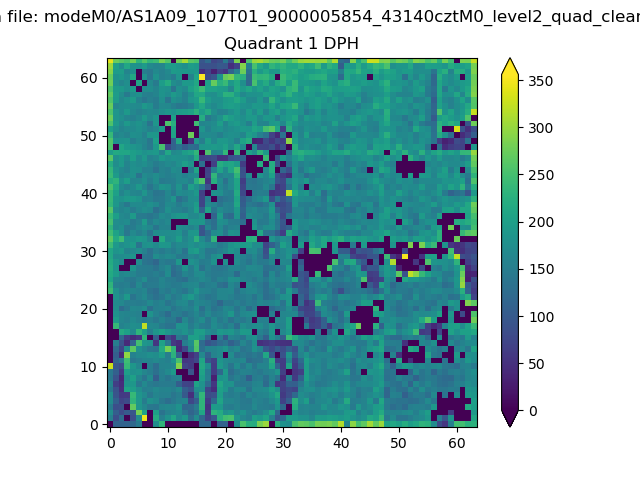 |
Quadrant B |
|---|---|---|---|
| Quadrant D | 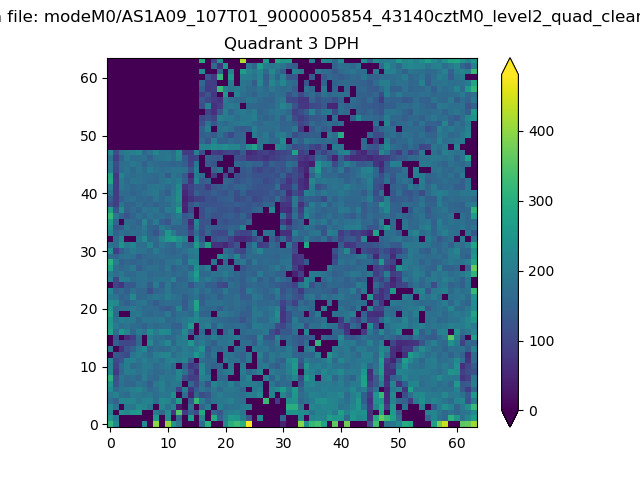 |
 |
Quadrant C |
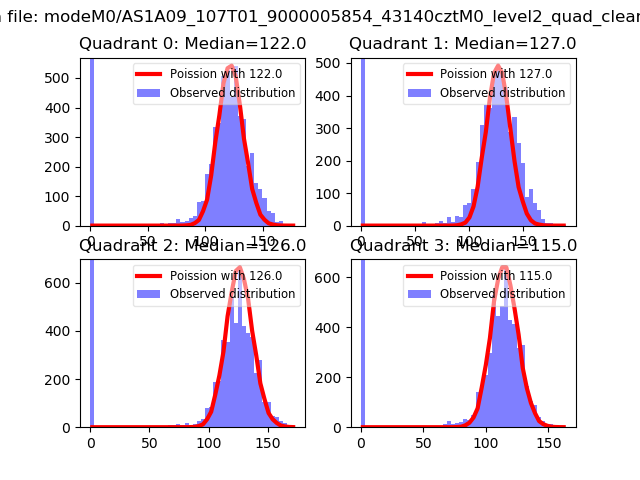
| Plot type | Count rate plots | Images |
|---|---|---|
| Comparison with Poisson distribution Blue bars denote a histogram of data divided into 1 sec bins. Red curve is a Poisson curve with rate = median count rate of data. |
 |
 |
| Quadrant-wise count rates Data is divided into 100 sec bins |
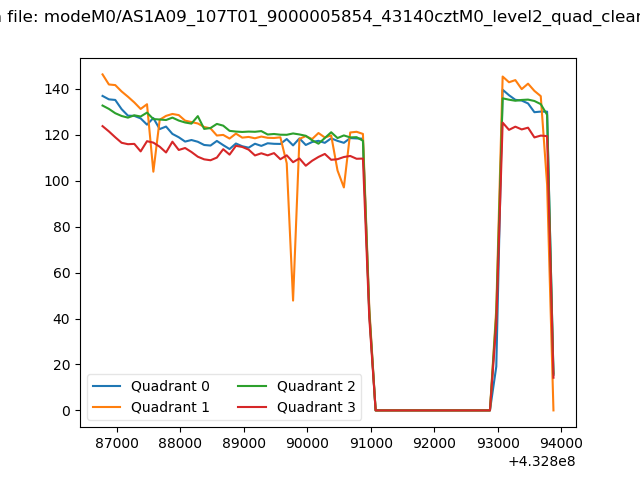 |
|
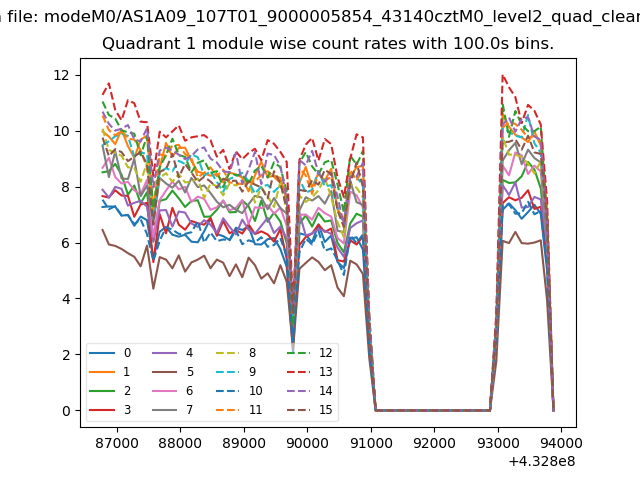
| Module-wise count rates for Quadrant A Data is divided into 100 sec bins |
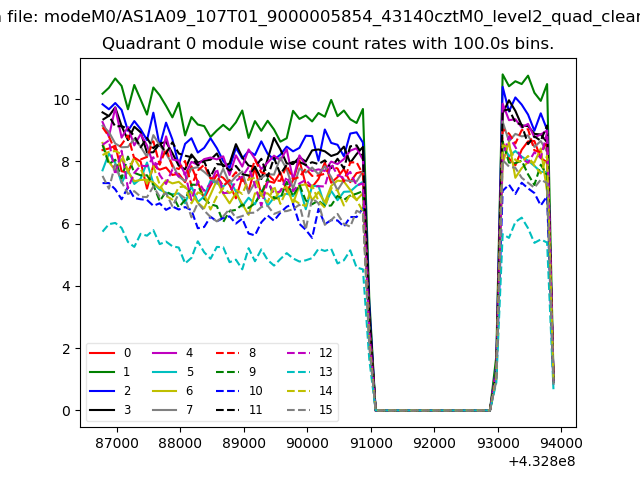 |
 |
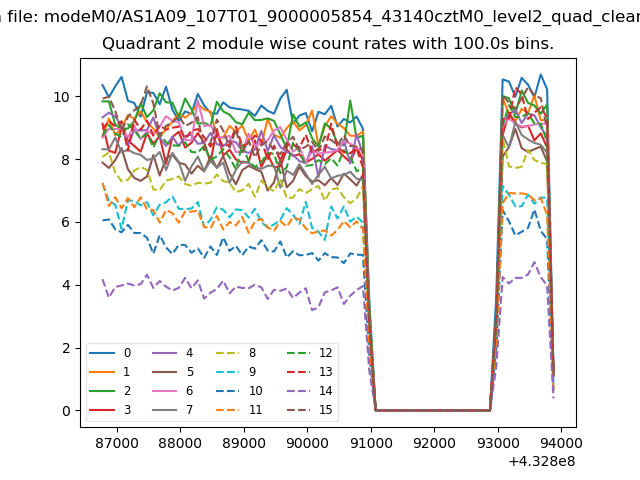
| Module-wise count rates for Quadrant B Data is divided into 100 sec bins |
 |
 |
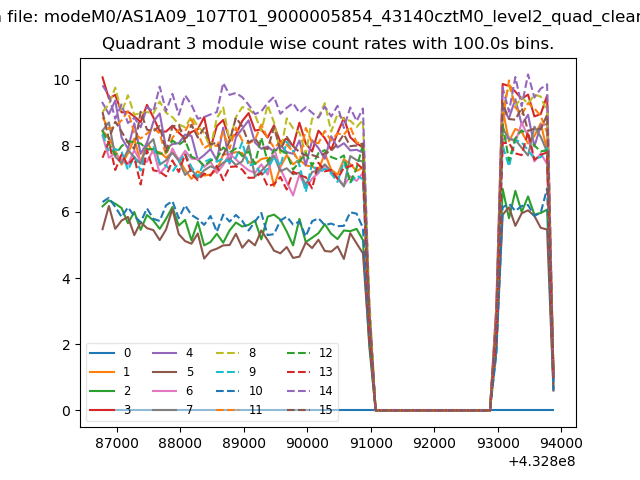
| Module-wise count rates for Quadrant C Data is divided into 100 sec bins |
 |
 |
| Module-wise count rates for Quadrant D Data is divided into 100 sec bins |
 |
 |
| Parameter | Plot |
|---|---|
| CZT HV Monitor | 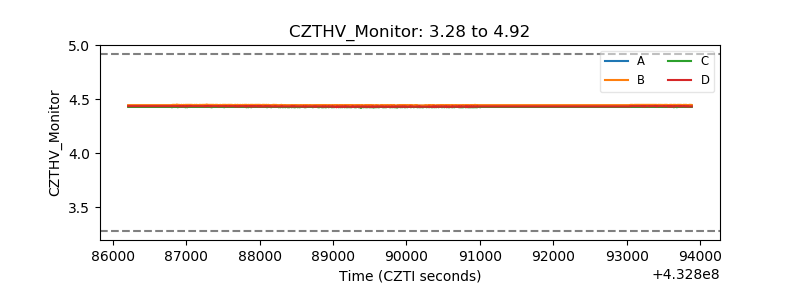 |
| D_VDD | 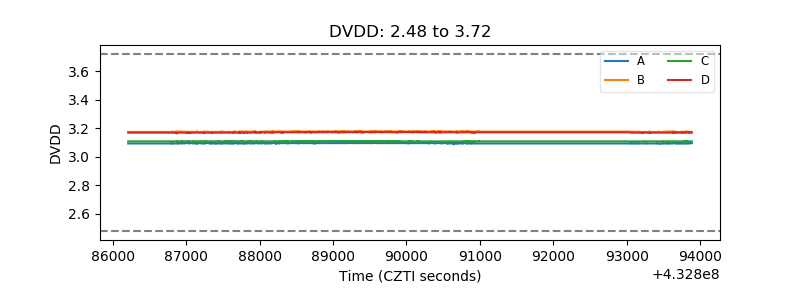 |
| Temperature 1 | 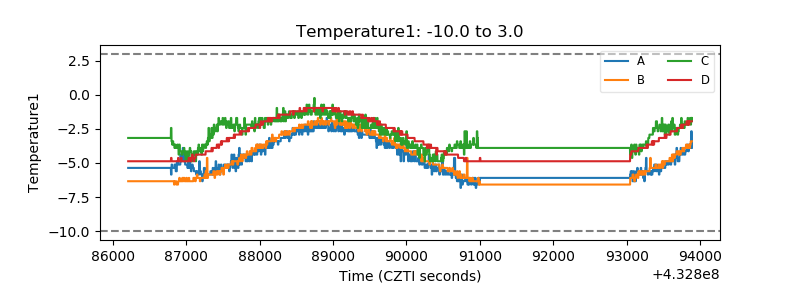 |
| Veto HV Monitor | 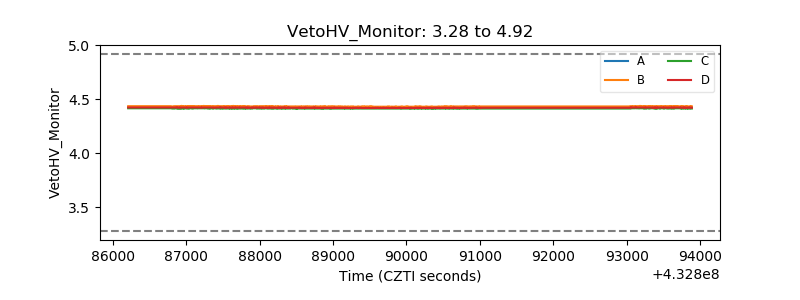 |
| Veto LLD | 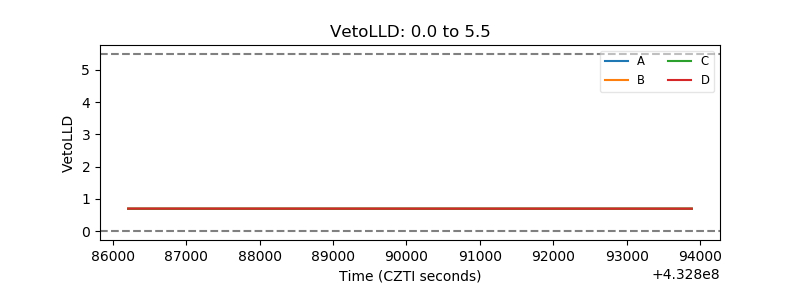 |
| Alpha Counter | 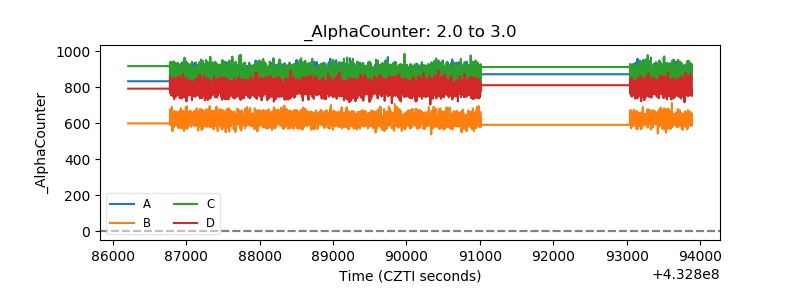 |
| _CPM_Rate | 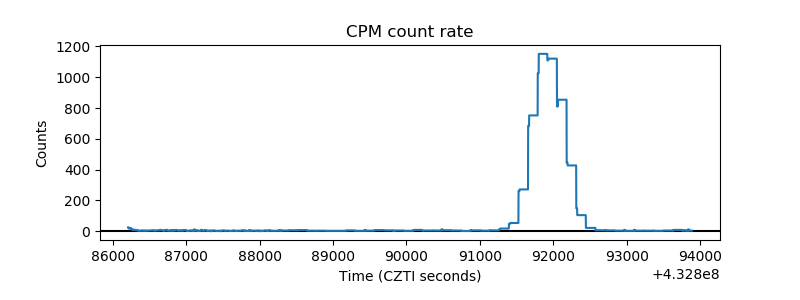 |
| CZT Counter | 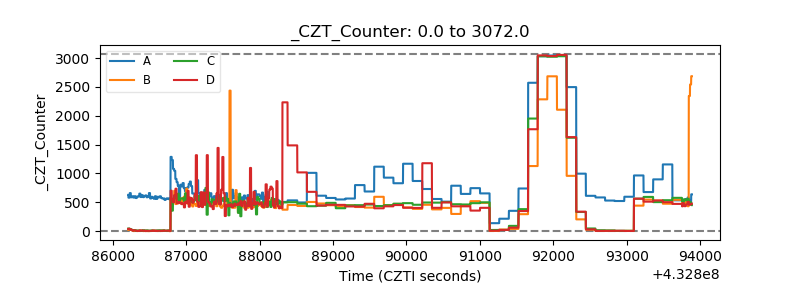 |
| +2.5 Volts monitor |  |
| +5 Volts monitor |  |
| _ROLL_ROT | 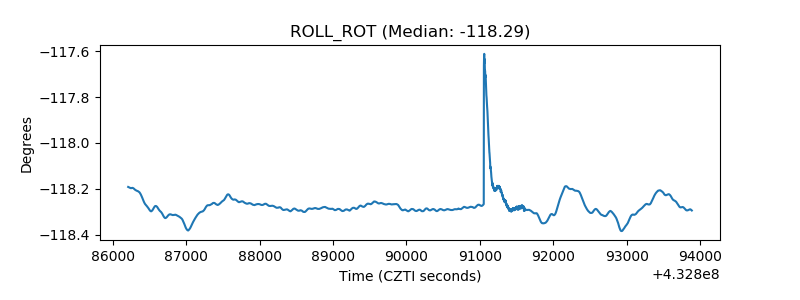 |
| _Roll_DEC | 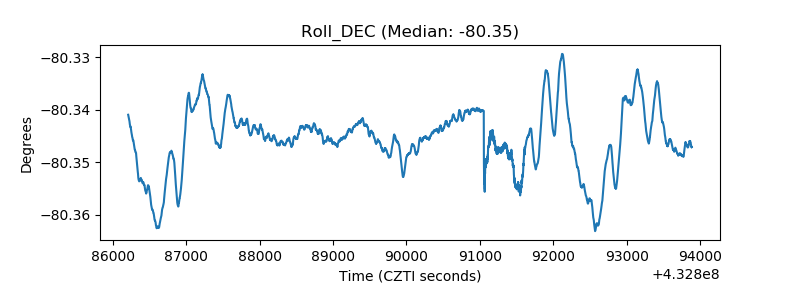 |
| _Roll_RA | 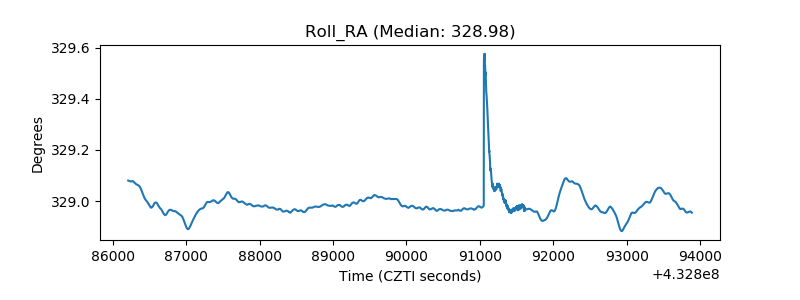 |
| Veto Counter | 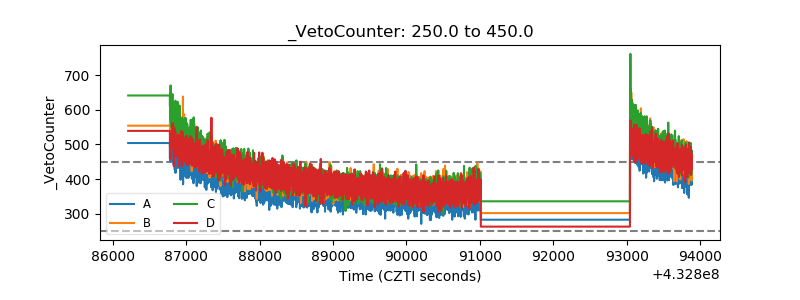 |