| Param | Original file | Final file |
|---|---|---|
| Filename | modeM0/AS1A09_107T01_9000005854_43141cztM0_level2.fits | modeM0/AS1A09_107T01_9000005854_43141cztM0_level2_quad_clean.evt |
| Size (bytes) | 303,770,880 | 86,932,800 |
| Size | 289.7 MB | 82.9 MB |
| Events in quadrant A | 3,029,403 | 589,522 |
| Events in quadrant B | 3,251,504 | 549,545 |
| Events in quadrant C | 2,397,920 | 604,006 |
| Events in quadrant D | 2,191,025 | 552,938 |
| Mode M0 | |||
|---|---|---|---|
| Quadrant | BADHDUFLAG | Total packets | Discarded packets |
| A | 0 | 11992 | 1 |
| B | 0 | 12877 | 1 |
| C | 0 | 9948 | 1 |
| D | 0 | 9866 | 1 |
| Mode M9 | |||
|---|---|---|---|
| Quadrant | BADHDUFLAG | Total packets | Discarded packets |
| A | 0 | 22 | 0 |
| B | 0 | 22 | 0 |
| C | 0 | 22 | 0 |
| D | 0 | 22 | 0 |
| Mode SS | |||
|---|---|---|---|
| Quadrant | BADHDUFLAG | Total packets | Discarded packets |
| A | 0 | 96 | 0 |
| B | 0 | 96 | 0 |
| C | 0 | 96 | 0 |
| D | 0 | 96 | 0 |
| Quadrant | Total seconds | Saturated seconds | Saturation percentage |
|---|---|---|---|
| A | 4802 | 25 | 0.520616% |
| B | 4802 | 522 | 10.870471% |
| C | 4802 | 6 | 0.124948% |
| D | 4802 | 8 | 0.166597% |
Noise dominated data is calculated using 1-second bins in cleaned event files. If a bin has >2000 counts, and if more than 50% of those come from <1% of pixels, then it is considered to be noise-dominated and hence unusable.
| Quadrant | # 1 sec bins | Bins with >0 counts | Bins with >2000 counts | High rate bins dominated by noise | Noise dominated (total time) | Noise dominated (detector-on time) | Marked lightcurve |
|---|---|---|---|---|---|---|---|
| A | 6924 | 4803 | 11 | 11 | 0.16% | 0.23% | 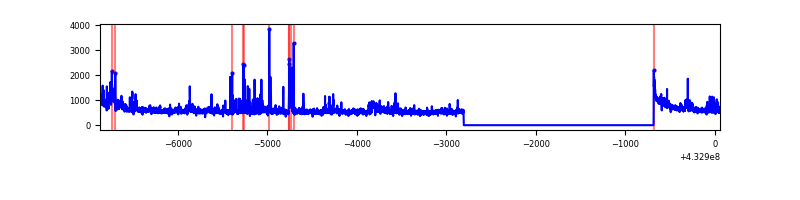 |
| B | 6924 | 4803 | 424 | 424 | 6.12% | 8.83% | 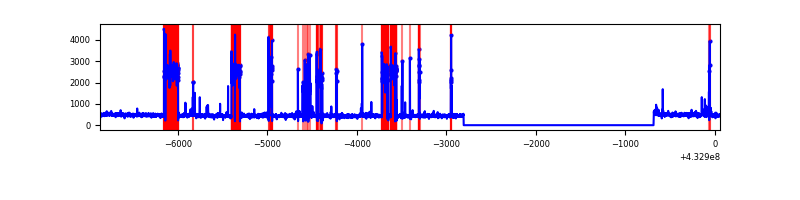 |
| C | 6924 | 4803 | 3 | 3 | 0.04% | 0.06% | 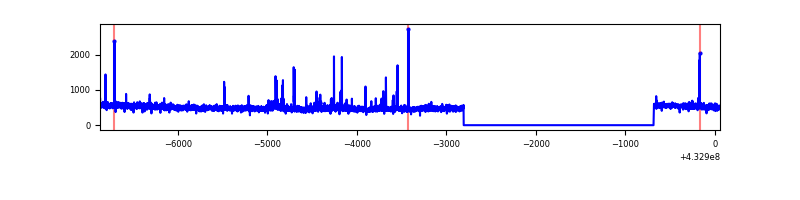 |
| D | 6924 | 4803 | 6 | 6 | 0.09% | 0.12% | 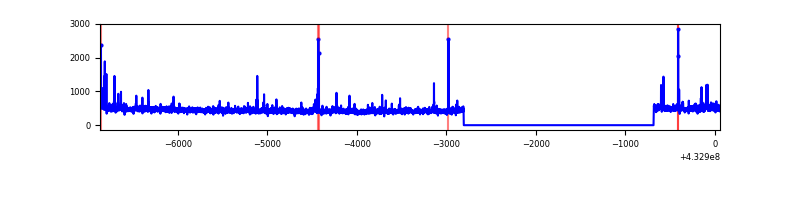 |
Top three noisy pixels from each quadrant. If the there are fewer than three noisy pixels in the level2.evt file, extra rows are filled as -1
| Pixel properties | Quadrant properties | ||||||
|---|---|---|---|---|---|---|---|
| Quadrant | DetID | PixID | Counts | Sigma | Mean | Median | Sigma |
| A | 10 | 83 | 495760 | 4462.44 | 546 | 536 | 111.0 |
| A | 12 | 189 | 236112 | 2122.76 | 546 | 536 | 111.0 |
| A | 15 | 237 | 149572 | 1342.95 | 546 | 536 | 111.0 |
| B | 0 | 229 | 1215681 | 13130.64 | 496 | 483 | 92.5 |
| B | 5 | 255 | 61411 | 658.35 | 496 | 483 | 92.5 |
| B | 5 | 32 | 17207 | 180.71 | 496 | 483 | 92.5 |
| C | 15 | 214 | 219162 | 1777.72 | 538 | 541 | 123.0 |
| C | 14 | 254 | 77729 | 627.65 | 538 | 541 | 123.0 |
| C | 13 | 61 | 3511 | 24.15 | 538 | 541 | 123.0 |
| D | 1 | 52 | 57202 | 435.72 | 540 | 525 | 130.1 |
| D | 2 | 234 | 23443 | 176.19 | 540 | 525 | 130.1 |
| D | 9 | 49 | 17772 | 132.59 | 540 | 525 | 130.1 |
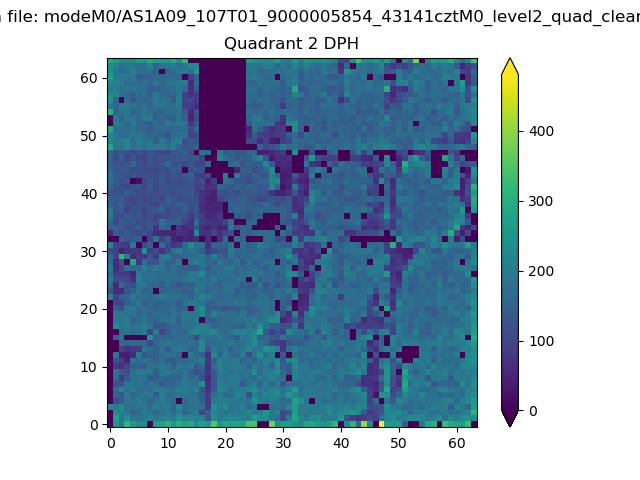
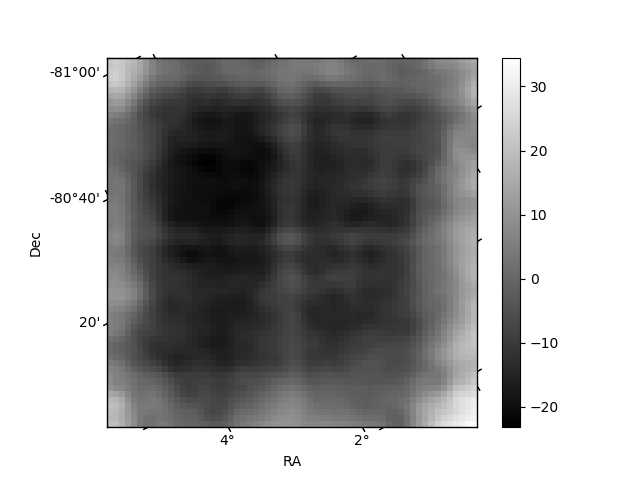
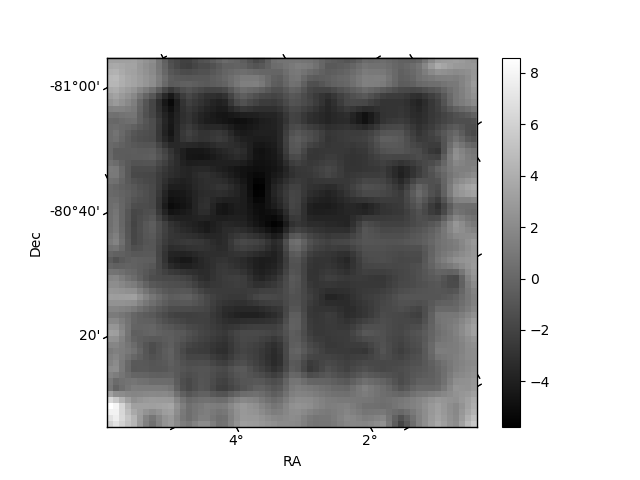
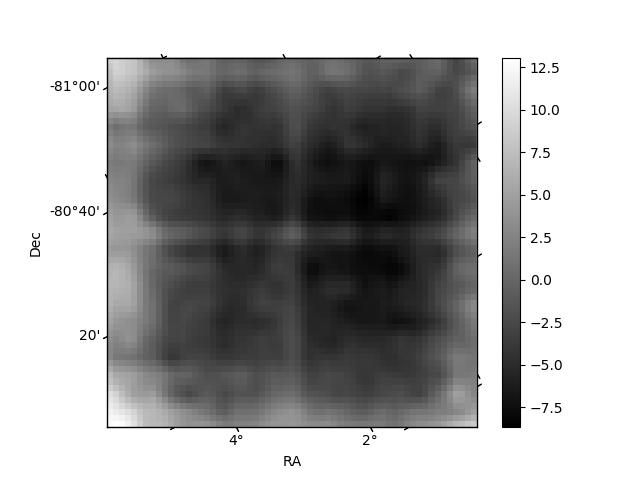
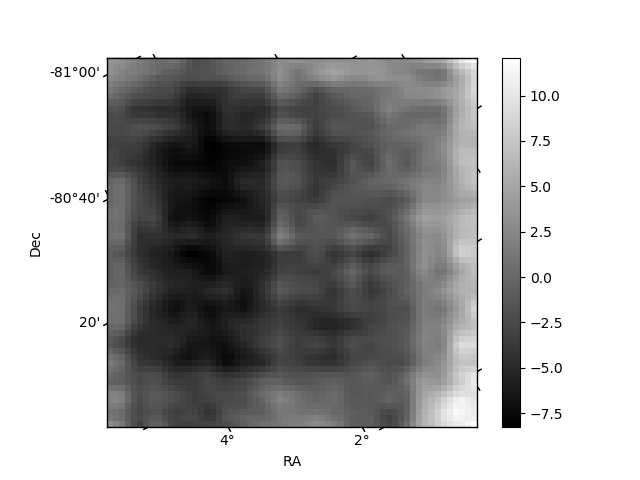
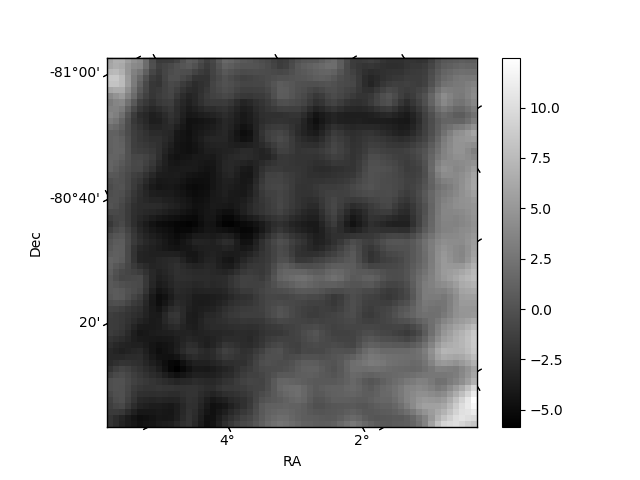
Histogram calculated using DETX and DETY for each event in the final _common_clean file
| Quadrant A | 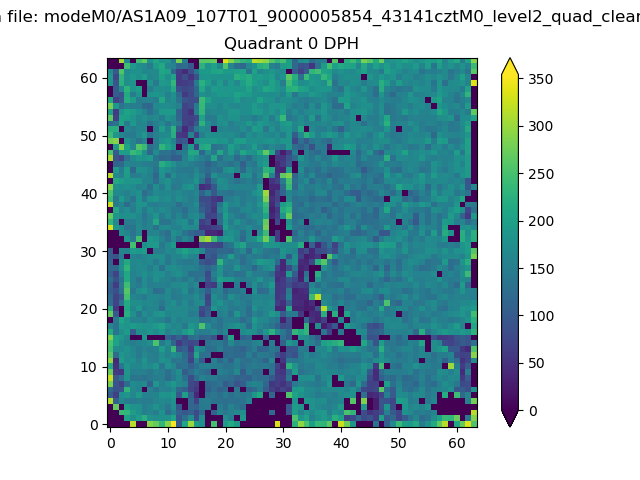 |
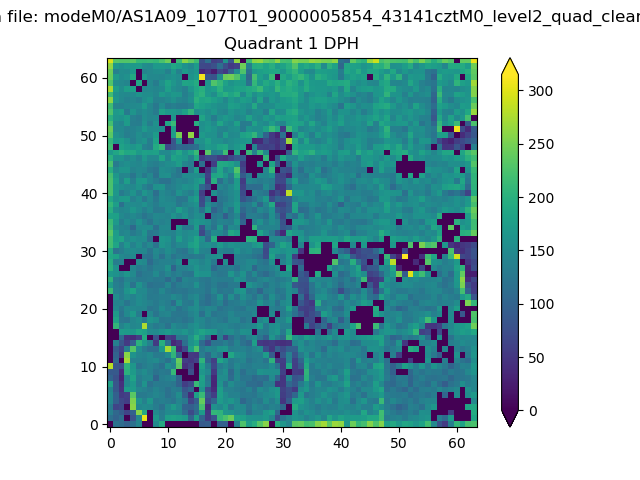 |
Quadrant B |
|---|---|---|---|
| Quadrant D | 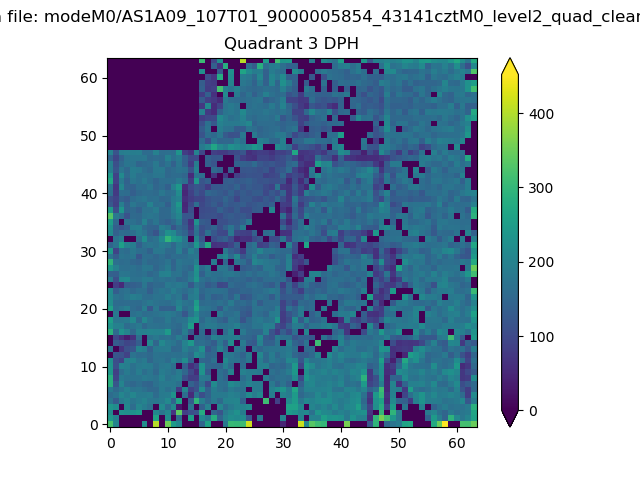 |
 |
Quadrant C |
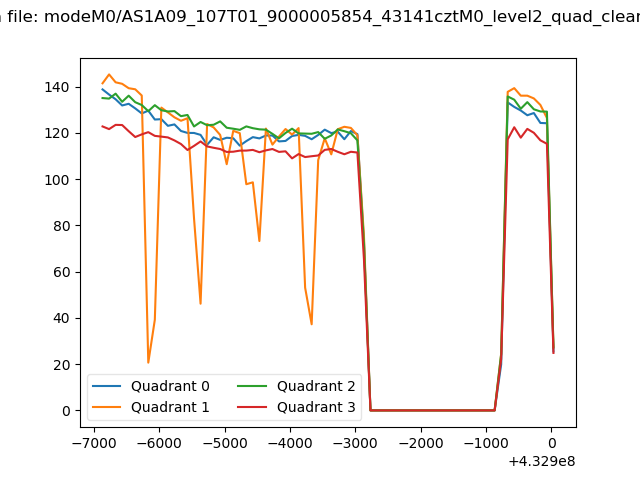
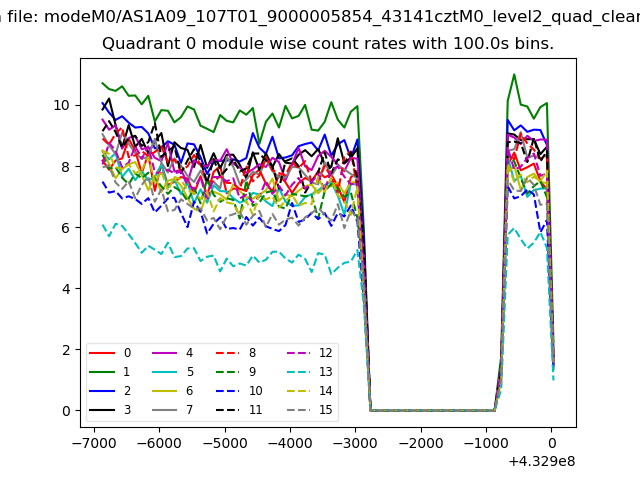
| Plot type | Count rate plots | Images |
|---|---|---|
| Comparison with Poisson distribution Blue bars denote a histogram of data divided into 1 sec bins. Red curve is a Poisson curve with rate = median count rate of data. |
 |
 |
| Quadrant-wise count rates Data is divided into 100 sec bins |
 |
|
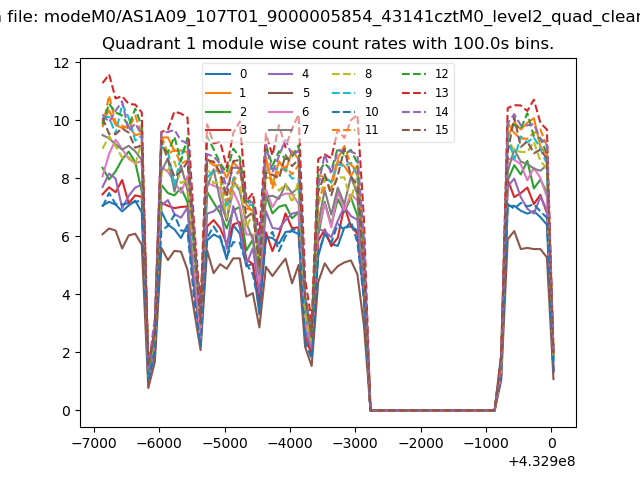
| Module-wise count rates for Quadrant A Data is divided into 100 sec bins |
 |
 |
| Module-wise count rates for Quadrant B Data is divided into 100 sec bins |
 |
 |
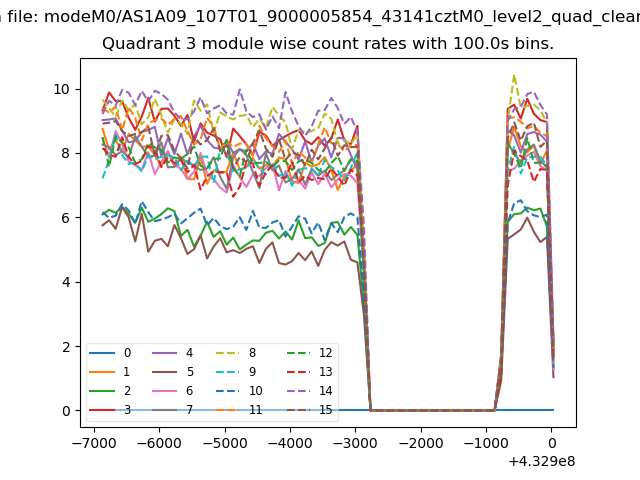
| Module-wise count rates for Quadrant C Data is divided into 100 sec bins |
 |
 |
| Module-wise count rates for Quadrant D Data is divided into 100 sec bins |
 |
 |
| Parameter | Plot |
|---|---|
| CZT HV Monitor | 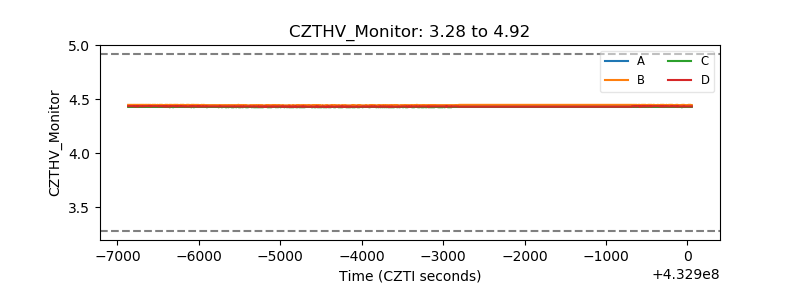 |
| D_VDD | 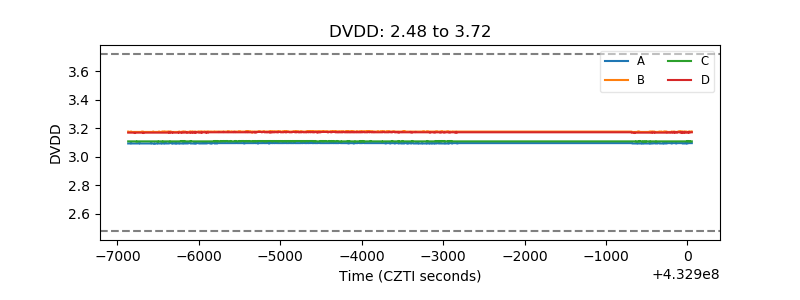 |
| Temperature 1 | 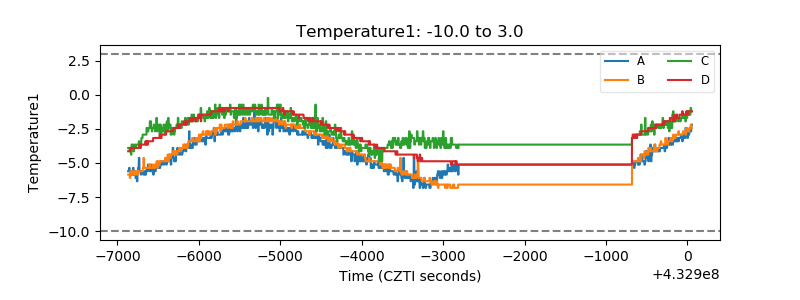 |
| Veto HV Monitor | 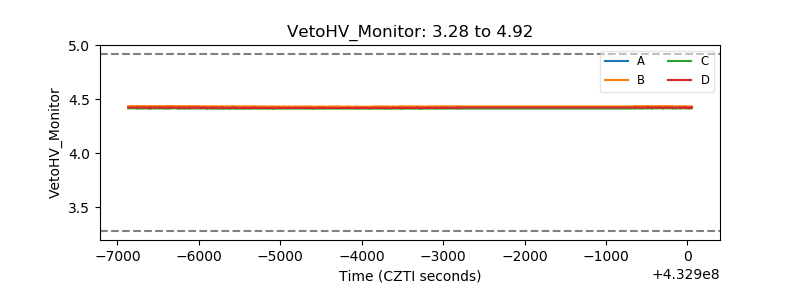 |
| Veto LLD | 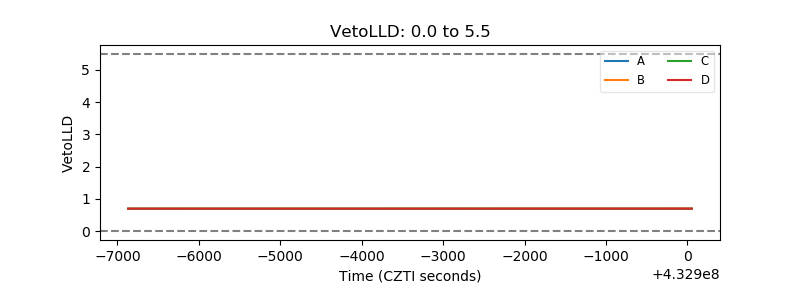 |
| Alpha Counter | 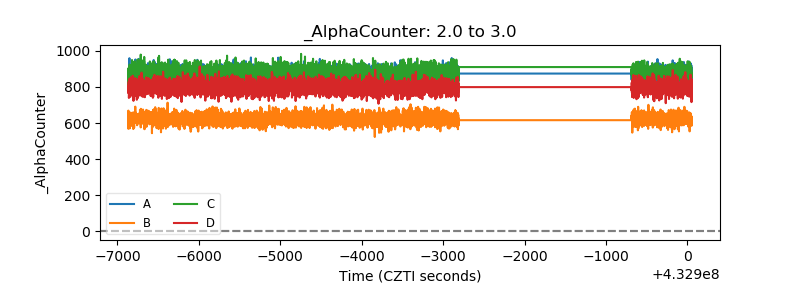 |
| _CPM_Rate | 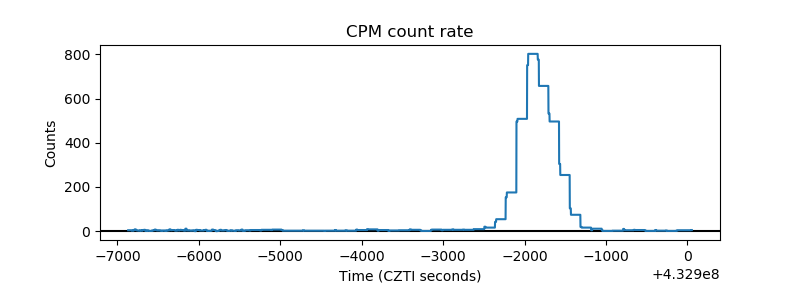 |
| CZT Counter | 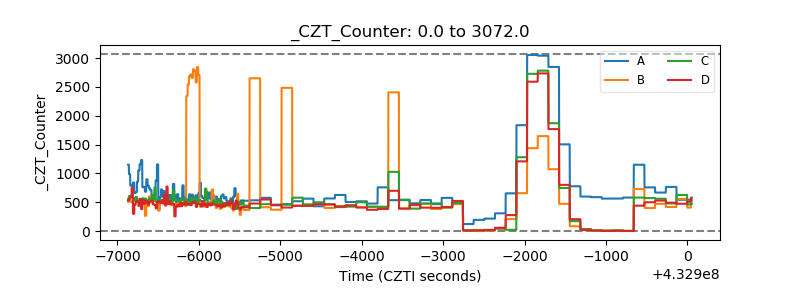 |
| +2.5 Volts monitor |  |
| +5 Volts monitor | 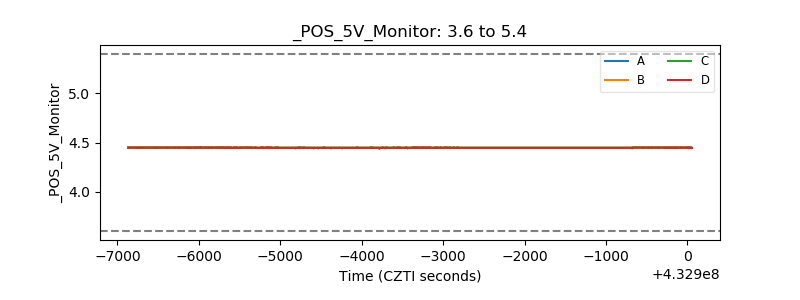 |
| _ROLL_ROT | 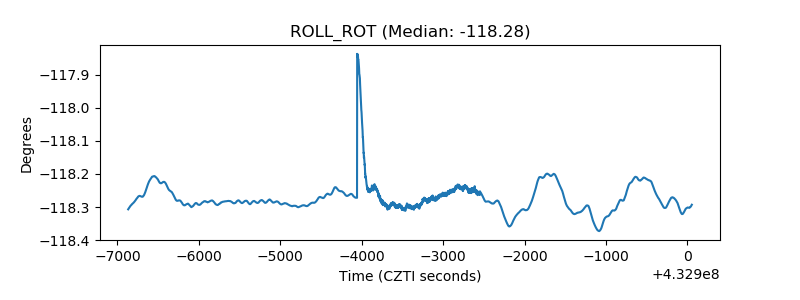 |
| _Roll_DEC | 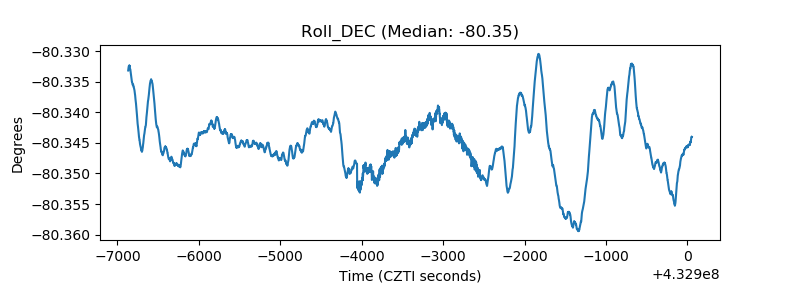 |
| _Roll_RA | 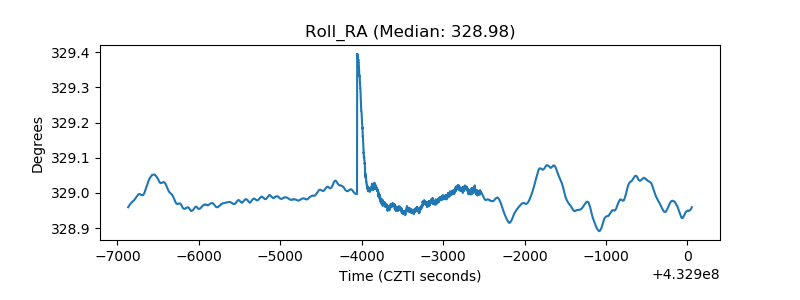 |
| Veto Counter | 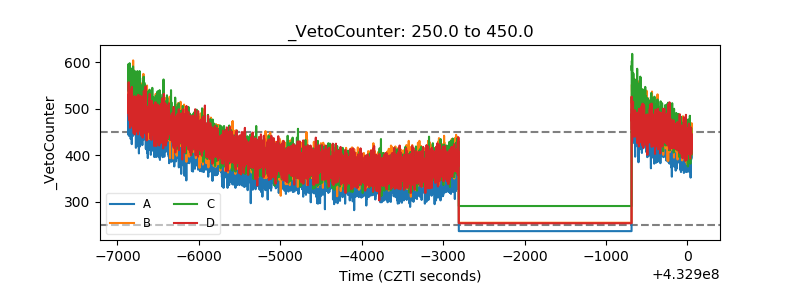 |