| Param | Original file | Final file |
|---|---|---|
| Filename | modeM0/AS1A09_107T01_9000005854_43142cztM0_level2.fits | modeM0/AS1A09_107T01_9000005854_43142cztM0_level2_quad_clean.evt |
| Size (bytes) | 382,521,600 | 91,618,560 |
| Size | 364.8 MB | 87.4 MB |
| Events in quadrant A | 3,616,682 | 615,602 |
| Events in quadrant B | 2,942,224 | 603,476 |
| Events in quadrant C | 2,561,777 | 631,924 |
| Events in quadrant D | 4,632,144 | 557,266 |
| Mode M0 | |||
|---|---|---|---|
| Quadrant | BADHDUFLAG | Total packets | Discarded packets |
| A | 0 | 14157 | 2 |
| B | 0 | 12378 | 2 |
| C | 0 | 10848 | 2 |
| D | 0 | 17316 | 2 |
| Mode M9 | |||
|---|---|---|---|
| Quadrant | BADHDUFLAG | Total packets | Discarded packets |
| A | 0 | 30 | 0 |
| B | 0 | 31 | 0 |
| C | 0 | 31 | 0 |
| D | 0 | 31 | 0 |
| Mode SS | |||
|---|---|---|---|
| Quadrant | BADHDUFLAG | Total packets | Discarded packets |
| A | 0 | 106 | 0 |
| B | 0 | 106 | 0 |
| C | 0 | 106 | 0 |
| D | 0 | 106 | 0 |
| Quadrant | Total seconds | Saturated seconds | Saturation percentage |
|---|---|---|---|
| A | 5231 | 57 | 1.089658% |
| B | 5231 | 318 | 6.079144% |
| C | 5231 | 17 | 0.324986% |
| D | 5231 | 290 | 5.543873% |
Noise dominated data is calculated using 1-second bins in cleaned event files. If a bin has >2000 counts, and if more than 50% of those come from <1% of pixels, then it is considered to be noise-dominated and hence unusable.
| Quadrant | # 1 sec bins | Bins with >0 counts | Bins with >2000 counts | High rate bins dominated by noise | Noise dominated (total time) | Noise dominated (detector-on time) | Marked lightcurve |
|---|---|---|---|---|---|---|---|
| A | 7385 | 5232 | 25 | 25 | 0.34% | 0.48% | 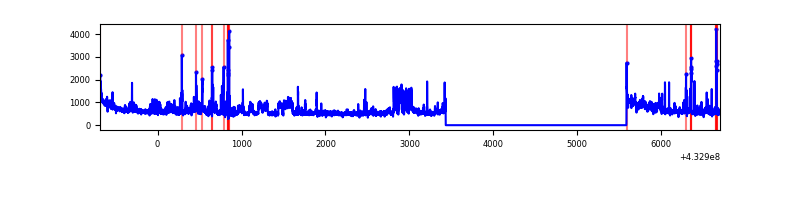 |
| B | 7385 | 5232 | 259 | 259 | 3.51% | 4.95% | 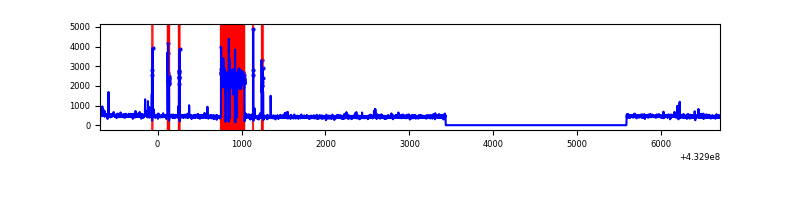 |
| C | 7385 | 5232 | 11 | 11 | 0.15% | 0.21% | 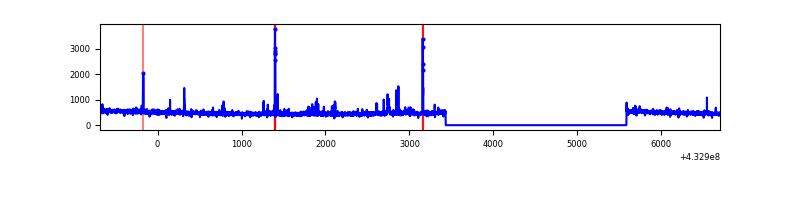 |
| D | 7385 | 5232 | 263 | 263 | 3.56% | 5.03% | 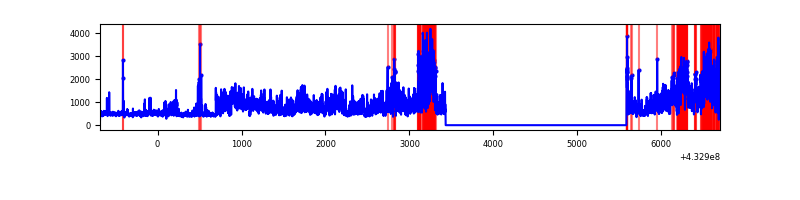 |
Top three noisy pixels from each quadrant. If the there are fewer than three noisy pixels in the level2.evt file, extra rows are filled as -1
| Pixel properties | Quadrant properties | ||||||
|---|---|---|---|---|---|---|---|
| Quadrant | DetID | PixID | Counts | Sigma | Mean | Median | Sigma |
| A | 10 | 83 | 587922 | 5005.32 | 575 | 565 | 117.3 |
| A | 15 | 222 | 360734 | 3069.28 | 575 | 565 | 117.3 |
| A | 12 | 189 | 226394 | 1924.46 | 575 | 565 | 117.3 |
| B | 0 | 229 | 717927 | 7021.25 | 546 | 532 | 102.2 |
| B | 5 | 255 | 46353 | 448.46 | 546 | 532 | 102.2 |
| B | 0 | 230 | 17063 | 161.79 | 546 | 532 | 102.2 |
| C | 15 | 214 | 235995 | 1820.16 | 566 | 569 | 129.3 |
| C | 14 | 254 | 107172 | 824.18 | 566 | 569 | 129.3 |
| C | 0 | 239 | 4565 | 30.89 | 566 | 569 | 129.3 |
| D | 1 | 52 | 2053841 | 15087.0 | 559 | 545 | 136.1 |
| D | 7 | 223 | 301138 | 2208.67 | 559 | 545 | 136.1 |
| D | 12 | 16 | 63737 | 464.32 | 559 | 545 | 136.1 |
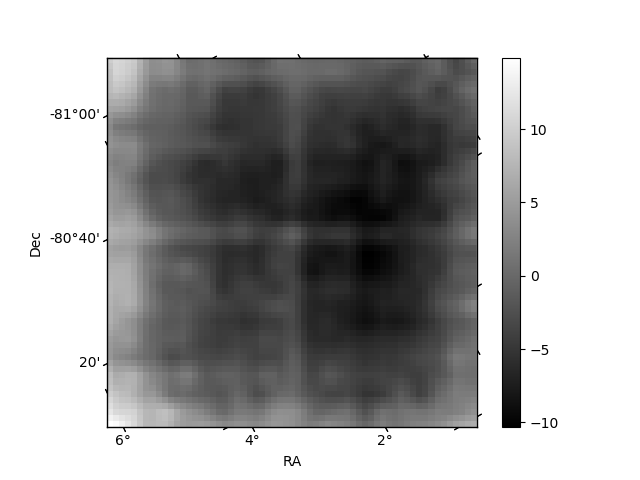
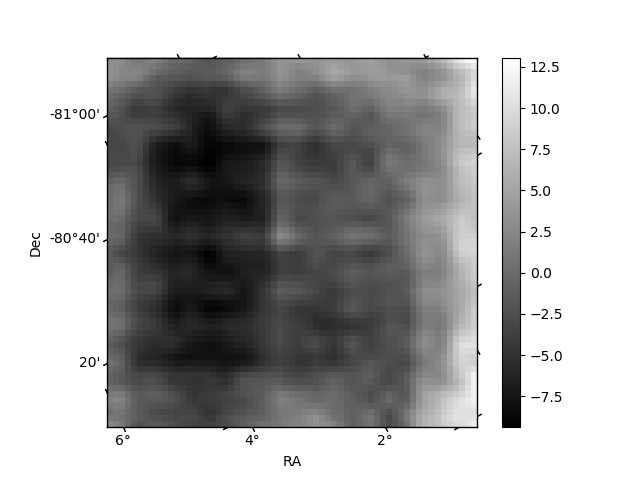
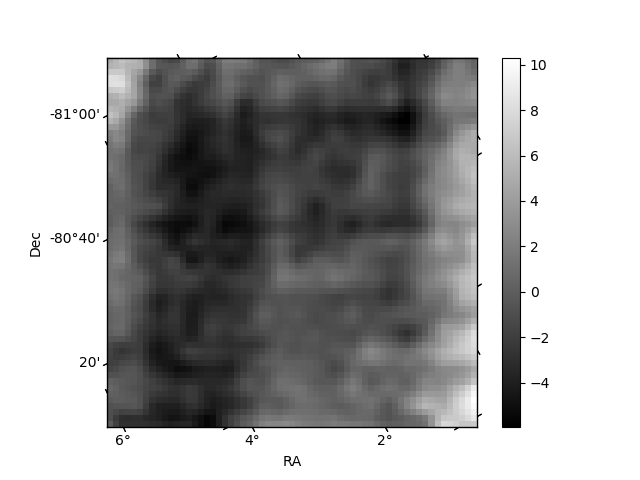
Histogram calculated using DETX and DETY for each event in the final _common_clean file
| Quadrant A | 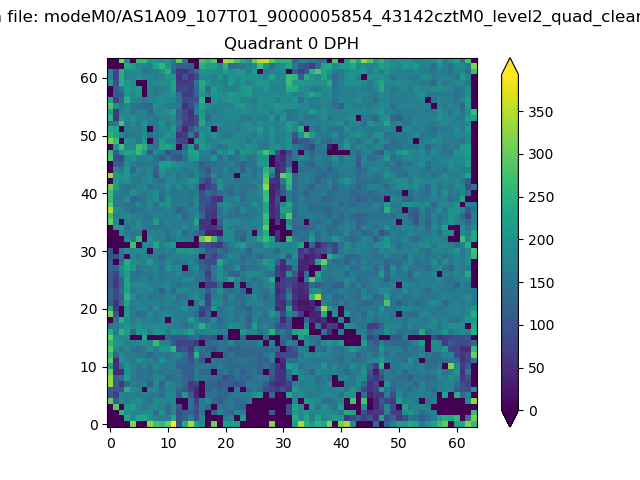 |
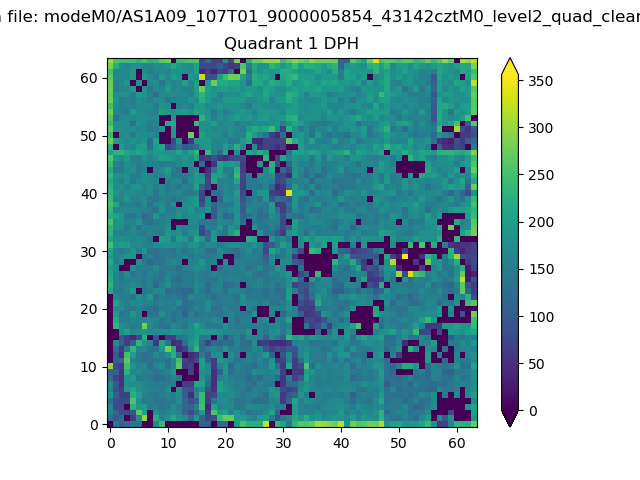 |
Quadrant B |
|---|---|---|---|
| Quadrant D | 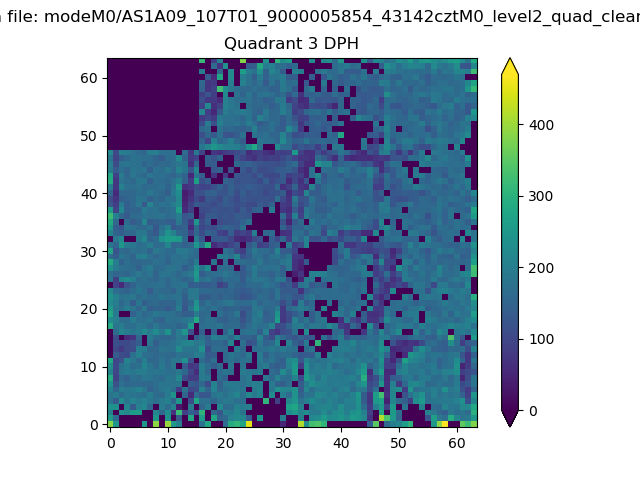 |
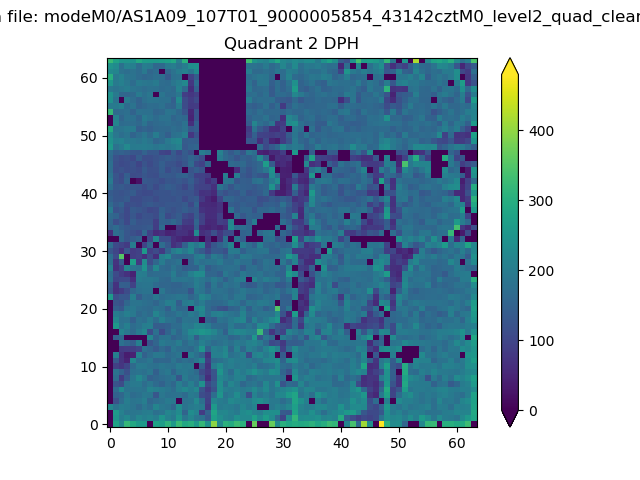 |
Quadrant C |
| Plot type | Count rate plots | Images |
|---|---|---|
| Comparison with Poisson distribution Blue bars denote a histogram of data divided into 1 sec bins. Red curve is a Poisson curve with rate = median count rate of data. |
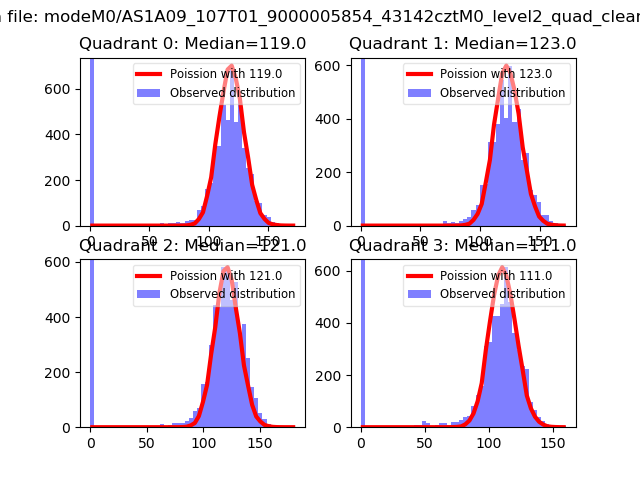 |
 |
| Quadrant-wise count rates Data is divided into 100 sec bins |
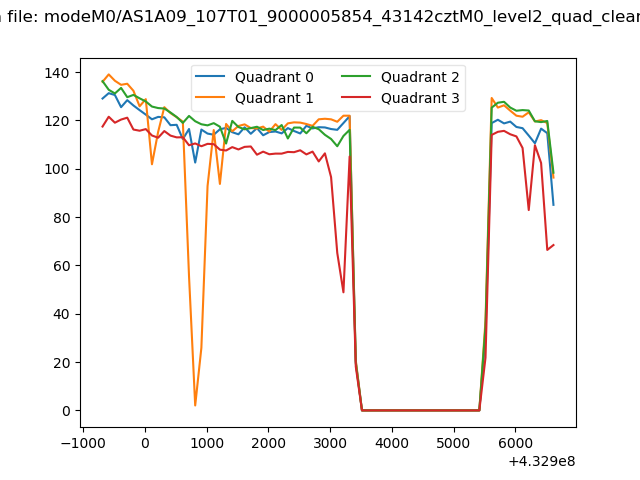 |
|
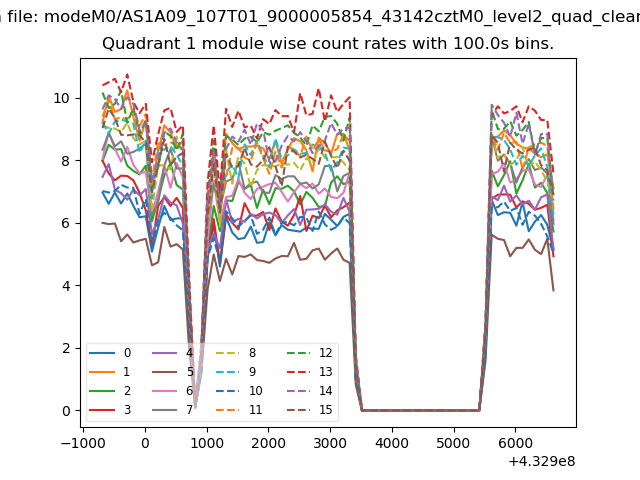
| Module-wise count rates for Quadrant A Data is divided into 100 sec bins |
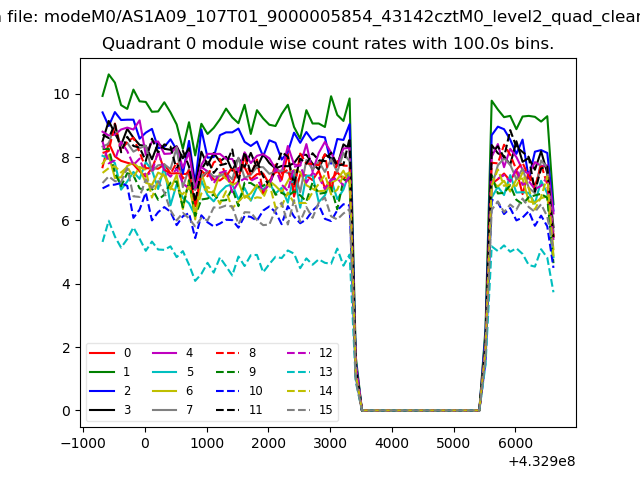 |
 |
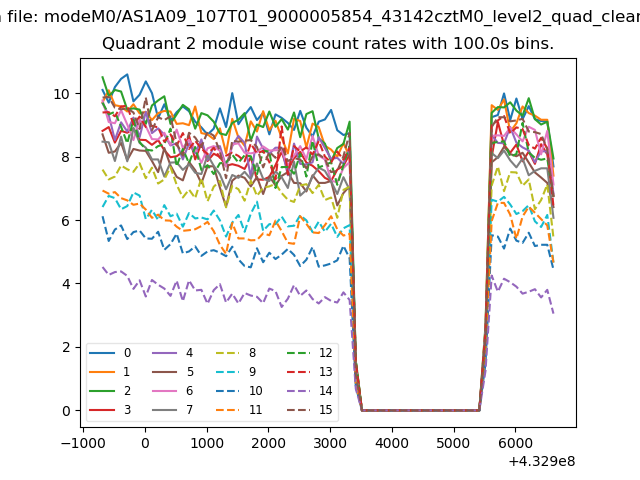
| Module-wise count rates for Quadrant B Data is divided into 100 sec bins |
 |
 |
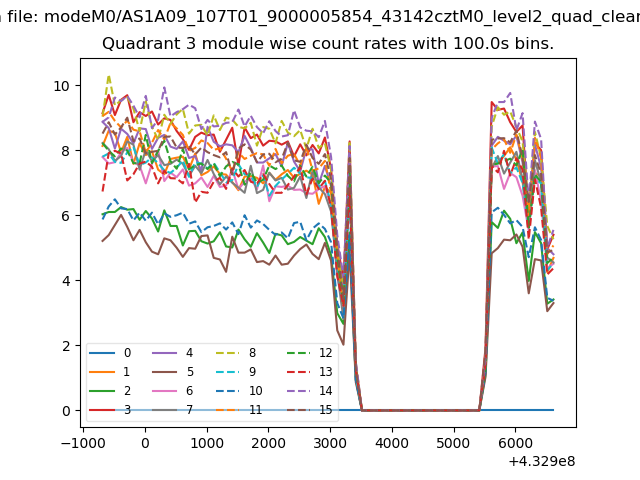
| Module-wise count rates for Quadrant C Data is divided into 100 sec bins |
 |
 |
| Module-wise count rates for Quadrant D Data is divided into 100 sec bins |
 |
 |
| Parameter | Plot |
|---|---|
| CZT HV Monitor | 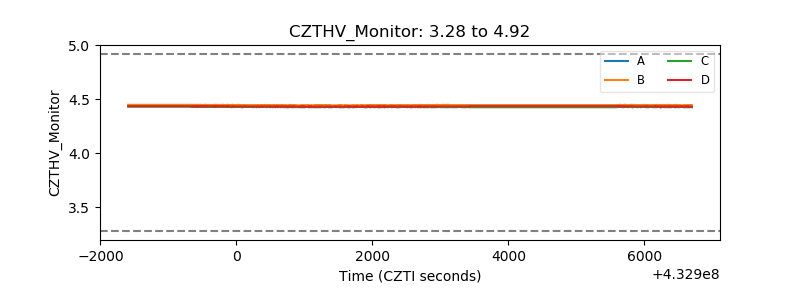 |
| D_VDD | 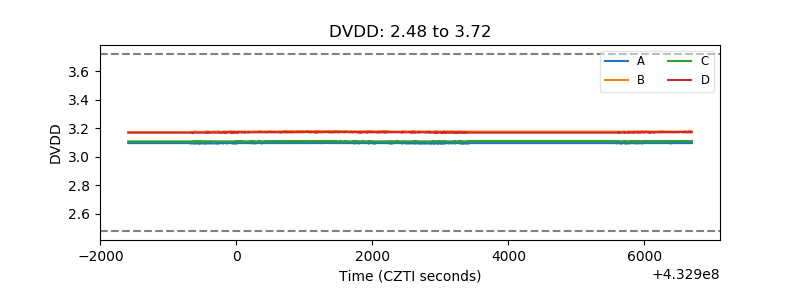 |
| Temperature 1 | 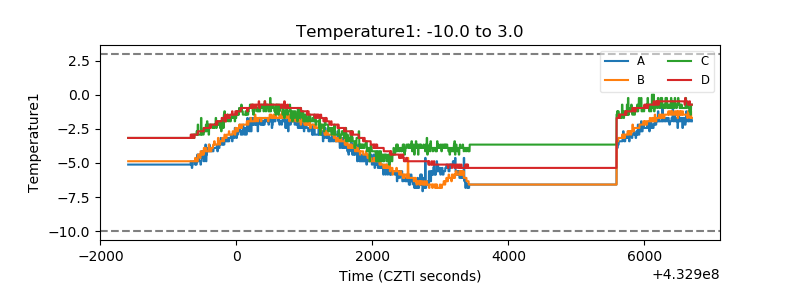 |
| Veto HV Monitor | 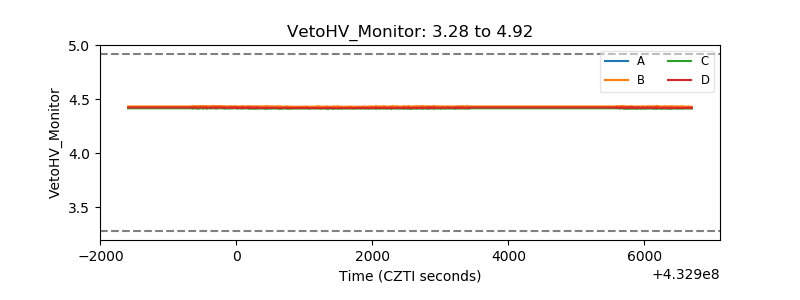 |
| Veto LLD | 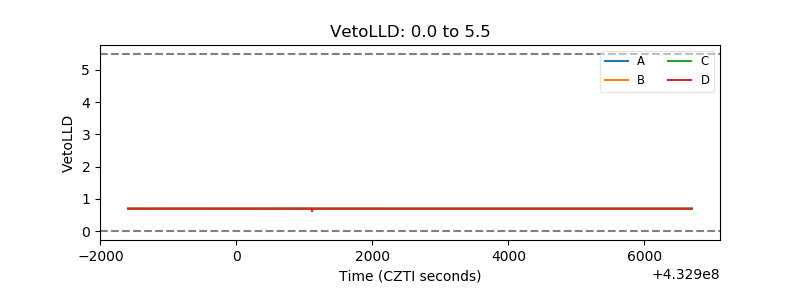 |
| Alpha Counter | 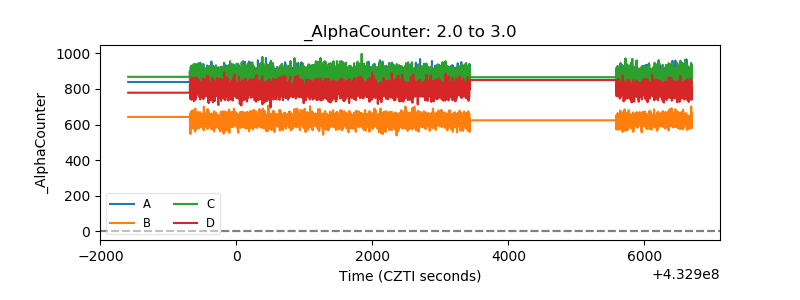 |
| _CPM_Rate | 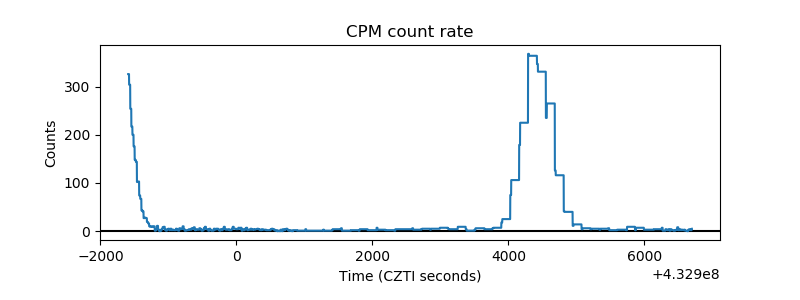 |
| CZT Counter |  |
| +2.5 Volts monitor |  |
| +5 Volts monitor | 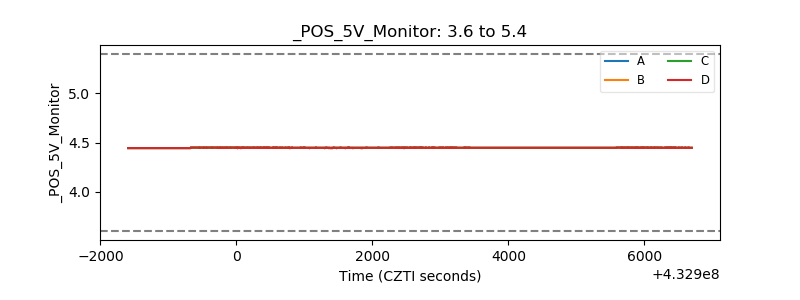 |
| _ROLL_ROT |  |
| _Roll_DEC | 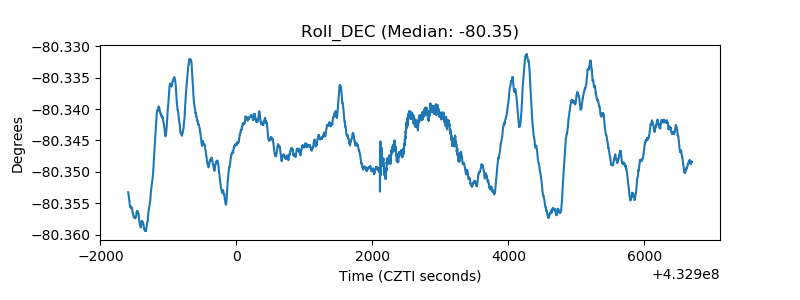 |
| _Roll_RA | 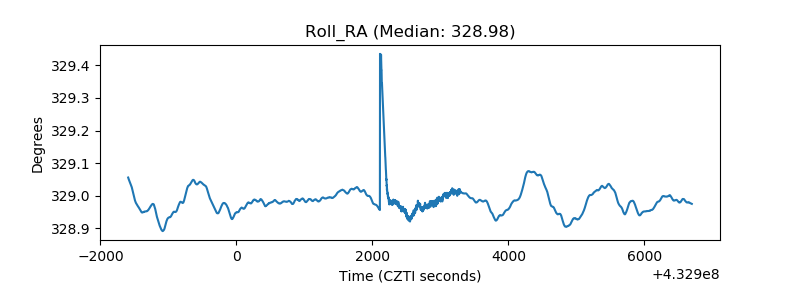 |
| Veto Counter | 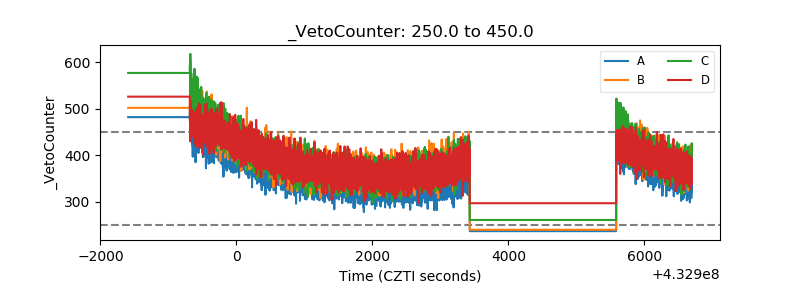 |