| Param | Original file | Final file |
|---|---|---|
| Filename | modeM0/AS1A09_107T01_9000005854_43143cztM0_level2.fits | modeM0/AS1A09_107T01_9000005854_43143cztM0_level2_quad_clean.evt |
| Size (bytes) | 344,975,040 | 88,614,720 |
| Size | 329.0 MB | 84.5 MB |
| Events in quadrant A | 3,421,286 | 580,671 |
| Events in quadrant B | 2,314,331 | 606,732 |
| Events in quadrant C | 2,428,202 | 600,733 |
| Events in quadrant D | 4,198,995 | 529,363 |
| Mode M0 | |||
|---|---|---|---|
| Quadrant | BADHDUFLAG | Total packets | Discarded packets |
| A | 0 | 13451 | 1 |
| B | 0 | 10581 | 2 |
| C | 0 | 10628 | 2 |
| D | 0 | 16177 | 3 |
| Mode M9 | |||
|---|---|---|---|
| Quadrant | BADHDUFLAG | Total packets | Discarded packets |
| A | 0 | 21 | 0 |
| B | 0 | 21 | 0 |
| C | 0 | 21 | 0 |
| D | 0 | 21 | 0 |
| Mode SS | |||
|---|---|---|---|
| Quadrant | BADHDUFLAG | Total packets | Discarded packets |
| A | 0 | 104 | 0 |
| B | 0 | 106 | 0 |
| C | 0 | 106 | 0 |
| D | 0 | 106 | 0 |
| Quadrant | Total seconds | Saturated seconds | Saturation percentage |
|---|---|---|---|
| A | 5226 | 123 | 2.353617% |
| B | 5227 | 5 | 0.095657% |
| C | 5227 | 3 | 0.057394% |
| D | 5226 | 325 | 6.218905% |
Noise dominated data is calculated using 1-second bins in cleaned event files. If a bin has >2000 counts, and if more than 50% of those come from <1% of pixels, then it is considered to be noise-dominated and hence unusable.
| Quadrant | # 1 sec bins | Bins with >0 counts | Bins with >2000 counts | High rate bins dominated by noise | Noise dominated (total time) | Noise dominated (detector-on time) | Marked lightcurve |
|---|---|---|---|---|---|---|---|
| A | 7289 | 5227 | 85 | 85 | 1.17% | 1.63% | 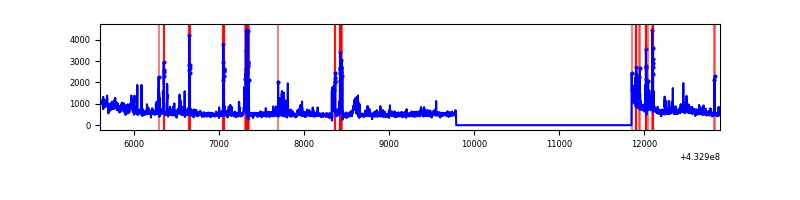 |
| B | 7290 | 5228 | 0 | 0 | 0.00% | 0.00% | 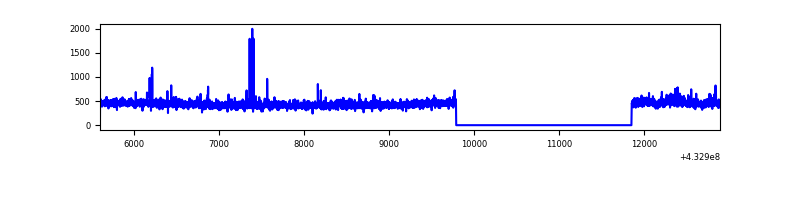 |
| C | 7290 | 5228 | 2 | 2 | 0.03% | 0.04% | 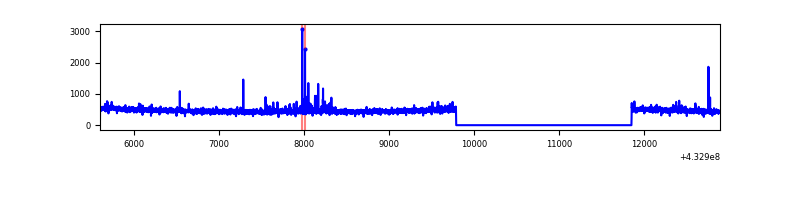 |
| D | 7289 | 5227 | 299 | 299 | 4.10% | 5.72% | 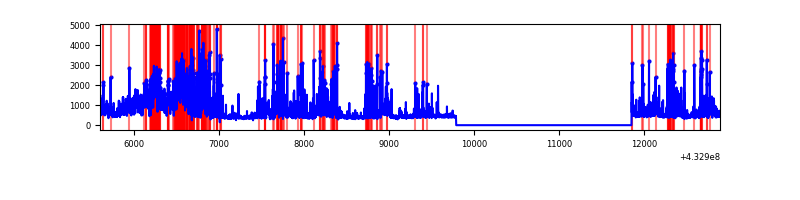 |
Top three noisy pixels from each quadrant. If the there are fewer than three noisy pixels in the level2.evt file, extra rows are filled as -1
| Pixel properties | Quadrant properties | ||||||
|---|---|---|---|---|---|---|---|
| Quadrant | DetID | PixID | Counts | Sigma | Mean | Median | Sigma |
| A | 10 | 83 | 585392 | 5151.95 | 553 | 542 | 113.5 |
| A | 15 | 237 | 390168 | 3432.22 | 553 | 542 | 113.5 |
| A | 12 | 189 | 232605 | 2044.25 | 553 | 542 | 113.5 |
| B | 0 | 186 | 42448 | 397.18 | 554 | 538 | 105.5 |
| B | 0 | 229 | 33129 | 308.86 | 554 | 538 | 105.5 |
| B | 0 | 230 | 24633 | 228.35 | 554 | 538 | 105.5 |
| C | 15 | 214 | 236397 | 1887.65 | 544 | 548 | 124.9 |
| C | 14 | 254 | 53800 | 426.21 | 544 | 548 | 124.9 |
| C | 12 | 249 | 7707 | 57.3 | 544 | 548 | 124.9 |
| D | 1 | 52 | 1877614 | 14274.71 | 535 | 520 | 131.5 |
| D | 10 | 118 | 71001 | 535.99 | 535 | 520 | 131.5 |
| D | 12 | 233 | 70761 | 534.16 | 535 | 520 | 131.5 |
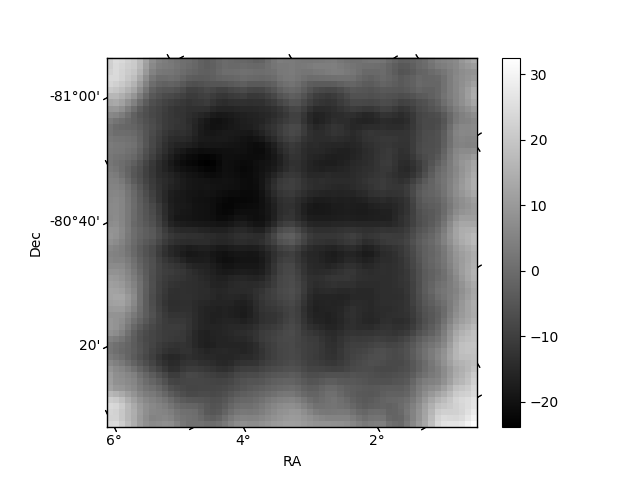
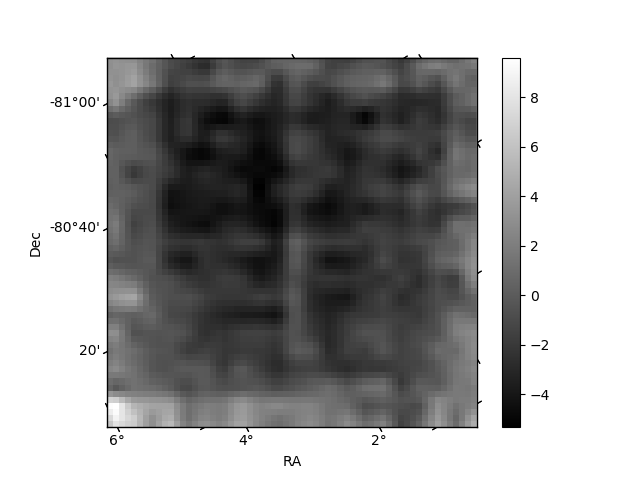
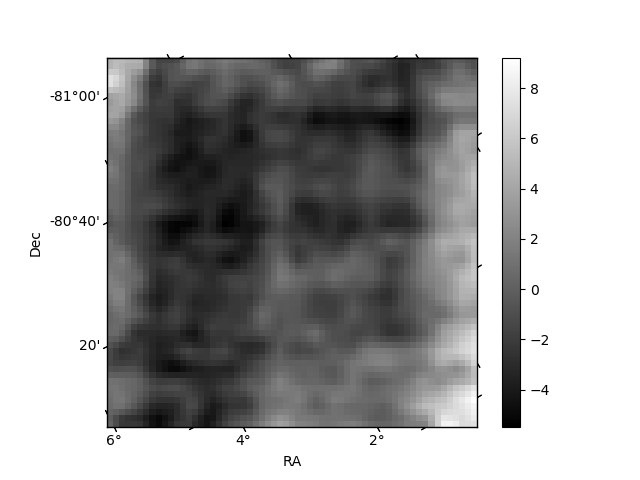
Histogram calculated using DETX and DETY for each event in the final _common_clean file
| Quadrant A | 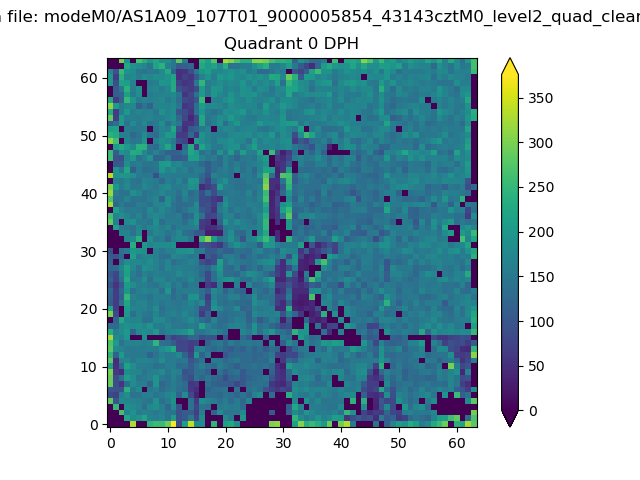 |
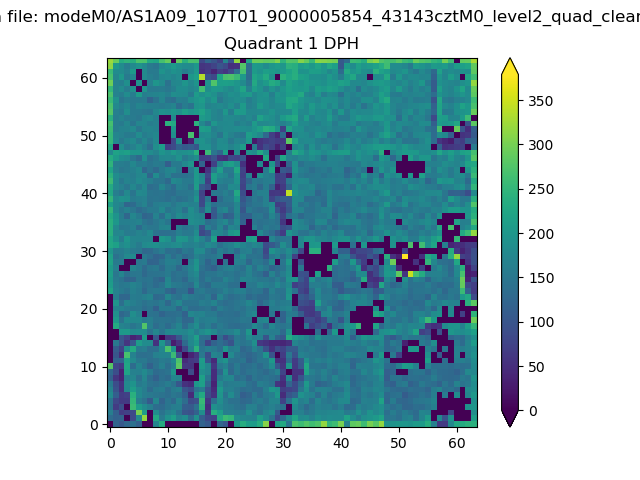 |
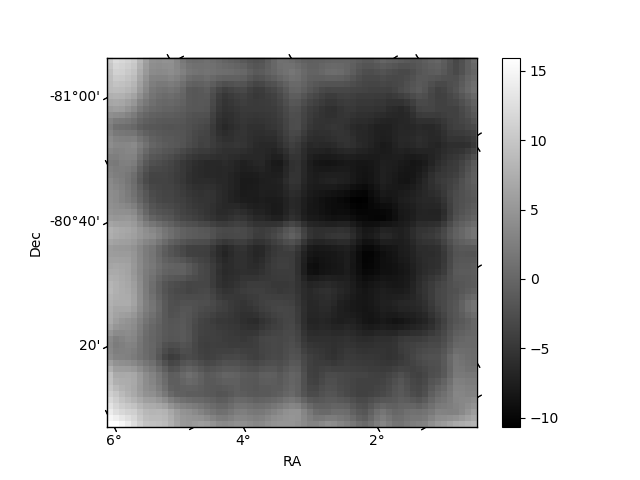
Quadrant B |
|---|---|---|---|
| Quadrant D | 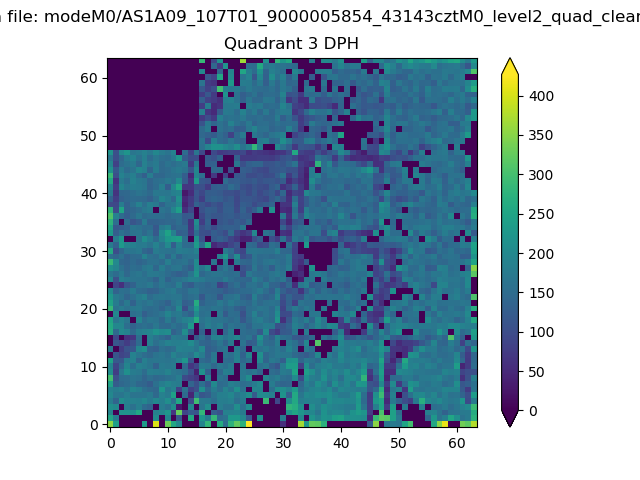 |
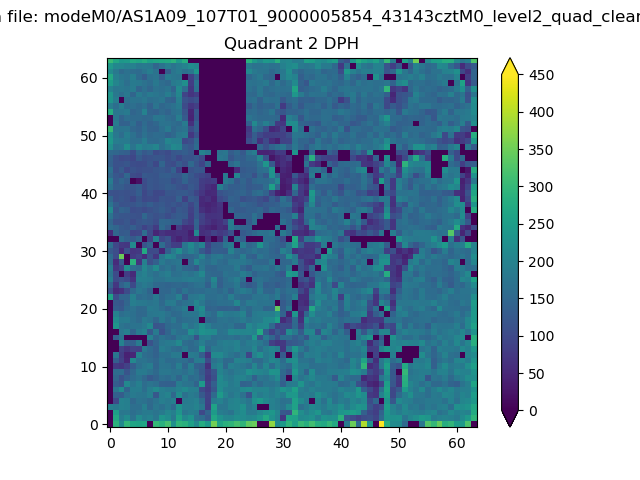 |
Quadrant C |
| Plot type | Count rate plots | Images |
|---|---|---|
| Comparison with Poisson distribution Blue bars denote a histogram of data divided into 1 sec bins. Red curve is a Poisson curve with rate = median count rate of data. |
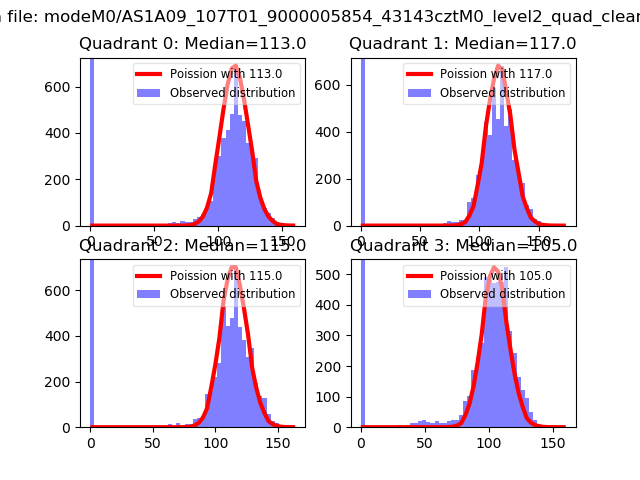 |
 |
| Quadrant-wise count rates Data is divided into 100 sec bins |
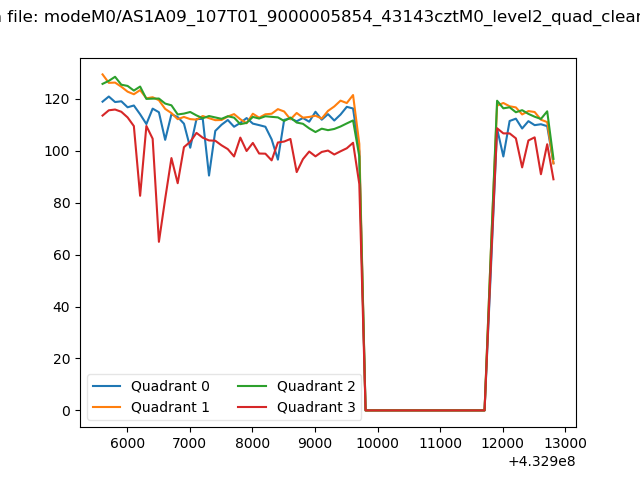 |
|
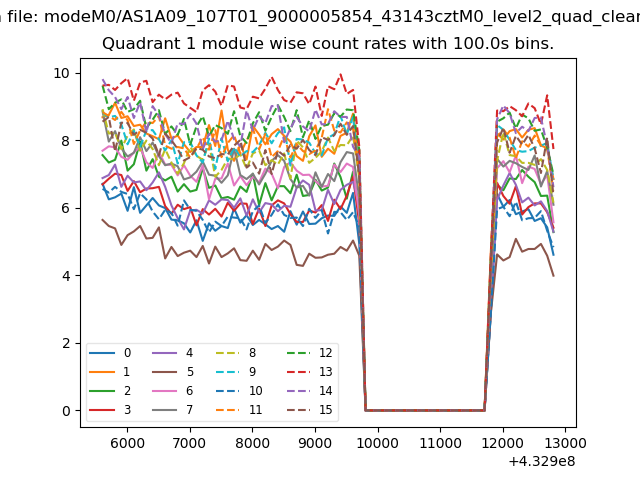
| Module-wise count rates for Quadrant A Data is divided into 100 sec bins |
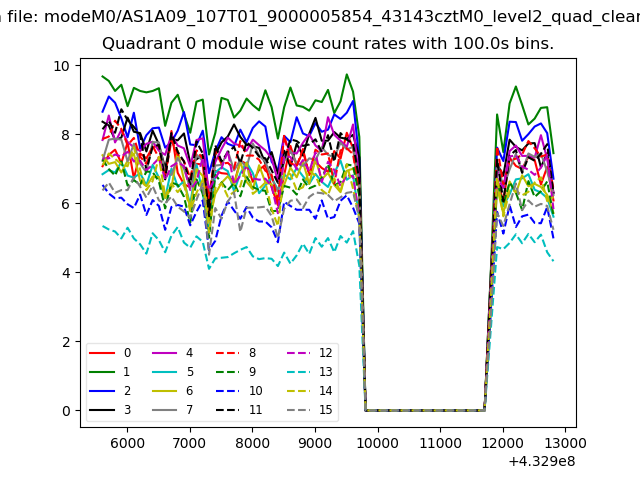 |
 |
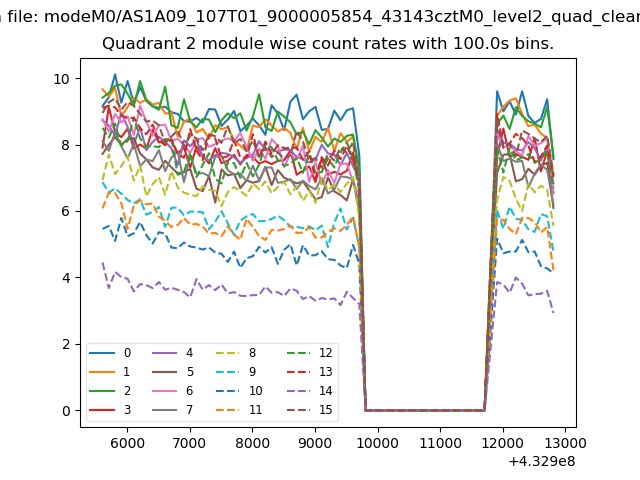
| Module-wise count rates for Quadrant B Data is divided into 100 sec bins |
 |
 |
| Module-wise count rates for Quadrant C Data is divided into 100 sec bins |
 |
 |
| Module-wise count rates for Quadrant D Data is divided into 100 sec bins |
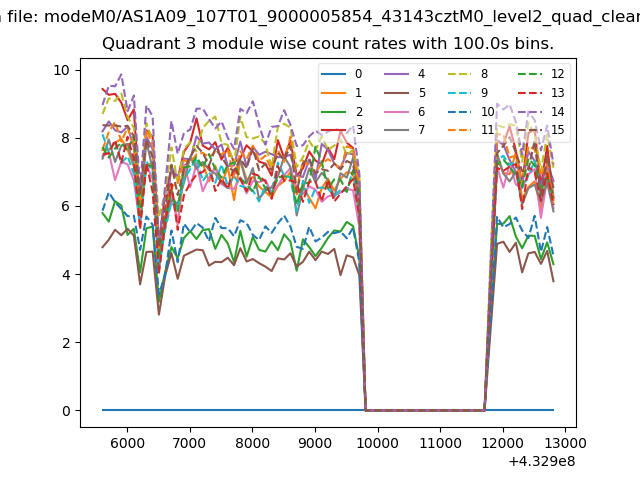 |
 |
| Parameter | Plot |
|---|---|
| CZT HV Monitor | 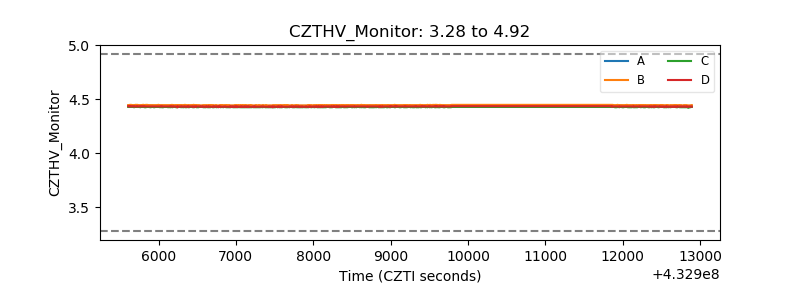 |
| D_VDD | 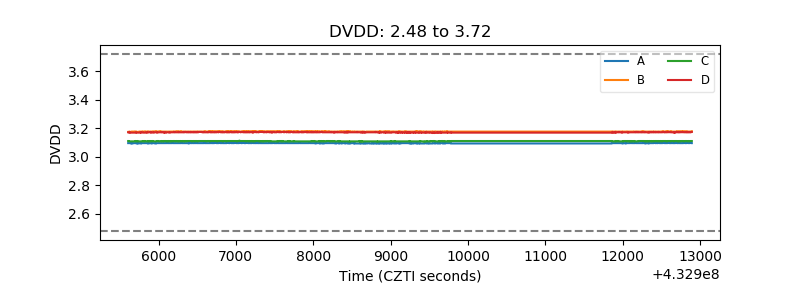 |
| Temperature 1 | 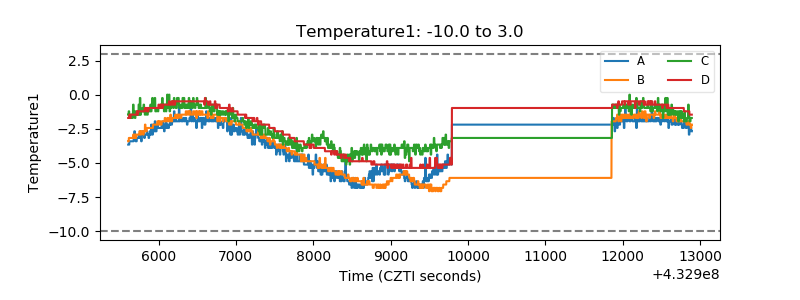 |
| Veto HV Monitor | 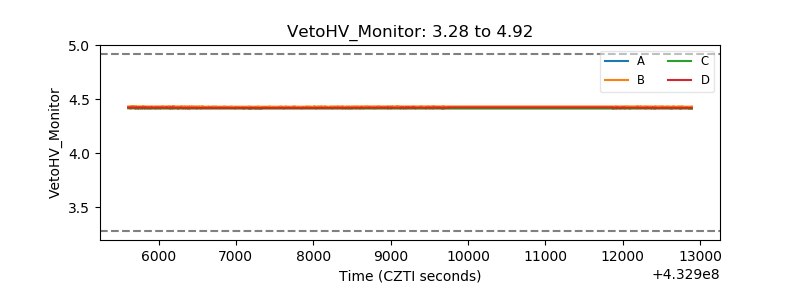 |
| Veto LLD | 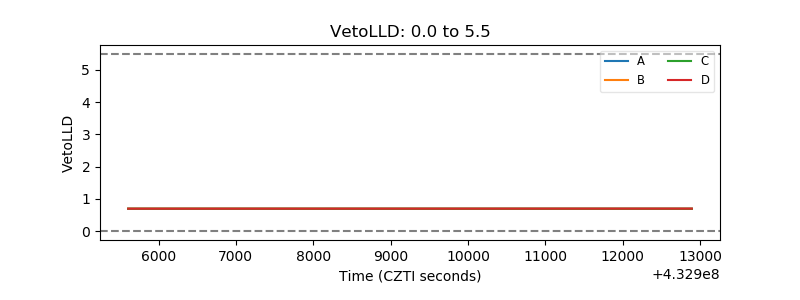 |
| Alpha Counter | 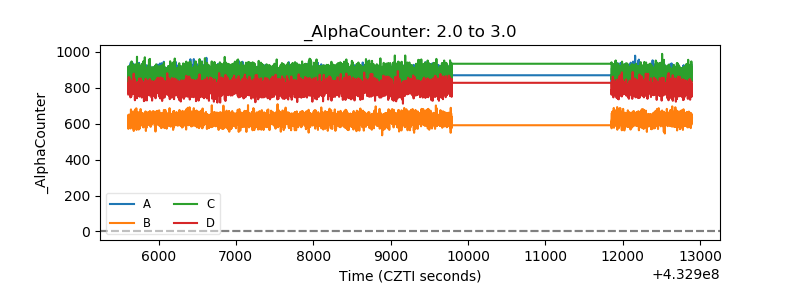 |
| _CPM_Rate | 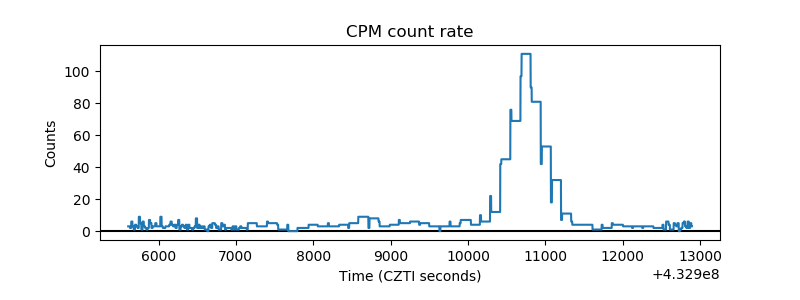 |
| CZT Counter | 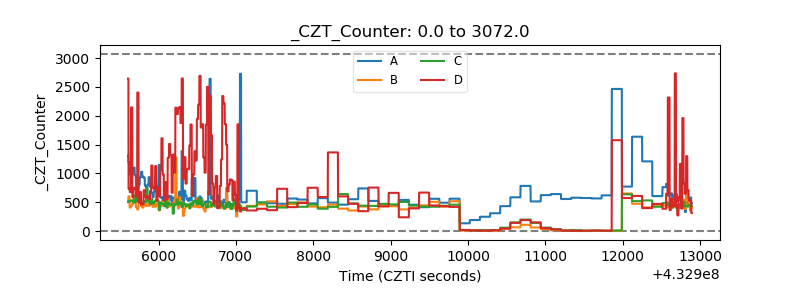 |
| +2.5 Volts monitor |  |
| +5 Volts monitor | 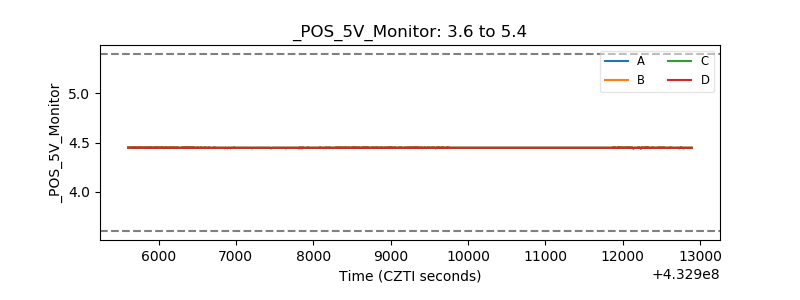 |
| _ROLL_ROT | 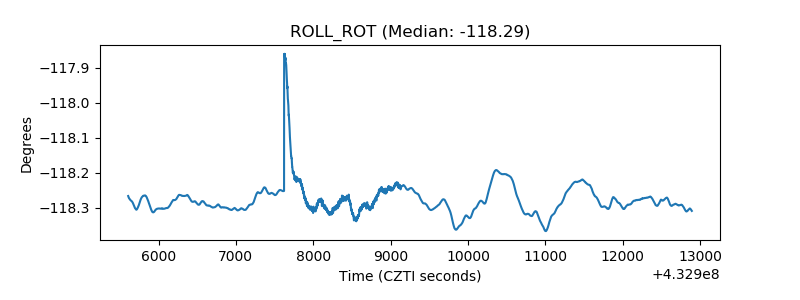 |
| _Roll_DEC | 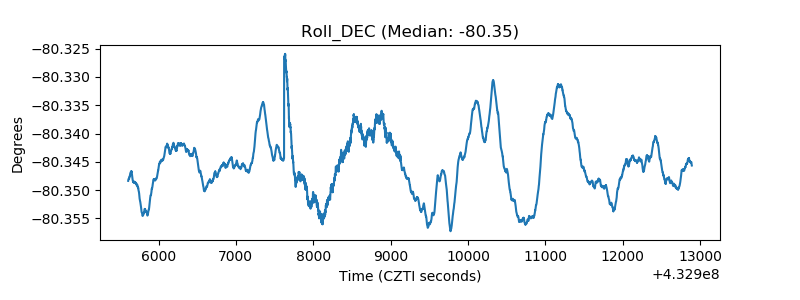 |
| _Roll_RA | 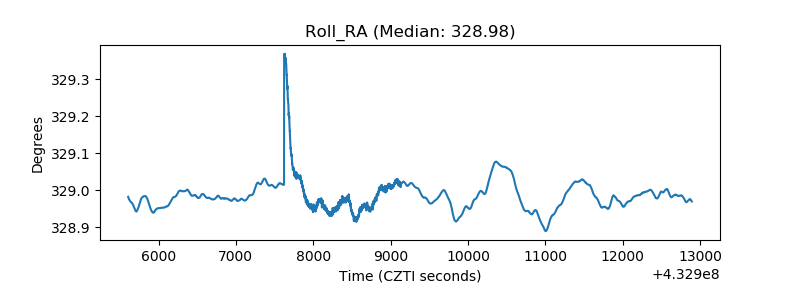 |
| Veto Counter | 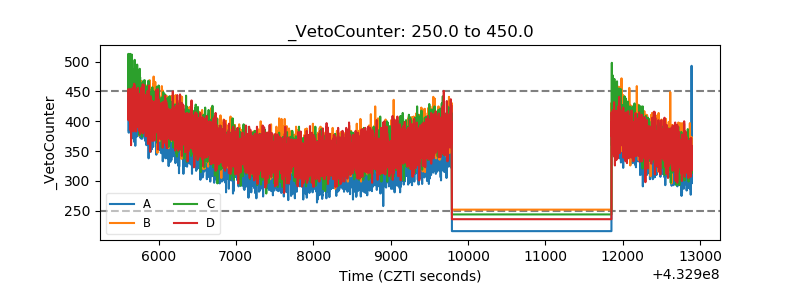 |