| Param | Original file | Final file |
|---|---|---|
| Filename | modeM0/AS1A09_107T01_9000005854_43144cztM0_level2.fits | modeM0/AS1A09_107T01_9000005854_43144cztM0_level2_quad_clean.evt |
| Size (bytes) | 357,528,960 | 90,587,520 |
| Size | 341.0 MB | 86.4 MB |
| Events in quadrant A | 3,333,456 | 598,835 |
| Events in quadrant B | 2,542,747 | 619,673 |
| Events in quadrant C | 2,543,589 | 607,532 |
| Events in quadrant D | 4,384,377 | 529,871 |
| Mode M0 | |||
|---|---|---|---|
| Quadrant | BADHDUFLAG | Total packets | Discarded packets |
| A | 0 | 13373 | 2 |
| B | 0 | 11438 | 2 |
| C | 0 | 11330 | 2 |
| D | 0 | 16890 | 2 |
| Mode M9 | |||
|---|---|---|---|
| Quadrant | BADHDUFLAG | Total packets | Discarded packets |
| A | 0 | 17 | 0 |
| B | 0 | 17 | 0 |
| C | 0 | 17 | 0 |
| D | 0 | 17 | 0 |
| Mode SS | |||
|---|---|---|---|
| Quadrant | BADHDUFLAG | Total packets | Discarded packets |
| A | 0 | 114 | 0 |
| B | 0 | 114 | 0 |
| C | 0 | 114 | 0 |
| D | 0 | 114 | 0 |
| Quadrant | Total seconds | Saturated seconds | Saturation percentage |
|---|---|---|---|
| A | 5525 | 78 | 1.411765% |
| B | 5526 | 12 | 0.217155% |
| C | 5526 | 13 | 0.235252% |
| D | 5526 | 436 | 7.889975% |
Noise dominated data is calculated using 1-second bins in cleaned event files. If a bin has >2000 counts, and if more than 50% of those come from <1% of pixels, then it is considered to be noise-dominated and hence unusable.
| Quadrant | # 1 sec bins | Bins with >0 counts | Bins with >2000 counts | High rate bins dominated by noise | Noise dominated (total time) | Noise dominated (detector-on time) | Marked lightcurve |
|---|---|---|---|---|---|---|---|
| A | 7288 | 5526 | 47 | 47 | 0.64% | 0.85% | 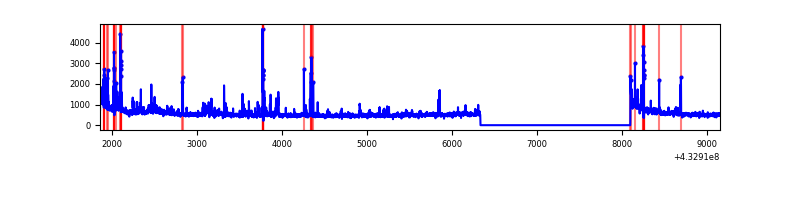 |
| B | 7289 | 5527 | 8 | 8 | 0.11% | 0.14% | 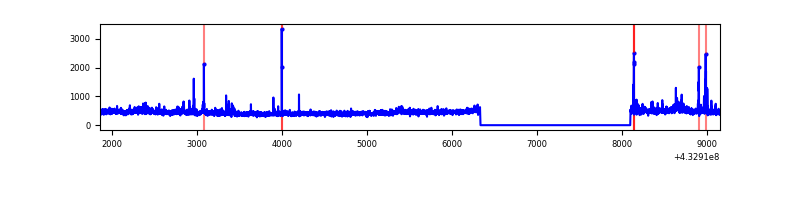 |
| C | 7289 | 5527 | 5 | 5 | 0.07% | 0.09% | 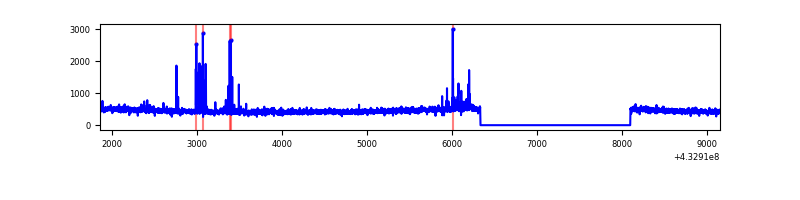 |
| D | 7289 | 5527 | 375 | 375 | 5.14% | 6.78% | 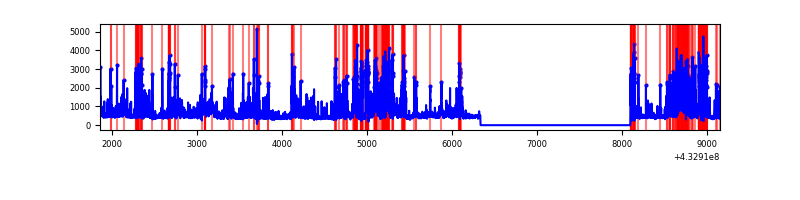 |
Top three noisy pixels from each quadrant. If the there are fewer than three noisy pixels in the level2.evt file, extra rows are filled as -1
| Pixel properties | Quadrant properties | ||||||
|---|---|---|---|---|---|---|---|
| Quadrant | DetID | PixID | Counts | Sigma | Mean | Median | Sigma |
| A | 10 | 83 | 619548 | 5222.12 | 572 | 560 | 118.5 |
| A | 15 | 237 | 222935 | 1876.08 | 572 | 560 | 118.5 |
| A | 12 | 189 | 138111 | 1160.46 | 572 | 560 | 118.5 |
| B | 0 | 186 | 100859 | 916.93 | 574 | 557 | 109.4 |
| B | 0 | 189 | 58072 | 525.78 | 574 | 557 | 109.4 |
| B | 0 | 229 | 47650 | 430.51 | 574 | 557 | 109.4 |
| C | 15 | 214 | 246611 | 1894.26 | 563 | 566 | 129.9 |
| C | 14 | 254 | 99170 | 759.13 | 563 | 566 | 129.9 |
| C | 13 | 61 | 3962 | 26.15 | 563 | 566 | 129.9 |
| D | 1 | 52 | 1705711 | 12941.29 | 543 | 528 | 131.8 |
| D | 12 | 0 | 379770 | 2878.21 | 543 | 528 | 131.8 |
| D | 12 | 233 | 71225 | 536.55 | 543 | 528 | 131.8 |
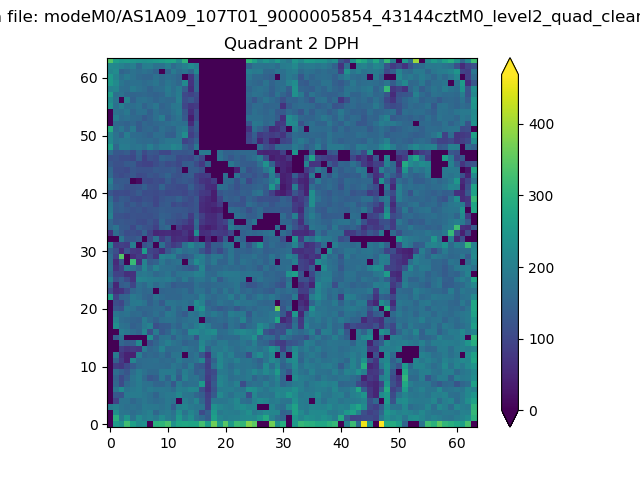
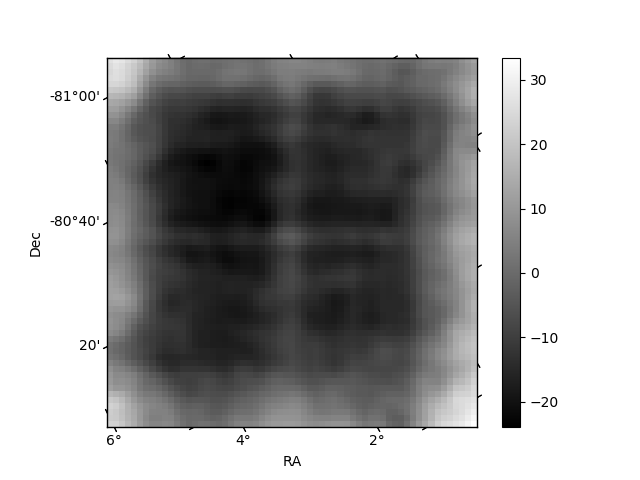
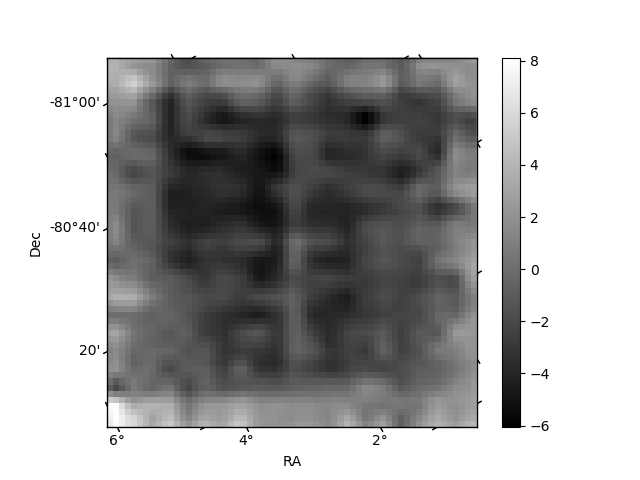
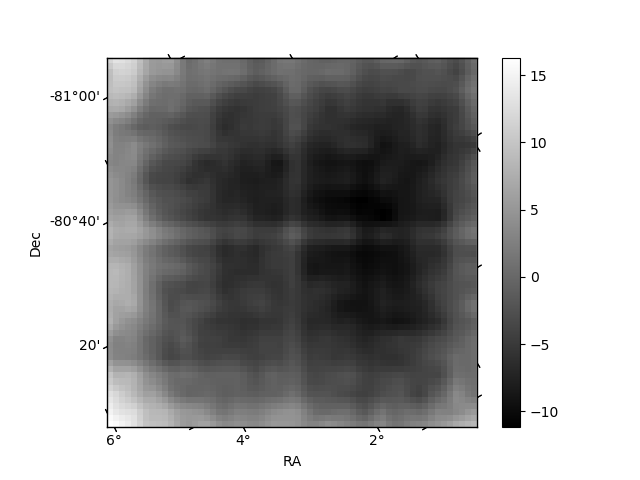
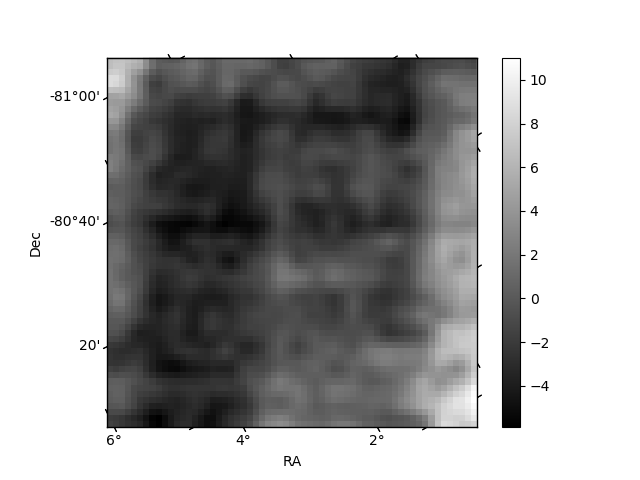
Histogram calculated using DETX and DETY for each event in the final _common_clean file
| Quadrant A | 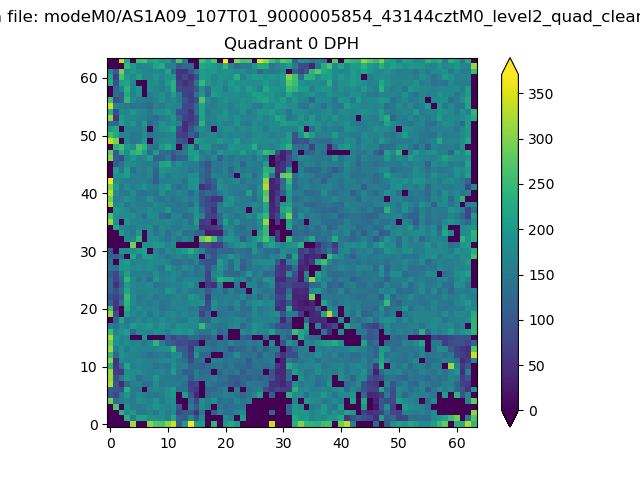 |
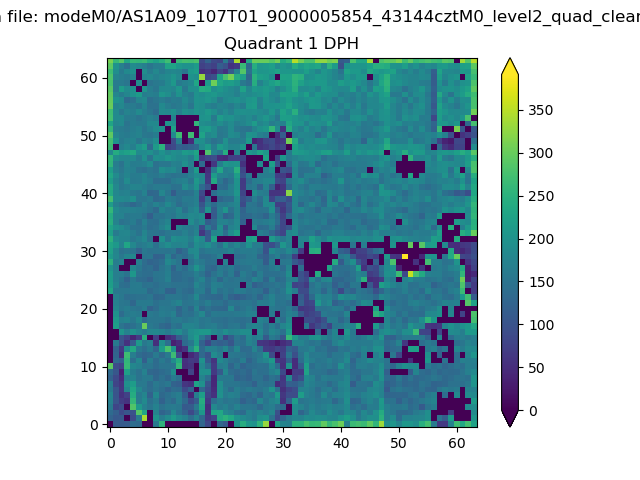 |
Quadrant B |
|---|---|---|---|
| Quadrant D | 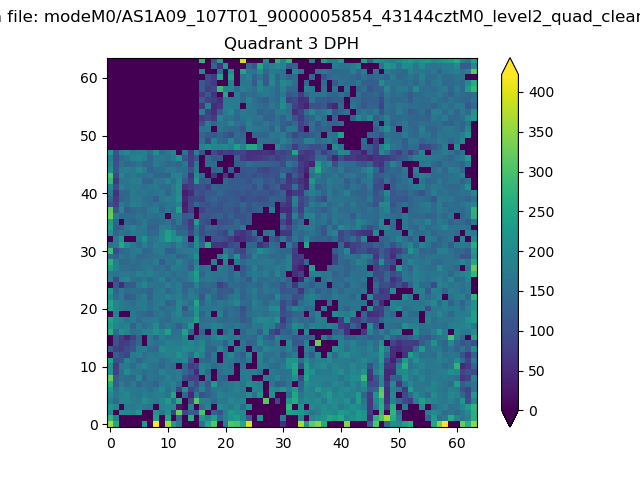 |
 |
Quadrant C |
| Plot type | Count rate plots | Images |
|---|---|---|
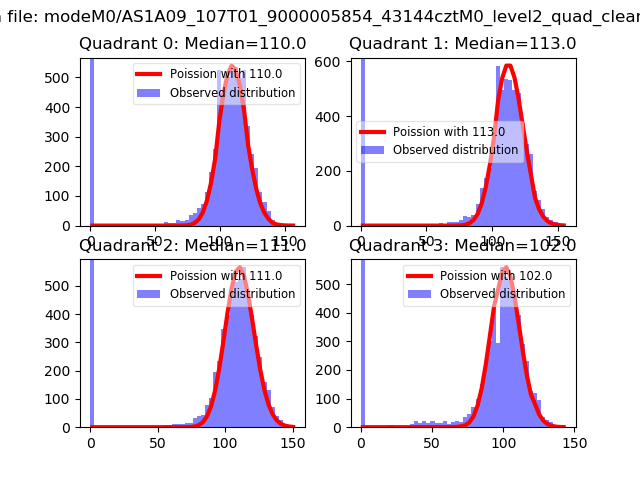
| Comparison with Poisson distribution Blue bars denote a histogram of data divided into 1 sec bins. Red curve is a Poisson curve with rate = median count rate of data. |
 |
 |
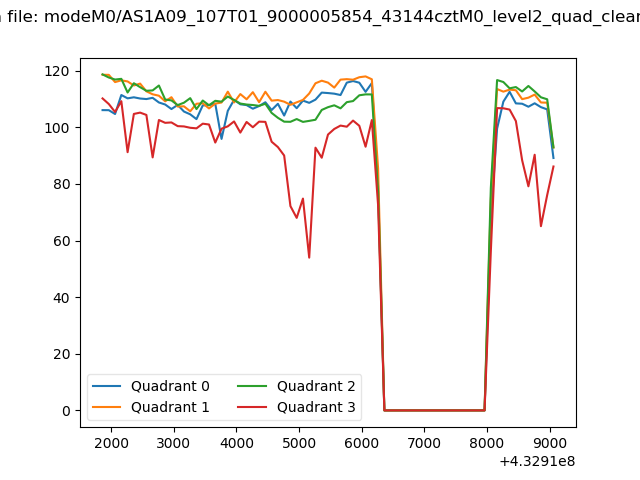
| Quadrant-wise count rates Data is divided into 100 sec bins |
 |
|
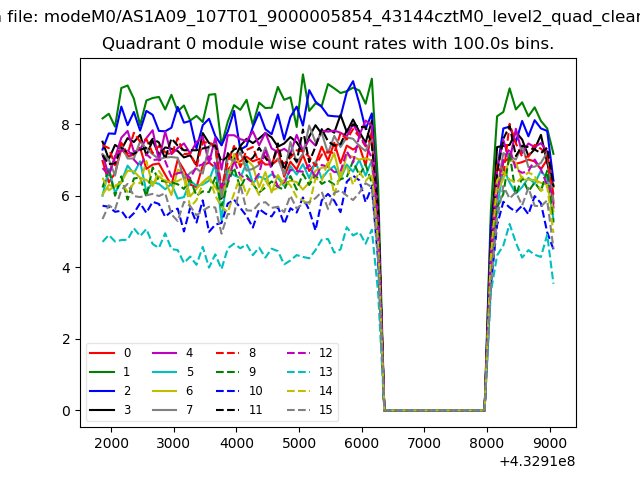
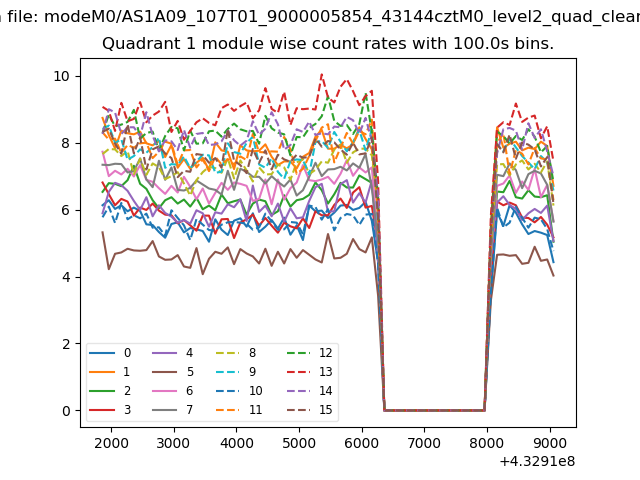
| Module-wise count rates for Quadrant A Data is divided into 100 sec bins |
 |
 |
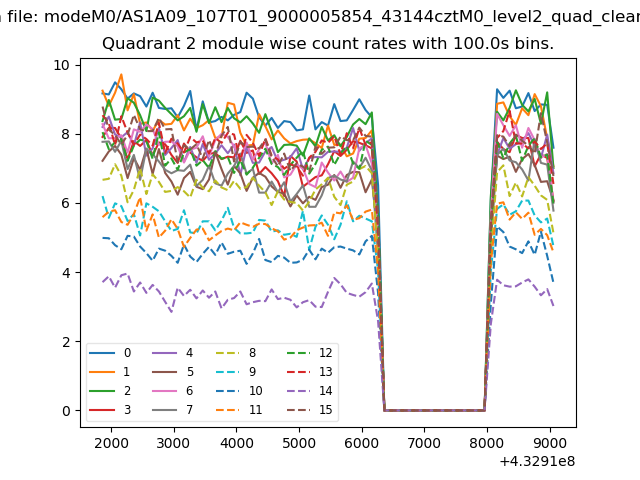
| Module-wise count rates for Quadrant B Data is divided into 100 sec bins |
 |
 |
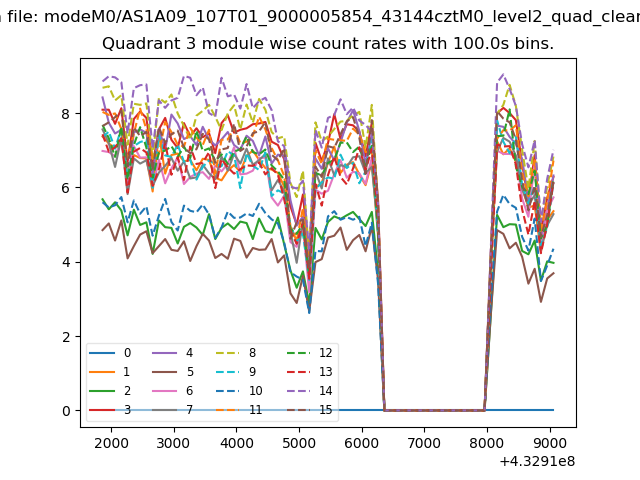
| Module-wise count rates for Quadrant C Data is divided into 100 sec bins |
 |
 |
| Module-wise count rates for Quadrant D Data is divided into 100 sec bins |
 |
 |
| Parameter | Plot |
|---|---|
| CZT HV Monitor | 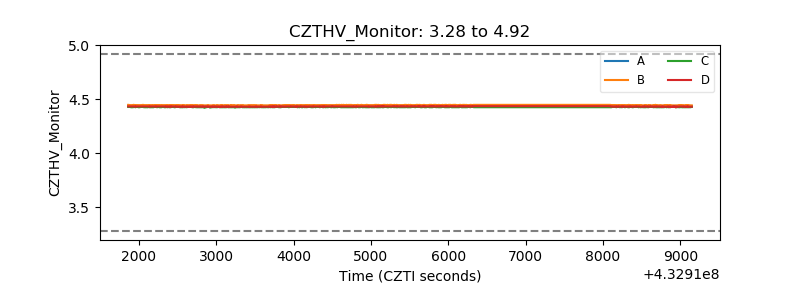 |
| D_VDD | 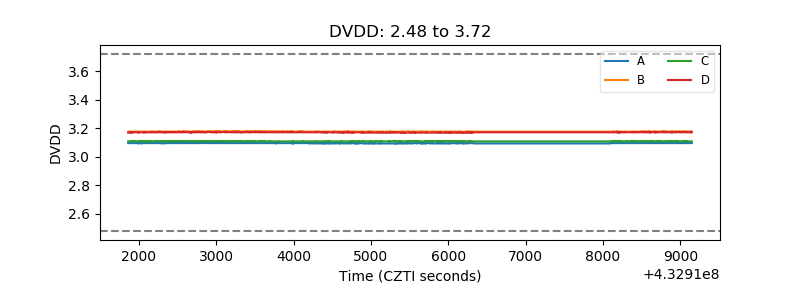 |
| Temperature 1 | 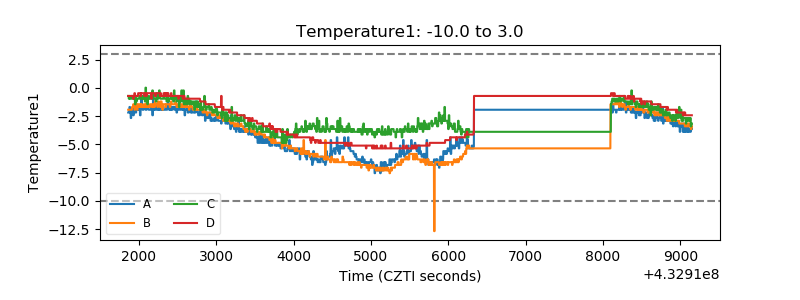 |
| Veto HV Monitor | 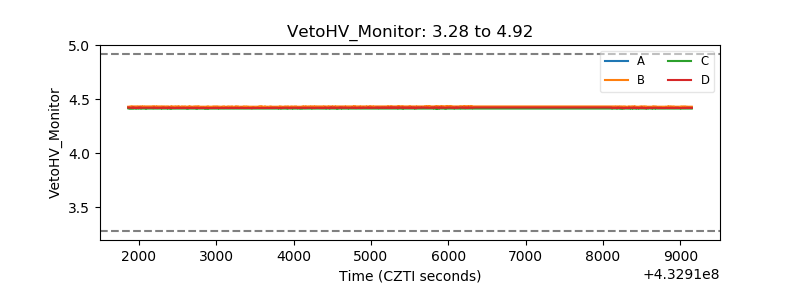 |
| Veto LLD | 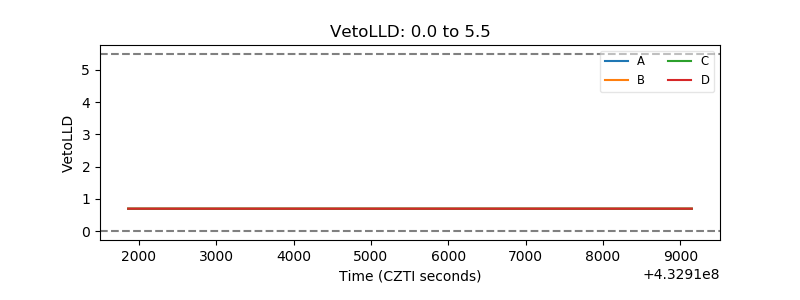 |
| Alpha Counter | 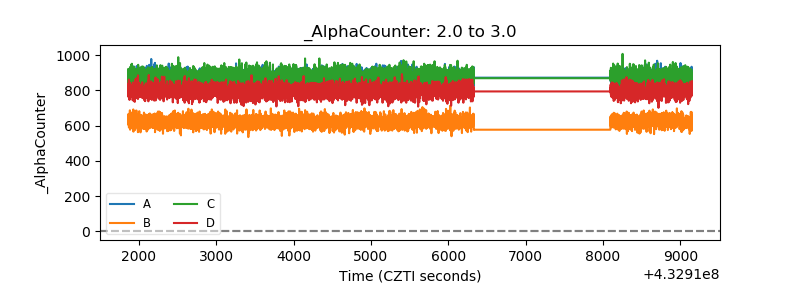 |
| _CPM_Rate | 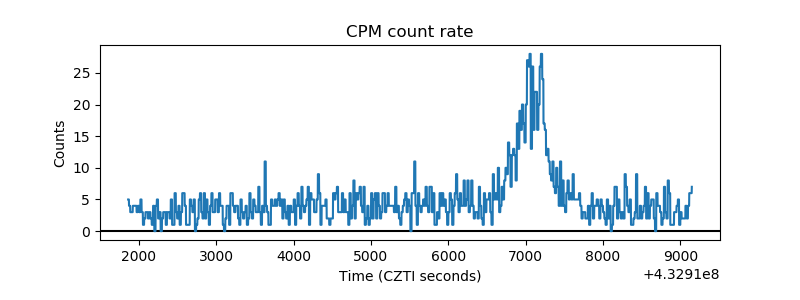 |
| CZT Counter | 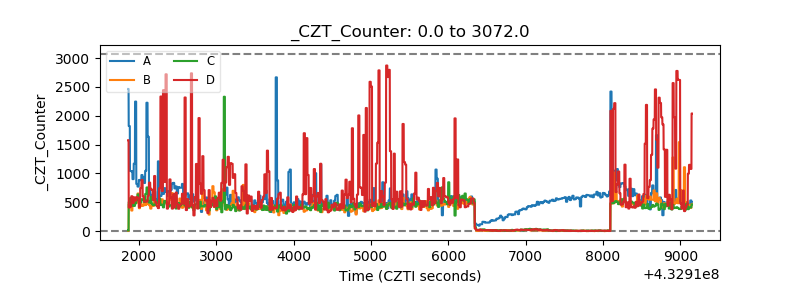 |
| +2.5 Volts monitor |  |
| +5 Volts monitor | 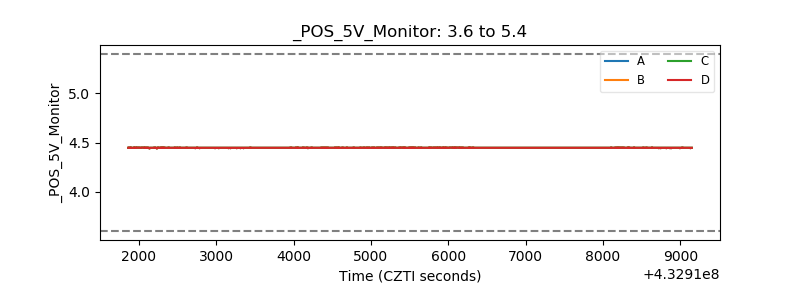 |
| _ROLL_ROT | 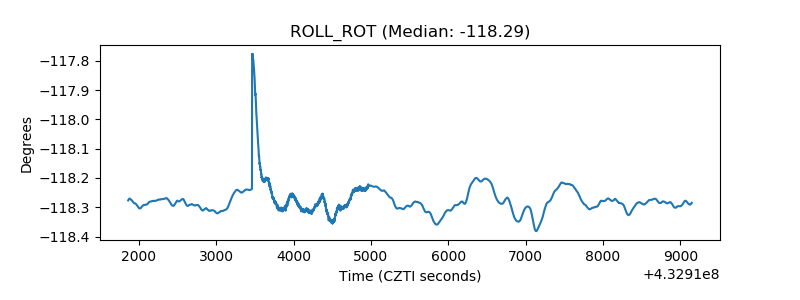 |
| _Roll_DEC |  |
| _Roll_RA | 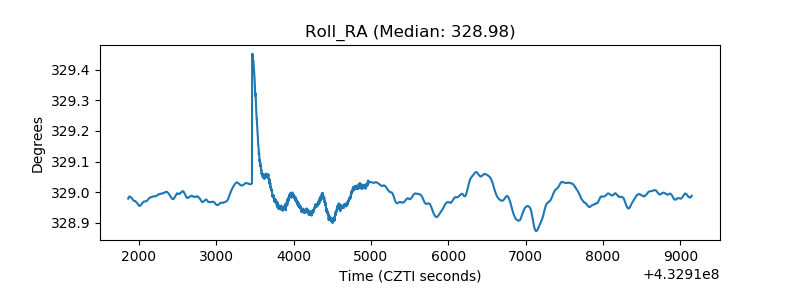 |
| Veto Counter | 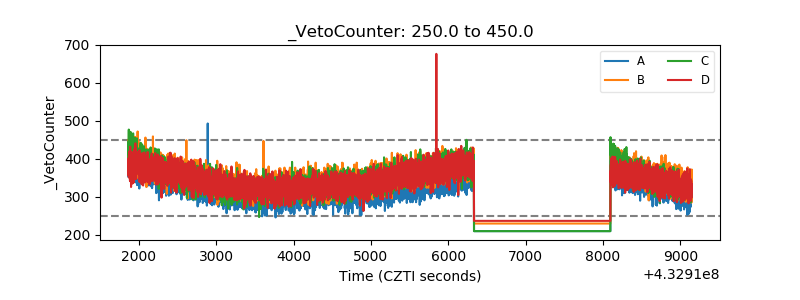 |