| Param | Original file | Final file |
|---|---|---|
| Filename | modeM0/AS1A09_107T01_9000005854_43149cztM0_level2.fits | modeM0/AS1A09_107T01_9000005854_43149cztM0_level2_quad_clean.evt |
| Size (bytes) | 346,199,040 | 94,271,040 |
| Size | 330.2 MB | 89.9 MB |
| Events in quadrant A | 3,677,741 | 609,636 |
| Events in quadrant B | 2,651,158 | 641,863 |
| Events in quadrant C | 2,634,406 | 624,792 |
| Events in quadrant D | 3,396,832 | 569,526 |
| Mode M0 | |||
|---|---|---|---|
| Quadrant | BADHDUFLAG | Total packets | Discarded packets |
| A | 0 | 14635 | 2 |
| B | 0 | 12121 | 2 |
| C | 0 | 11766 | 2 |
| D | 0 | 14338 | 2 |
| Mode M9 | |||
|---|---|---|---|
| Quadrant | BADHDUFLAG | Total packets | Discarded packets |
| A | 0 | 15 | 0 |
| B | 0 | 16 | 0 |
| C | 0 | 16 | 0 |
| D | 0 | 16 | 0 |
| Mode SS | |||
|---|---|---|---|
| Quadrant | BADHDUFLAG | Total packets | Discarded packets |
| A | 0 | 120 | 0 |
| B | 0 | 120 | 0 |
| C | 0 | 120 | 0 |
| D | 0 | 120 | 0 |
| Quadrant | Total seconds | Saturated seconds | Saturation percentage |
|---|---|---|---|
| A | 5842 | 178 | 3.046902% |
| B | 5842 | 29 | 0.496405% |
| C | 5842 | 2 | 0.034235% |
| D | 5842 | 111 | 1.900034% |
Noise dominated data is calculated using 1-second bins in cleaned event files. If a bin has >2000 counts, and if more than 50% of those come from <1% of pixels, then it is considered to be noise-dominated and hence unusable.
| Quadrant | # 1 sec bins | Bins with >0 counts | Bins with >2000 counts | High rate bins dominated by noise | Noise dominated (total time) | Noise dominated (detector-on time) | Marked lightcurve |
|---|---|---|---|---|---|---|---|
| A | 7154 | 5843 | 144 | 144 | 2.01% | 2.46% | 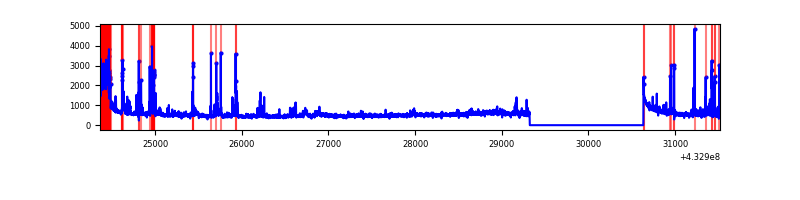 |
| B | 7154 | 5843 | 18 | 18 | 0.25% | 0.31% | 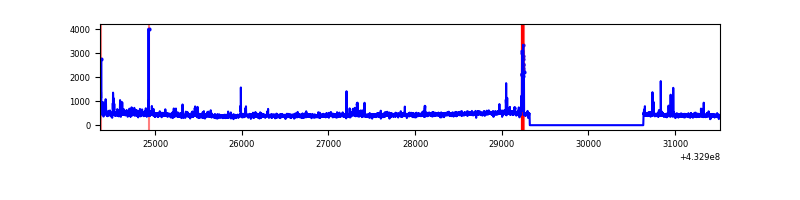 |
| C | 7154 | 5843 | 0 | 0 | 0.00% | 0.00% | 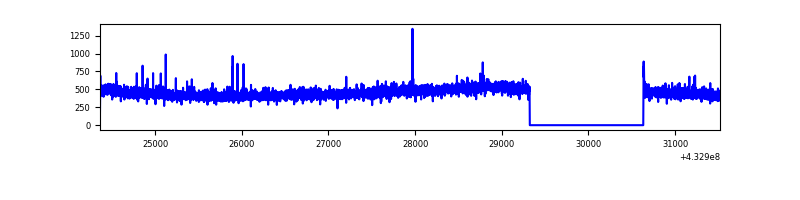 |
| D | 7154 | 5843 | 117 | 117 | 1.64% | 2.00% | 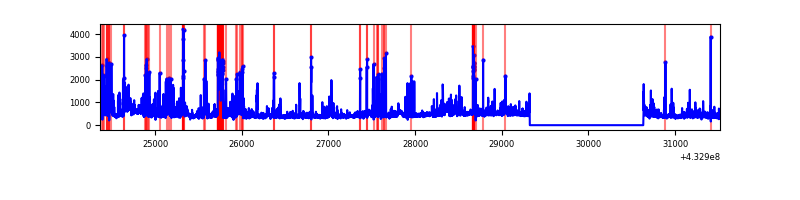 |
Top three noisy pixels from each quadrant. If the there are fewer than three noisy pixels in the level2.evt file, extra rows are filled as -1
| Pixel properties | Quadrant properties | ||||||
|---|---|---|---|---|---|---|---|
| Quadrant | DetID | PixID | Counts | Sigma | Mean | Median | Sigma |
| A | 10 | 83 | 613897 | 4935.39 | 603 | 589 | 124.3 |
| A | 15 | 222 | 377968 | 3036.83 | 603 | 589 | 124.3 |
| A | 15 | 237 | 239624 | 1923.55 | 603 | 589 | 124.3 |
| B | 0 | 189 | 89805 | 751.57 | 611 | 592 | 118.7 |
| B | 0 | 229 | 78966 | 660.26 | 611 | 592 | 118.7 |
| B | 0 | 186 | 36689 | 304.09 | 611 | 592 | 118.7 |
| C | 15 | 214 | 258008 | 1828.25 | 602 | 606 | 140.8 |
| C | 14 | 254 | 14578 | 99.24 | 602 | 606 | 140.8 |
| C | 15 | 159 | 5456 | 34.45 | 602 | 606 | 140.8 |
| D | 1 | 52 | 896883 | 6115.65 | 593 | 575 | 146.6 |
| D | 12 | 233 | 89335 | 605.62 | 593 | 575 | 146.6 |
| D | 2 | 234 | 29690 | 198.66 | 593 | 575 | 146.6 |
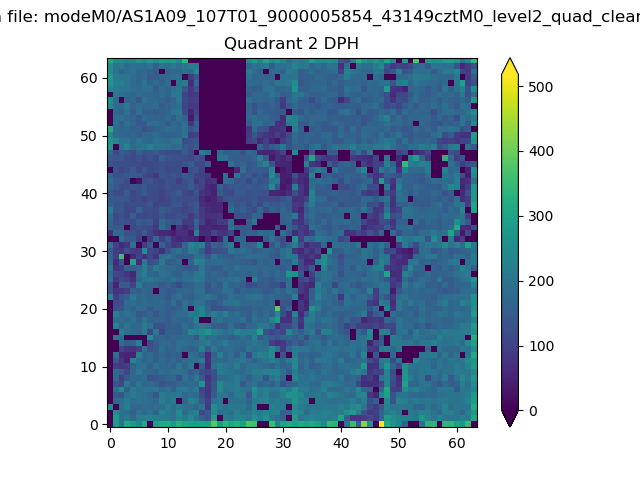
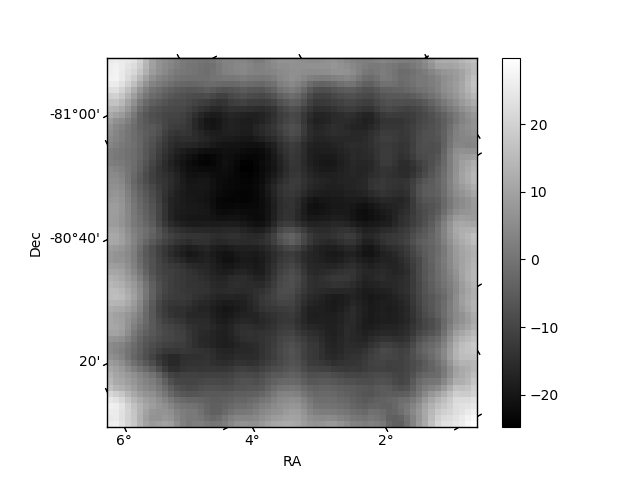
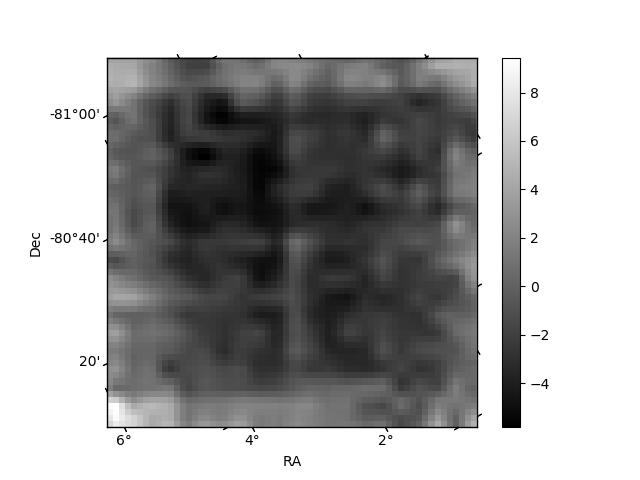
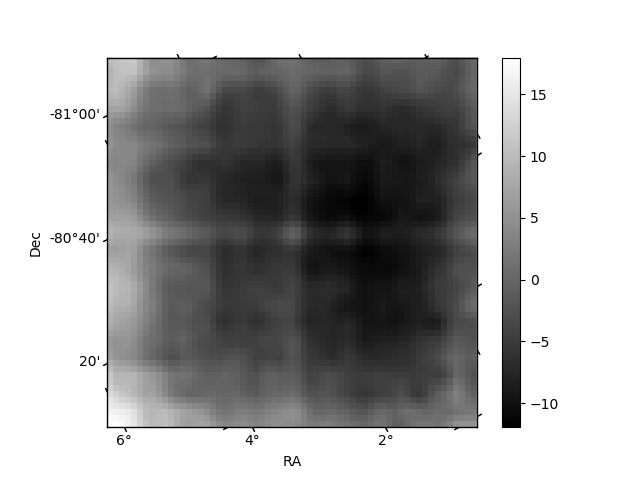
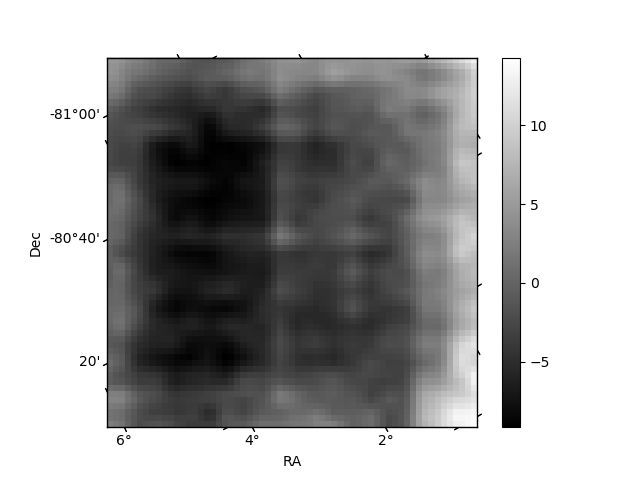
Histogram calculated using DETX and DETY for each event in the final _common_clean file
| Quadrant A | 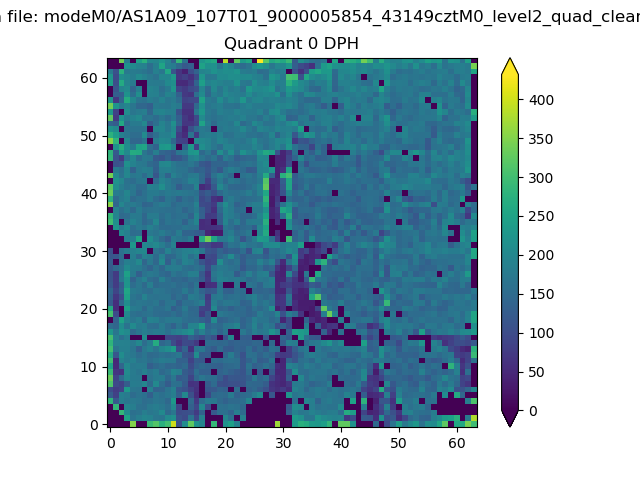 |
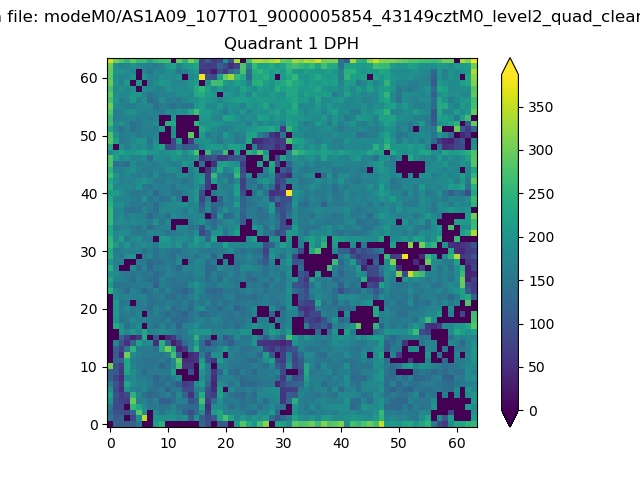 |
Quadrant B |
|---|---|---|---|
| Quadrant D | 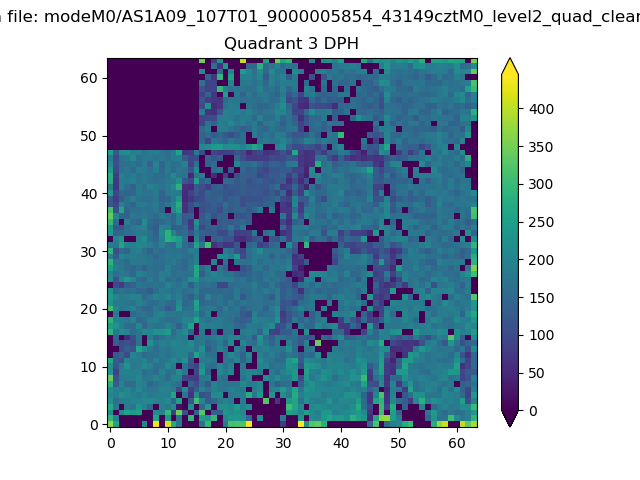 |
 |
Quadrant C |
| Plot type | Count rate plots | Images |
|---|---|---|
| Comparison with Poisson distribution Blue bars denote a histogram of data divided into 1 sec bins. Red curve is a Poisson curve with rate = median count rate of data. |
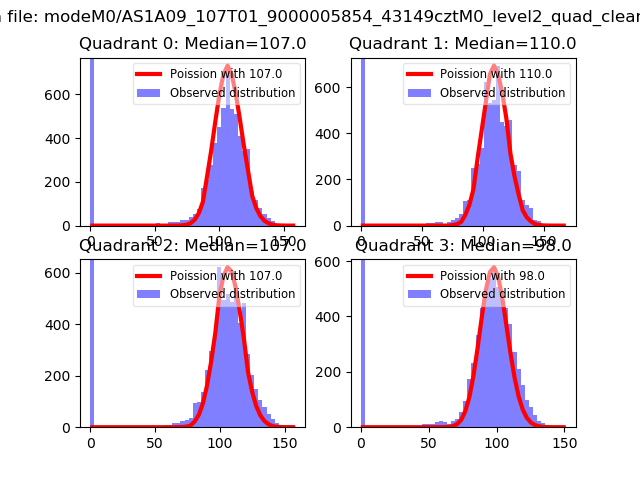 |
 |
| Quadrant-wise count rates Data is divided into 100 sec bins |
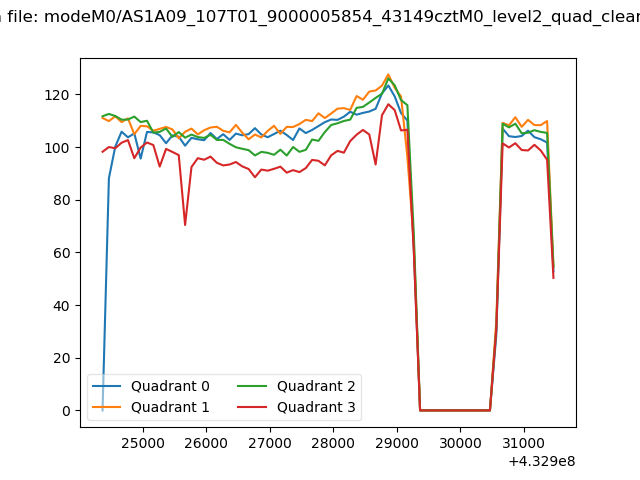 |
|
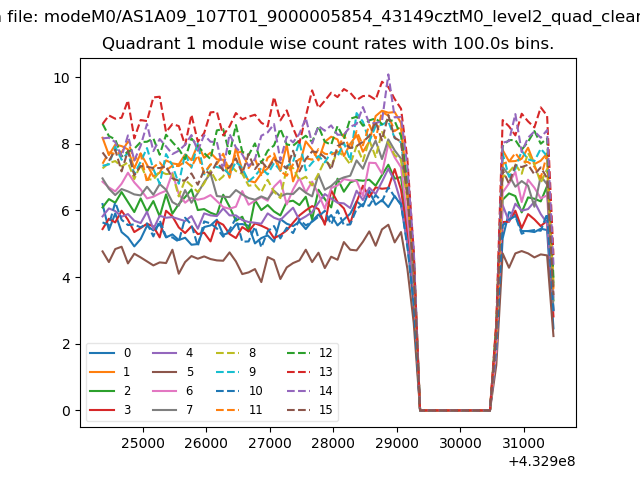
| Module-wise count rates for Quadrant A Data is divided into 100 sec bins |
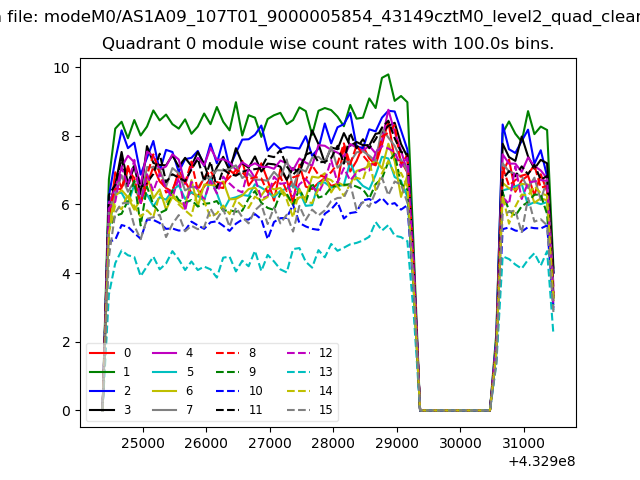 |
 |
| Module-wise count rates for Quadrant B Data is divided into 100 sec bins |
 |
 |
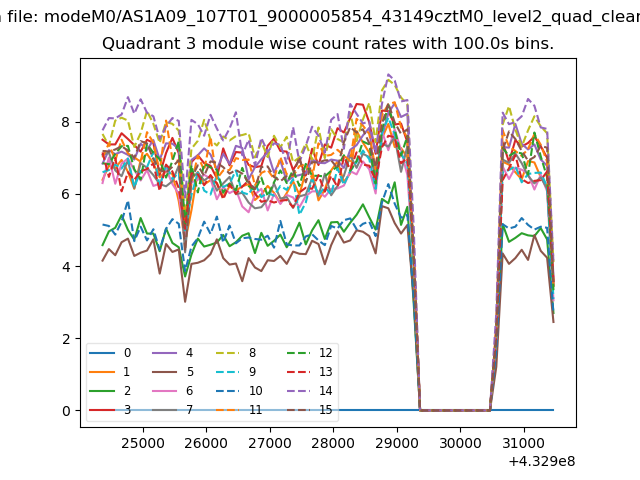
| Module-wise count rates for Quadrant C Data is divided into 100 sec bins |
 |
 |
| Module-wise count rates for Quadrant D Data is divided into 100 sec bins |
 |
 |
| Parameter | Plot |
|---|---|
| CZT HV Monitor | 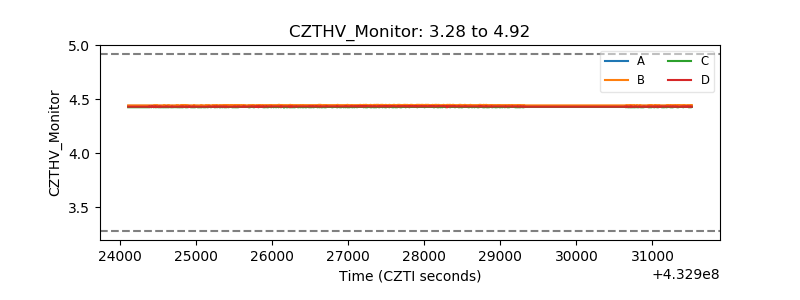 |
| D_VDD | 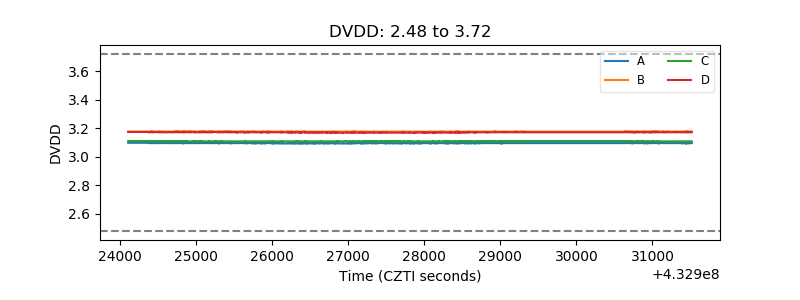 |
| Temperature 1 | 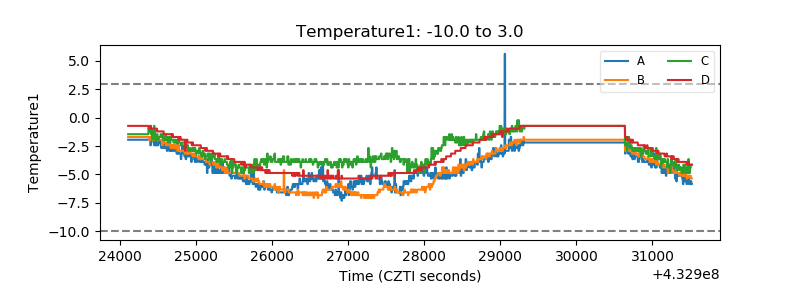 |
| Veto HV Monitor |  |
| Veto LLD | 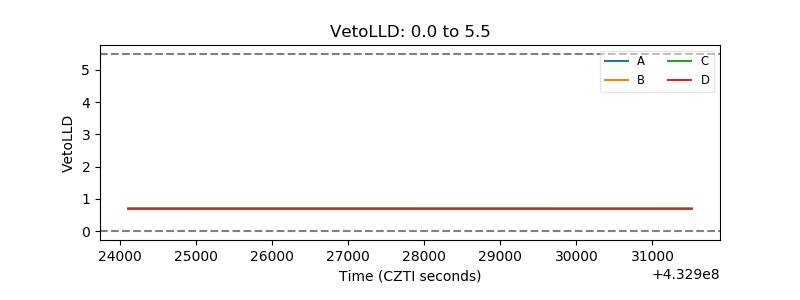 |
| Alpha Counter | 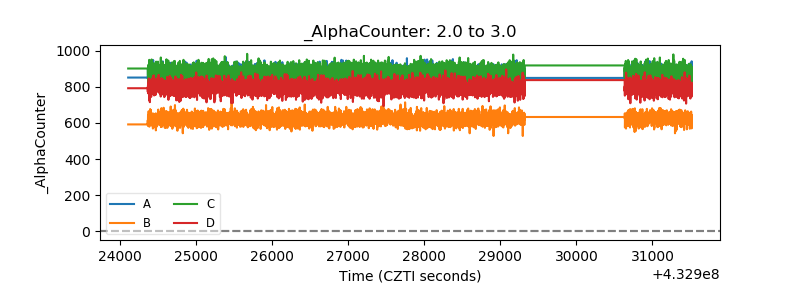 |
| _CPM_Rate |  |
| CZT Counter | 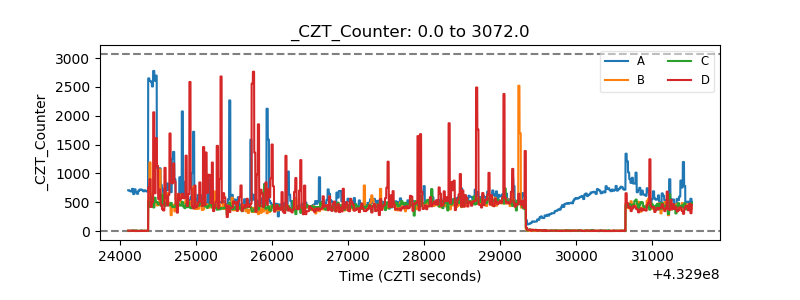 |
| +2.5 Volts monitor |  |
| +5 Volts monitor | 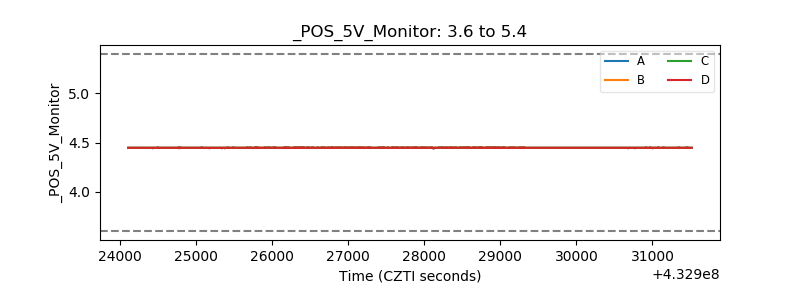 |
| _ROLL_ROT | 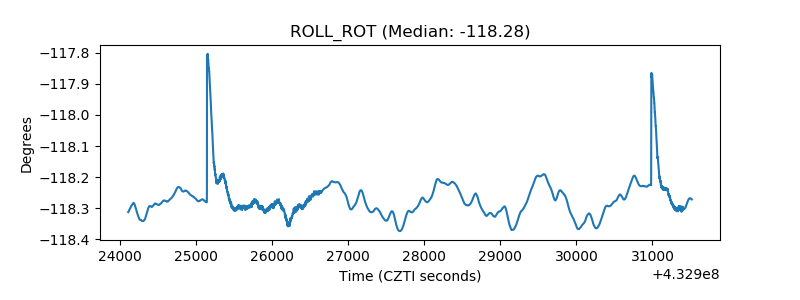 |
| _Roll_DEC | 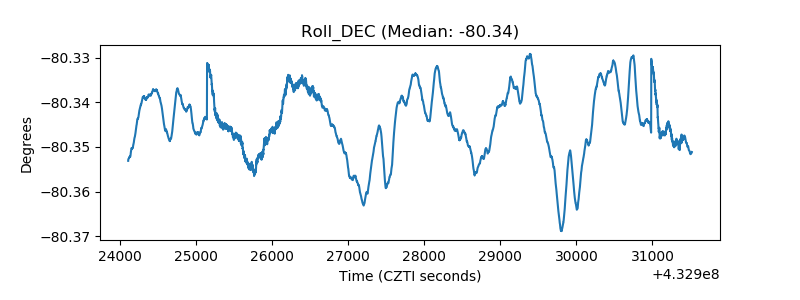 |
| _Roll_RA | 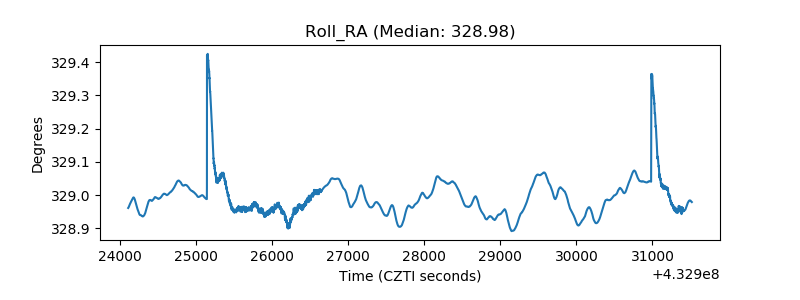 |
| Veto Counter | 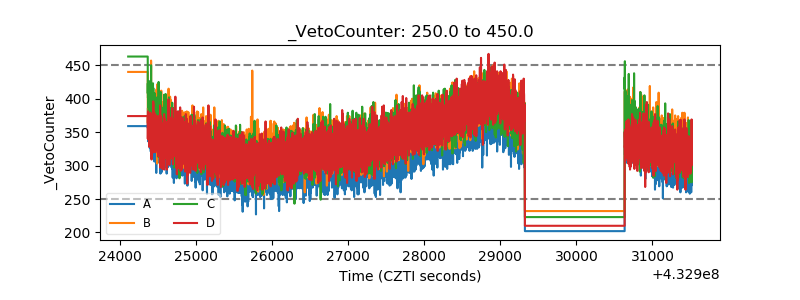 |